. 2014 Feb 19;81(4):766-78.
doi: 10.1016/j.neuron.2013.12.033. Epub 2014 Jan 30.

Mapping sensory circuits by anterograde transsynaptic transfer of recombinant rabies virus

Affiliations

Mapping sensory circuits by anterograde transsynaptic transfer of recombinant rabies virus

Niccolò Zampieri et al. Neuron. .

Abstract

Primary sensory neurons convey information from the external world to relay circuits within the CNS, but the identity and organization of the neurons that process incoming sensory information remains sketchy. Within the CNS, viral tracing techniques that rely on retrograde transsynaptic transfer provide a powerful tool for delineating circuit organization. Viral tracing of the circuits engaged by primary sensory neurons has, however, been hampered by the absence of a genetically tractable anterograde transfer system. In this study, we demonstrate that rabies virus can infect sensory neurons in the somatosensory system, is subject to anterograde transsynaptic transfer from primary sensory to spinal target neurons, and can delineate output connectivity with third-order neurons. Anterograde transsynaptic transfer is a feature shared by other classes of primary sensory neurons, permitting the identification and potentially the manipulation of neural circuits processing sensory feedback within the mammalian CNS.


Figures

Figure 1
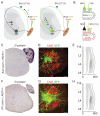
Figure 1. RV infection of DRG neurons and anterograde transfer to spinal targets
(A). Selective primary infection of sensory neurons using the EnvA/TVA system (left). RV-G complementation in sensory neurons allows RV-ΔG monosynaptic transfer in the anterograde direction to secondary targets in the spinal cord (right). (B) RV infection of motor neurons and sensory neurons (top). Selective sensory neuron infection after pseudotyping RV with EnvA and expression of the TVA receptor in sensory neurons (bottom). (C and F) RV-G mRNA expression in all sensory neurons in Avil::cre+/−; RGT+/− mice (C), and in a subset of sensory neurons in PV::cre+/−; RGT+/− mice (F). (D and G) RV monosynaptic labeling of motor neurons at lumbar level 3 (L3) of the spinal cord after RVΔG-GFP-EnvA injection in the GS muscle of Avil::cre+/−; RGT+/− mice (D) and PV::cre+/−; RGT+/− mice (G). (E and H) Contour density analysis of motor neuron distribution from T13 to L6 levels in the longitudinal plane of the spinal cord after RVΔG-GFP-EnvA injections in the GS muscle of Avil::cre+/−; RGT+/− mice (E; n=3), and PV::cre+/−; RGT+/− mice (H; n=7). Grey areas represent cumulative positions of ChAT+ neurons. Coordinates on the x-axis are distance in μm relative to the midline. Scale bars in D and G = 50 μm. To see related data examining motor and sensory neuron infection by RV, Figure S1, S2, and S3.
Figure 2
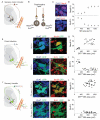
Figure 2. Specificity of RV anterograde transfer
(A) Schematic depicting proprioceptive sensory neuron innervation of α, but not γ motor neurons (“E” = Extrafusal muscle fibers; “I” = Intrafusal muscle fibers). (B) Molecular and anatomical distinctions between α and γ motor neurons. (C) Representative images of α motor neurons expressing NeuN (top) or γ motor neurons expressing Err3 (bottom). (D) Expression levels of NeuN (top) or Err3 (bottom) as a function of motor neuron soma area. (E) Schematic of RVΔG-GFP muscle injection resulting in direct infection of both α and γ motor neurons. (F and F′) ChAT and NeuN expression status in GFP+ motor neurons. (G) Quantitation of NeuN levels and motor neuron soma area following RVΔG-GFP muscle injection. (H and H′) ChAT and Err3 expression status in GFP+ motor neurons (I) Quantitation of Err3 levels and motor neuron soma area following RV-ΔG-GFP muscle injection. (J) Schematic depicting muscle injection of RVΔG-GFP-EnvA of PV::cre+/−; RGT+/− animals. Selective infection of sensory neurons and anterograde trans-synaptic transport will result in secondary infection of α, but not γ, motor neurons. (K and K′) GFP+, ChAT+, NeuN+ motor neurons in the spinal cord following injection of RVΔG-GFP-EnvA in PV::cre+/−; RGT+/− animals. (L) Quantitation of NeuN expression levels and motor neuron soma area of GFP+ neurons after RVΔG-GFP-EnvA muscle injection in PV::cre+/−; RGT+/− animals. (M and M′) GFP+, ChAT+, Err3 motor neurons in the spinal cord following RVΔG-GFP-EnvA muscle injection in PV::cre+/−; RGT+/− animals. (N) Quantitation of Err3 levels and motor neuron soma area of GFP+ neurons after RVΔG-GFP-EnvA muscle injection in PV::cre+/−; RGT+/− animals. f.i. – fluorescence intensity. Error bars in D represent +/− SEM. Scale bars in F and H = 20 μm, C, K and M = 30 μm.
Figure 3
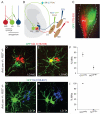
Figure 3. RV anterograde transfer reveals the organization of sensory-motor reflex arcs
(A) Basic organization of sensory-motor reflex arcs controlling the movement of the ankle joint. (B) Experimental design to probe patterns of sensory motor connections using RV. (C) Dorsal view of a mouse shank after MG (CTB-555) and LG (RVΔG-GFP-EnvA) muscle injections. (D-F) Analysis of MG status (CTB-555+) of GFP+ motor neurons after RVΔG-GFP-EnvA injection into the LG muscle of Avil::cre+/−; RGT+/− mice. (G-I) Analysis of TA status (CTB-647+) of GFP+ motor neurons after RVΔG-GFP-EnvA injection into the LG muscle of Avil::cre+/−; RGT+/− mice. Values in (F) and (I) show mean +/− SEM. Scale bars in D, E, G and H = 30 μm. To see related data examining axo-axonic transfer of RV, Figure S4.
Figure 4
Figure 4. RV anterograde transfer identifies sensory-recipient interneurons
(A) Representative image of GFP+ spinal interneurons labeled by trans-synaptic transfer following RVΔG-GFP-EnvA injection into the GS muscle of Avil::cre+/−; RGT+/− animals. (B) Contour density plot showing the distribution of post-sensory interneurons labeled by injection of RVΔG-GFP-EnvA into the GS muscle of Avil::cre+/−; RGT+/− animals. Coordinates are distance in μm relative to the central canal. (C) Representative image of GFP+ spinal interneurons labeled by trans-synaptic transfer following RVΔG-GFP-EnvA injection into the GS muscle of PV::cre+/−; RGT+/− animals. (D) Contour density plot showing the distribution of post-sensory interneurons labeled following injection of RVΔG-GFP-EnvA into the GS muscle of PV::cre+/−; RGT+/− animals. Coordinates are distance in μm relative to the central canal. (E) Schematic depicting labeling of defined interneuron classes in the spinal cord by anterograde trans-synaptic tracing in PV::cre+/−; RGT+/− animals. (F) Representative images of FoxP2+ interneurons labeled from trans-synaptic transfer from PV+ sensory afferents. (G) Chx10+ (V2a) interneurons labeled from trans-synaptic transfer from PV+ sensory afferents. (H) Lhx1+ (V0/dl4) interneuron labeled from trans-synaptic transfer from PV+ sensory afferents. Insets in (F, G, H) show additional example of each cell type. cc = central canal. Scale bars in A and C = 50 μm, F, G and H = 30 μm.
Figure 5
Figure 5. RV anterograde and retrograde transfer reveals V0C input/output connectivity
(A) Schematic showing anterograde trans-synaptic tracing from PV+ sensory neurons and labeling of V0C interneurons. (B) Representative image of a GFP+/ChAT+ V0C interneuron after RV trans-synaptic transfer from PV+ sensory neurons. (C) GFP+/vAChT+ C-boutons apposed to motor neuron cell bodies, insets show higher magnification. (D) Schematic depicting monosynaptic retrograde tracing strategy from V0C interneurons. (E) Representative image showing GFP+ interneurons in the lumbar spinal cord. Insets show higher magnification of RV infected V0C interneuron (top) and ventral horn of spinal cord in same experiments (bottom). (F) Identification of laminae II/III by PKCγ immunostaining shows that the majority of spinal interneuron inputs to V0c are located dorsal to laminae III. (G) Representative image of Runx3 and PV status of DRG sensory neurons retrogradely infected from V0C interneurons. (H) Representative image of TrkA status of DRG sensory neurons retrogradely infected from V0C interneurons. (I) Analysis of TrkA, PV and PV/Runx3 expression in GFP+ sensory neurons retrogradely infected from V0C interneurons (J) Identification of GFP+ C-boutons apposed to motor neurons by co-labeling with the pre-synaptic marker vAChT and the postsynaptic marker connexin-32 (Nagy et al., 1993). Scale bars in B, E, F, G and H = 50 μm; C and J = 2 μm.
Figure 6
Figure 6. Anterograde trans-synaptic transfer of RV from vestibular and olfactory sensory neurons
(A) Schematic depicting anterograde trans-synaptic transport from vestibular sensory neurons (VSN). (B) Representative image of GFP+ neurons in the medial, superior and lateral vestibular nuclei (MVN, SVN, LVN respectively). (C) Higher magnification image of neurons in the lateral vestibular nucleus. (D) Representative image of the ventral horn of the lumbar spinal cord showing GFP+ axons nearby ChAT+ motor neurons. (E) Schematic depicting strategy for anterograde trans-synaptic tracing from olfactory sensory neurons (OSN). (F) Representative image of the olfactory bulb showing anterogradely infected GFP+ neurons. (G) High magnification image of GFP+ periglomerular cells (PGC). (H) High magnification image of GFP+ mitral (MC) and tufted cells (TC). Scale bars in B and F = 250 μm; C, D, G and H = 30 μm. To see related data examining OSN axon terminals in the olfactory bulb, Figure S5.
Figure 7
Figure 7. Strategies for sensory circuit mapping using anterograde RV trans-synaptic transfer
(A) RV infection of primary sensory neurons (1) and anterograde (“A”) transport into sensory-recipient (2) neurons allows visualization of synaptic inputs to third (3) order neurons. (B) Dual color anterograde tracing from different primary sensory neuron populations permits analysis of convergent input to single sensory-recipient neurons. (C) Combination of anterograde transport from sensory neurons with retrograde (“R”) tracing from central neurons permits isolation of intervening second order neurons.

Similar articles

Cited by

References

    1. Abraira VE, Ginty DD. The sensory neurons of touch. Neuron. 2013;79:618–639. - PMC - PubMed
    1. Al-Mosawie A, Wilson JM, Brownstone RM. Heterogeneity of V2-derived interneurons in the adult mouse spinal cord. Eur J Neurosci. 2007;26:3003–3015. - PubMed
    1. Ashrafi S, Lalancette-Hebert M, Friese A, Sigrist M, Arber S, Shneider NA, Kaltschmidt JA. Wnt7A identifies embryonic gamma-motor neurons and reveals early postnatal dependence of gamma-motor neurons on a muscle spindle-derived signal. J Neurosci. 2012;32:8725–8731. - PMC - PubMed
    1. Astic L, Saucier D, Coulon P, Lafay F, Flamand A. The CVS strain of rabies virus as transneuronal tracer in the olfactory system of mice. Brain Res. 1993;619:146–156. - PubMed
    1. Betley JN, Wright CV, Kawaguchi Y, Erdelyi F, Szabo G, Jessell TM, Kaltschmidt JA. Stringent specificity in the construction of a GABAergic presynaptyic inhibitory circuit. Cell. 2009;139:161–174. - PMC - PubMed

Publication types