. 2014 Feb 13;156(4):649-62.
doi: 10.1016/j.cell.2014.01.020. Epub 2014 Jan 30.

Nonstochastic reprogramming from a privileged somatic cell state

Affiliations

Nonstochastic reprogramming from a privileged somatic cell state

Shangqin Guo et al. Cell. .

Abstract

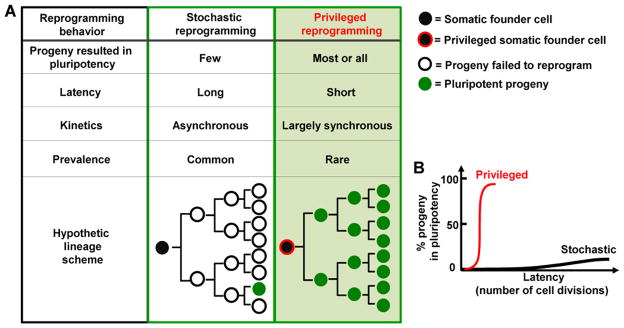
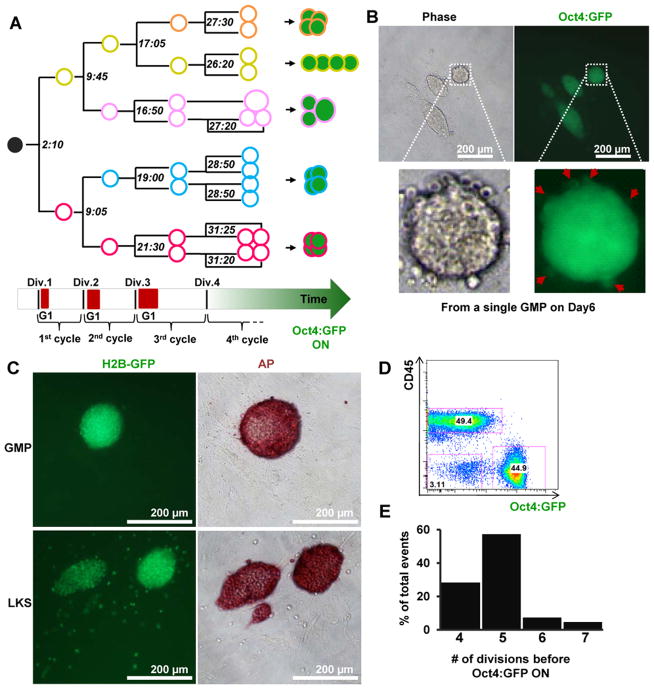
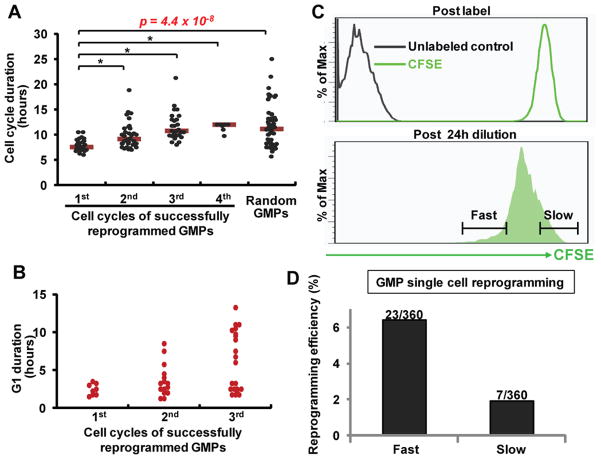
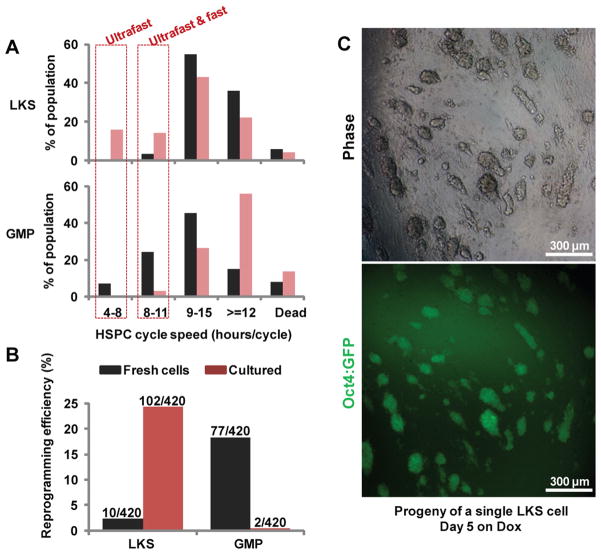
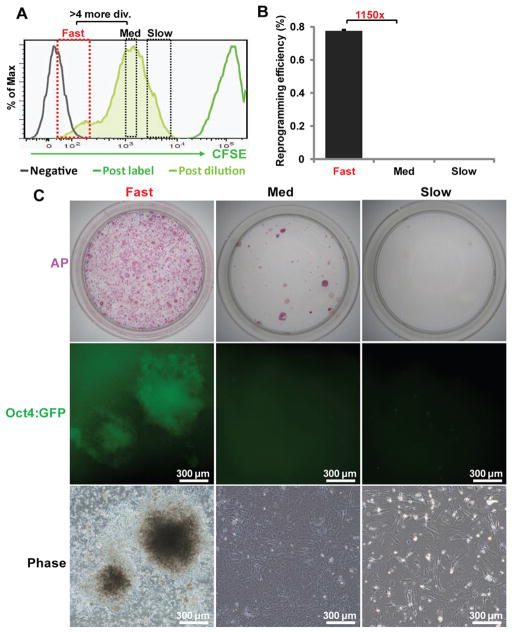
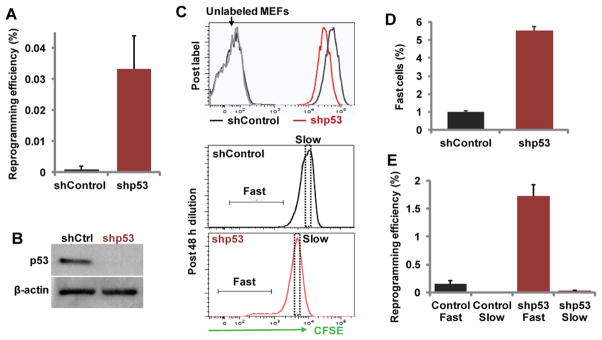
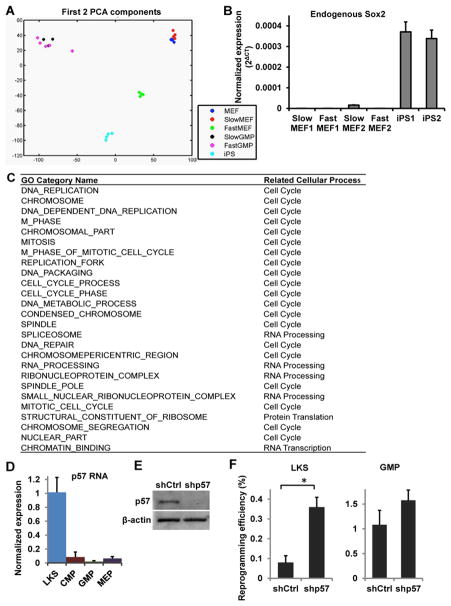
Reprogramming somatic cells to induced pluripotency by Yamanaka factors is usually slow and inefficient and is thought to be a stochastic process. We identified a privileged somatic cell state, from which acquisition of pluripotency could occur in a nonstochastic manner. Subsets of murine hematopoietic progenitors are privileged whose progeny cells predominantly adopt the pluripotent fate with activation of endogenous Oct4 locus after four to five divisions in reprogramming conditions. Privileged cells display an ultrafast cell cycle of ∼8 hr. In fibroblasts, a subpopulation cycling at a similar ultrafast speed is observed after 6 days of factor expression and is increased by p53 knockdown. This ultrafast cycling population accounts for >99% of the bulk reprogramming activity in wild-type or p53 knockdown fibroblasts. Our data demonstrate that the stochastic nature of reprogramming can be overcome in a privileged somatic cell state and suggest that cell-cycle acceleration toward a critical threshold is an important bottleneck for reprogramming. PAPERCLIP:


Figures

Figure 1
Figure 1. Comparison between stochastic and privileged reprogramming
(A) Hypothetic cell lineages with respect to the somatic founder cells and pluripotent progeny. The number of cell generations depicted is for illustration purpose and does not represent the actual situations. (B) Contrasting stochastic and privileged reprogramming with regard to their efficiency and latency.
Figure 2
Figure 2. Non-stochastic reprogramming from a subset of GMPs
(A) A representative lineage map from a single GMP to Oct4:GFP+ progeny. The color of the circles corresponds to the color of arrows in Movie S1 and Figure S1A. Lines denote lineage relationship. Filled green circles denote Oct4:GFP fluorescence as detectible by time-lapse imaging. The numbers (hours:minutes) at each branching point indicate the time when mitosis occurred and were used to derive cell cycle lengths. Red blocks on the horizontal block arrow indicate reporter signals of a G1 phase reporter (see Figure S2 and Movie S2). (B) GMPs were transduced with Dox-inducible Yamanaka factors and single cell sorted into 96-well plates in reprogramming conditions (scheme in Figure S5A). Representative images of the reprogramming product of a single GMP are shown. Note the presence of multiple sister colonies and many of the round-shaped cells in the vicinity of Oct4:GFP+ colonies are also GFP+ (zoom in, red arrows). (C) GMP and LKS cells from H2B-GFP mice were reprogrammed as single cells. Representative images of the reprogramming culture from a single GMP (top row) or LKS cell (bottom row) after 6 days of Dox induction are shown. Note the presence of H2B-GFP+, alkaline phosphatase (AP) negative cells in LKS-initiated culture, but not in the GMP-initiated culture. Slight increase in colony sizes was noted after fixation/staining. (D) GMP-initiated reprogramming culture were trypsinized after 6 days of Dox-induction and stained with a CD45 antibody. A representative FACS plot shows that CD45+ hematopoietic cells and Oct4:GFP+ cells make up ~97% of the culture. (E) The number of mitotic divisions before Oct4:GFP became detectible by imaging (n=38). See also Figures S1, S2, S5A, Table S1 and Movies S1, S2.
Figure 3
Figure 3. Privileged GMPs display an ultrafast cell cycle
(A) Cell cycle lengths of successfully reprogrammed GMP lineages. Each dot represents a mitotic event which gave rise to Oct4:GFP+ cells. More dots were scored for cell cycles 2 and 3 due to cell number increase following previous divisions. Within the same imaging experiments, the first cell cycle of random GMPs (n=54) was also measured. Pooled data of 14 lineages from 5 independent imaging experiments are shown. *p<0.001. (B) A G1 phase reporter was used to measure G1 duration by time-lapse imaging. Each dot represents a mitotic event that gave rise to Oct4:GFP+ cells. (C) Representative FACS plots of GMPs immediately after CFSE label (top) and following 24 hours of dye dilution (bottom). The gating strategy for sorting fast and slow cycling cells is shown. (D) The fast and slow cycling GMPs were single cell sorted into 96-well plates in reprogramming conditions. The number of wells that contained Oct4:GFP+ colonies and the total number of plated wells are indicated, separated by a slash. See also Figures S2, S3, Table S2 and Movie S2.
Figure 4
Figure 4. Accelerating HSPC cycling increases reprogramming efficiency and induces the emergence of privileged cells
(A) The cell cycle speed of LKS and GMP cells were measured, either fresh (black bars) or after 5 days of culture (red bars). The percentage of cells with indicated cell cycle speed is plotted (details in Extended Experimental Procedures and Figure S4). Note that fresh GMPs and cultured LKS cells contain ultrafast cycling cells (red boxes), which were low/absent in fresh LKS cells and cultured GMPs. (B) The reprogramming efficiency of fresh or cultured LKS and GMP cells were compared in single cell reprogramming assays. The number of wells that contained Oct4:GFP+ colonies and the total number of plated wells are indicated, separated by a slash. (C) Singly sorted LKS cells were cultured for 5 days and its somatic progeny transferred into reprogramming conditions for another 5 days (scheme shown in Figure S5B). Shown is one representative well dominated by Oct4:GFP+ colonies and lacked hematopoietic-like cells. ~15% of the wells containing Oct4:GFP+ colonies (or 3.6% of total wells) displayed this privileged reprogramming behavior. Images were captured with 10x magnification. See also Figures S4, S5 and Tables S3, S4.
Figure 5
Figure 5. Ultrafast cycling cells emerge from fibroblasts after Yamanaka factor expression and harbor the majority of reprogramming activity
Factor transduced MEFs were treated with Dox for 4 days, labeled with CFSE and allowed for dye-dilution for 48 hours in the presence of Dox. (A) The levels of CSFE in non-labeled MEFs (negative), right after labeling (post-label), or following 48 hours of dilution (post-dilution) are shown. The gates for fast, medium (med) and slow cycling cells are shown. Note that the fluorescence intensity difference between fast and medium populations indicates >4 division (div.) differences. (B) Reprogramming efficiency of cells sorted on CFSE. Oct4:GFP+ colonies were scored on day 20 from initial Dox induction (n=3 per condition, error bars indicate standard deviation). (C) Representative images of the reprogramming cultures from cells of different cycling speed. Phase and Oct4:GFP images were captured at 10x magnification and alkaline phosphatase (AP) stained dishes were from whole 60mm plates. See also Figure S6.
Figure 6
Figure 6. The ultrafast cycling population from MEFs is increased by p53 knockdown and account for most reprogramming activity
MEFs were transduced with either control (shCtrl) or shRNAs targeting p53 (shp53), along with the Dox-inducible reprogramming factors. (A) p53-knockdown increased reprogramming in un-fractionated MEFs. (B) Western blot analysis confirmed p53 protein down-regulation by p53-targeting shRNAs. (C–D) Factor-transduced MEFs on 4 days of Dox treatment were labeled with CFSE (top) and allowed to dilute the dye for another 48 hours. The cultures were then trypsinized and CFSE intensity analyzed by FACS. (C) Representative FACS plots are shown for CSFE levels right after labeling, or following 48 hours of dye-dilution. Gating for fast and slow cells are shown. (D) Quantification of fast cycling cells (n=3 per condition). (E) Reprogramming efficiency of the sorted fast and slow cycling MEFs as shown in (C) (n=3 per condition). Error bars indicate standard deviation.
Figure 7
Figure 7. Molecular characterization of the cellular states
(A) Principle Component Analysis (PCA) was performed on RNA sequencing data. Isolation of fast and slow cells was performed as described above. Dox-independent reprogrammed cells (iPS) and bulk MEFs (MEF) were included as controls. Three to five replicates were used for each cell type. (B) The endogenous Sox2 level was measured by qRT-PCR using primers specific for its 3′UTR region. Two biological replicates for each cell type are shown. (C) Gene Set Enrichment Analysis (GSEA) was performed comparing the fast cells (FastGMP and FastMEF) versus the slow cells (MEF and SlowMEF). The top 25 Gene Ontology (GO) categories enriched in both fast cell populations are shown. (D) qRT-PCR analysis of p57 mRNA level in HSPCs. (E) Western blot analysis confirms p57 protein down-regulation by p57 targeting shRNAs. (F) Reprogramming efficiency of LKS and GMP cells following treatment with control (shCtrl) or p57 targeting shRNAs (shp57). Error bars indicate standard deviation. See also Figure S7.

Comment in

  • Speeding to pluripotency.
    Chenoweth JG, McKay RD. Chenoweth JG, et al. Cell. 2014 Feb 13;156(4):631-2. doi: 10.1016/j.cell.2014.01.046. Cell. 2014. PMID: 24529370

References

    1. Aasen T, Raya A, Barrero MJ, Garreta E, Consiglio A, Gonzalez F, Vassena R, Bilic J, Pekarik V, Tiscornia G, et al. Efficient and rapid generation of induced pluripotent stem cells from human keratinocytes. Nat Biotechnol. 2008;26:1276–1284. - PubMed
    1. Banito A, Rashid ST, Acosta JC, Li S, Pereira CF, Geti I, Pinho S, Silva JC, Azuara V, Walsh M, et al. Senescence impairs successful reprogramming to pluripotent stem cells. Genes Dev. 2009;23:2134–2139. - PMC - PubMed
    1. Buganim Y, Faddah DA, Cheng AW, Itskovich E, Markoulaki S, Ganz K, Klemm SL, van Oudenaarden A, Jaenisch R. Single-cell expression analyses during cellular reprogramming reveal an early stochastic and a late hierarchic phase. Cell. 2012;150:1209–1222. - PMC - PubMed
    1. Carey BW, Markoulaki S, Beard C, Hanna J, Jaenisch R. Single-gene transgenic mouse strains for reprogramming adult somatic cells. Nat Methods. 2010;7:56–59. - PMC - PubMed
    1. Carey BW, Markoulaki S, Hanna J, Saha K, Gao Q, Mitalipova M, Jaenisch R. Reprogramming of murine and human somatic cells using a single polycistronic vector. Proc Natl Acad Sci U S A. 2009;106:157–162. - PMC - PubMed

Publication types

Associated data