. 2014 Mar 20:317:40-9.
doi: 10.1016/j.tox.2014.01.006. Epub 2014 Jan 28.

Developmental cigarette smoke exposure: hippocampus proteome and metabolome profiles in low birth weight pups

Affiliations

Developmental cigarette smoke exposure: hippocampus proteome and metabolome profiles in low birth weight pups

Rachel E Neal et al. Toxicology. .

Abstract

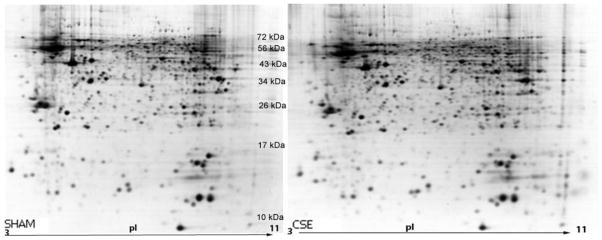
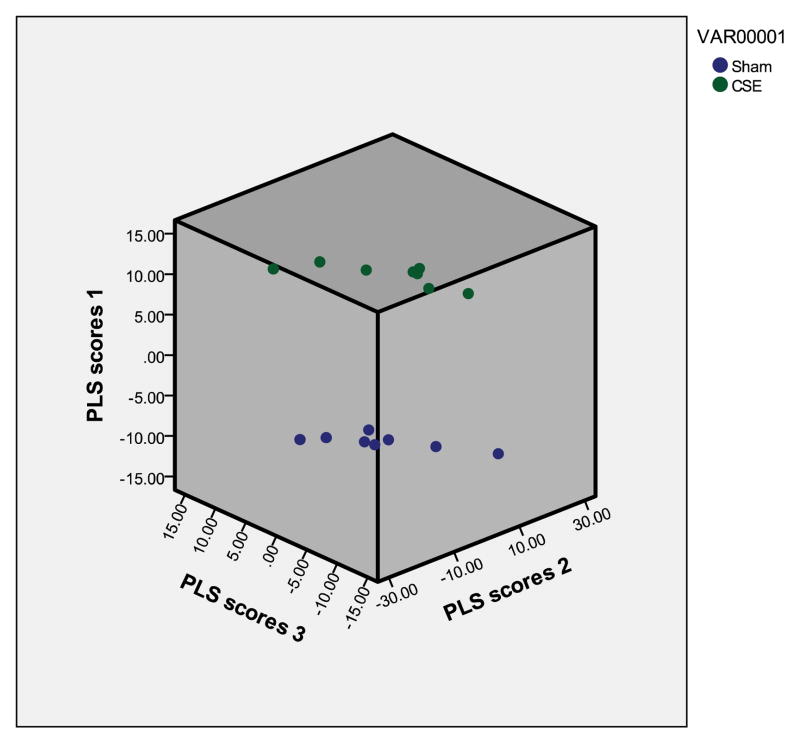
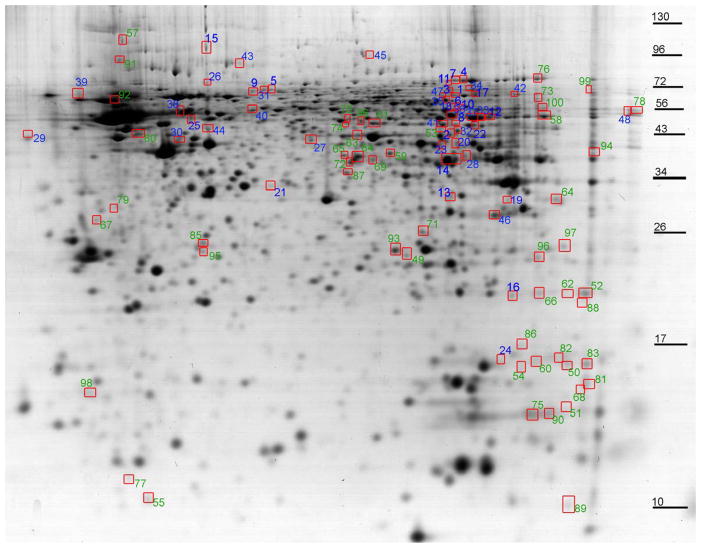
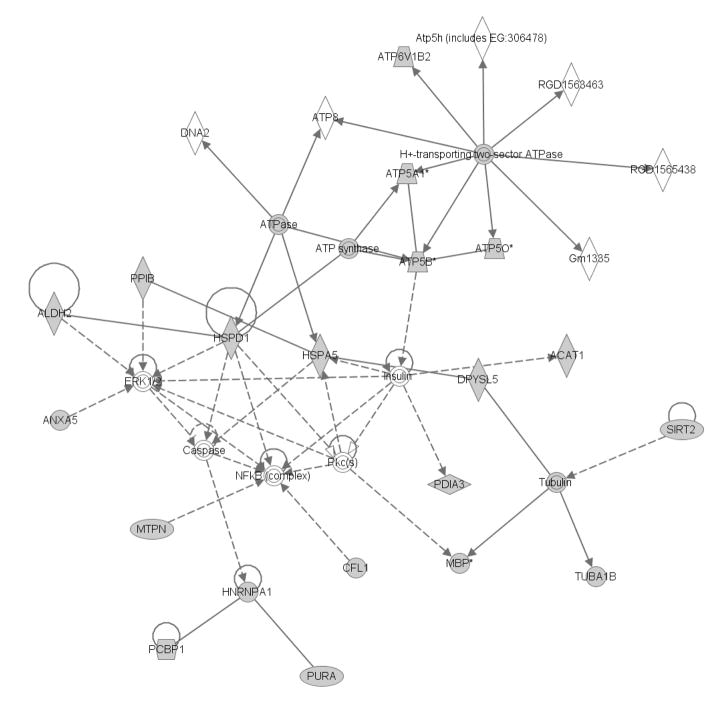
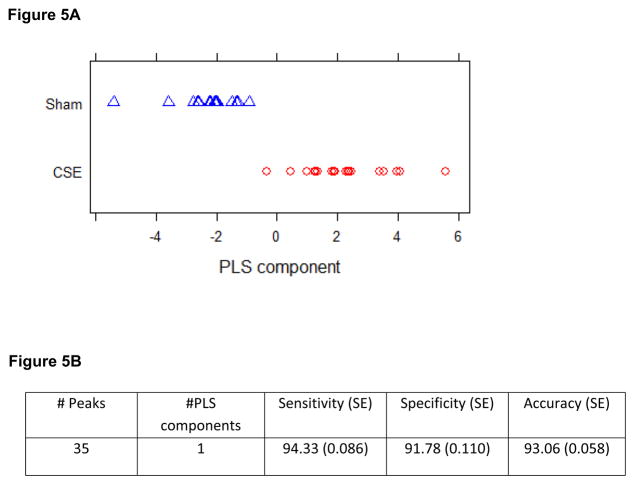
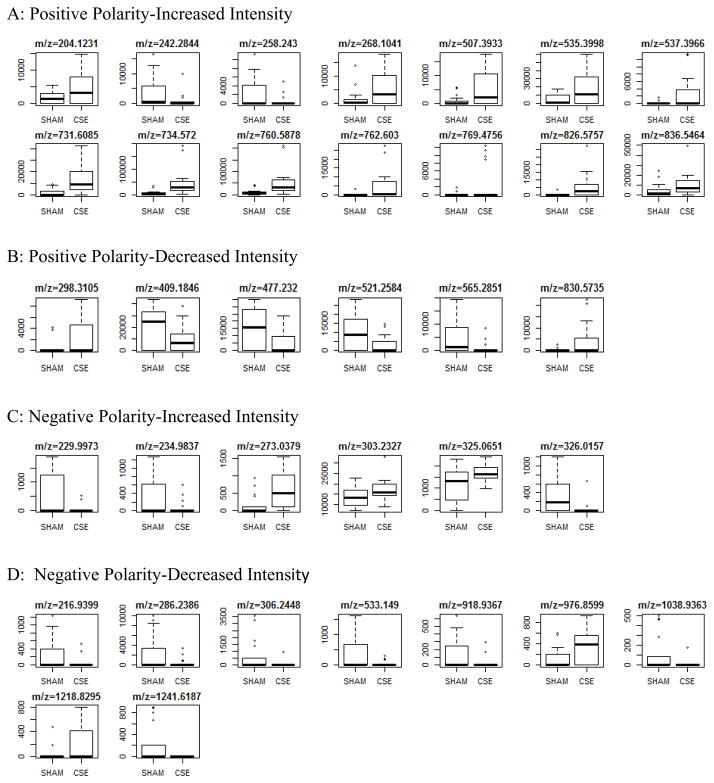
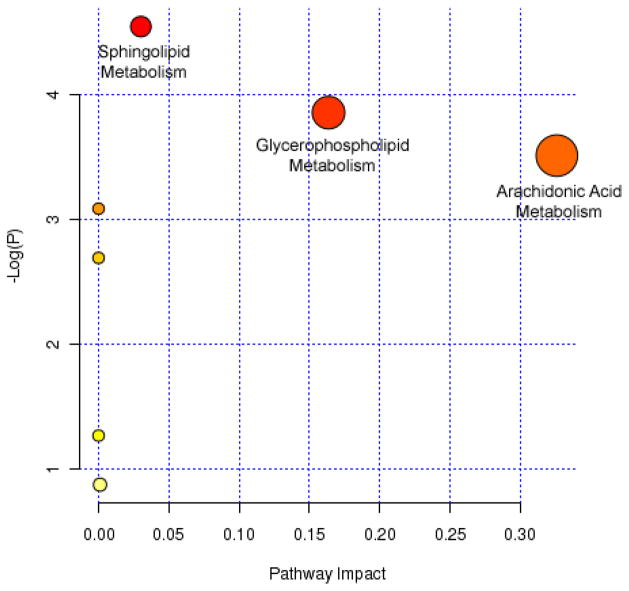
Exposure to cigarette smoke during development is linked to neurodevelopmental delays and cognitive impairment including impulsivity, attention deficit disorder, and lower IQ. However, brain region specific biomolecular alterations induced by developmental cigarette smoke exposure (CSE) remain largely unexplored. In the current molecular phenotyping study, a mouse model of 'active' developmental CSE (serum cotinine > 50 ng/mL) spanning pre-implantation through third trimester-equivalent brain development (gestational day (GD) 1 through postnatal day (PD) 21) was utilized. Hippocampus tissue collected at the time of cessation of exposure was processed for gel-based proteomic and non-targeted metabolomic profiling with partial least squares-discriminant analysis (PLS-DA) for selection of features of interest. Ingenuity pathway analysis was utilized to identify candidate molecular and metabolic pathways impacted within the hippocampus. CSE impacted glycolysis, oxidative phosphorylation, fatty acid metabolism, and neurodevelopment pathways within the developing hippocampus.

Keywords: Cigarette smoke; Development; Hippocampus; Metabolome; Proteome; Tobacco.


Figures

Figure 1
Figure 1. Representative 2D-SDS-PAGE gels of the urea-soluble hippocampus proteins from SHAM and CSE offspring
The figure depicts a side-by-side comparison of protein spot separations based on isoelectric focusing point (horizontal) and molecular weight (vertical) in the two experimental groups (SHAM-left; CSE-right). The gels are similar in number of spots without the appearance or loss of spots between groups. The contrast of these images has been uniformly altered to accentuate low abundant protein spots. Subsequent analyses of protein spot alterations between the groups were based on unaltered contrast images.
Figure 2
Figure 2. Latent factors plotted in 3D from the proteome PLS-DA model
A graphical representation of the differences between sample groups based on the relative abundances of protein spots is shown by plotting each sample within a matrix composed of the top 3 latent factors (eigenvectors). The clear separation of the groups is visible with consistency in the hippocampus proteome profile of each biological replicate within the groups (Blue=Sham; Green=CSE). All protein spots from all 2D gels (excluding noise) were included in the calculation of VIP rankings and the graphing of the separation of groups by latent factors.
Figure 3
Figure 3. At PD21, the urea soluble hippocampus proteome profiles are altered by developmental CSE
The protein spots with altered abundance following developmental CSE are circled and numbered. Numbers in blue represent decreased abundance proteins and the numbers in green represent increased abundance proteins. These protein spots were ranked according to the Variable Import in Projection score (VIP ≥1.7) based on the PLS-DA model and contributed to the separation of the proteome profiles of the SHAM and CSE groups. Protein spots that were identified are listed in Tables 1–3.
Figure 4
Figure 4. The cellular compromise, nucleic acid metabolism, and small molecule biochemistry pathways are impacted in the hippocampus by developmental CSE
Proteins identified as contributing to the separation of the groups (CSE and Sham; PD21) are shadowed and connected to the network by arrows denoting directionality of impact. Several of these proteins also are designated members of the Cancer, hematological disease, and reproductive system disease network that was also impacted by developmental CSE. In the associated figure, solid lines indicated a direct interaction while dotted lines indicate an indirect interaction. Geometric shapes identify classes of proteins: phosphatases (triangle), kinases (inverted triangle), enzymes (vertical diamond), transcription regulators (horizontal ellipse), transporters (trapezoid), and other important molecules (circles).
Figure 5
Figure 5
Figure 5A: Latent factors plotted in 3D from the metabolome PLS-DA model. A graphical representation of the differences between sample groups based on the relative abundances of m/z features is shown by plotting each sample within a single latent factor. All m/z features (excluding noise and isotopically linked m/z features) were included in the calculation of VIP rankings and the graphing of the separation of groups by latent factors Figure 5B: A PLS-DA model using 1 component with 35 m/z features was fit to the training data obtained from randomly partitioning the data 100 times into training and test sets. The table below shows the average performance of the fitted models over the 100 test sets.
Figure 6
Figure 6
Spectral intensities of metabolite features of interest that differ between groups in the hippocampus of offspring exposed to CSE throughout development (GD1-PD21). Features of interest are subdivided into four categories based on polarity and directionality of impact.
Figure 7
Figure 7. Metabolite features with putative identifications were analyzed for potential impact on meabolic pathways
Arachidonic acid, glycerophospholipid, and sphingolipid metabolism pathways were impacted in the hippocampus of offspring exposed to CSE throughout development (GD1-PD21).

Similar articles

Cited by

References

    1. 2012 Current cigarette smoking among adults - United States. MMWR Morb Mortal Wkly Rep. 2011;61:889–894. - PubMed
    1. Abel EL. Smoking during pregnancy: a review of effects on growth and development of offspring. Hum Biol. 1980;52:593–625. - PubMed
    1. Ajarem JS, Ahmad M. Prenatal nicotine exposure modifies behavior of mice through early development. Pharmacol Biochem Behav. 1998;59:313–318. - PubMed
    1. Amos-Kroohs RM, Williams MT, Braun AA, Graham DL, Webb CL, Birtles TS, Greene RM, Vorhees CV, Pisano MM. Neurobehavioral phenotype of C57BL/6J mice prenatally and neonatally exposed to cigarette smoke. Neurotoxicol Teratol. 2013;35:34–45. - PMC - PubMed
    1. Arnold SE, Trojanowski JQ. Human fetal hippocampal development: I. Cytoarchitecture, myeloarchitecture, and neuronal morphologic features. J Comp Neurol. 1996a;367:274–292. - PubMed

Publication types

MeSH terms