. 2014 Feb 10;25(2):196-209.
doi: 10.1016/j.ccr.2014.01.003. Epub 2014 Jan 30.

UHRF1 overexpression drives DNA hypomethylation and hepatocellular carcinoma

Affiliations

UHRF1 overexpression drives DNA hypomethylation and hepatocellular carcinoma

Raksha Mudbhary et al. Cancer Cell. .

Abstract

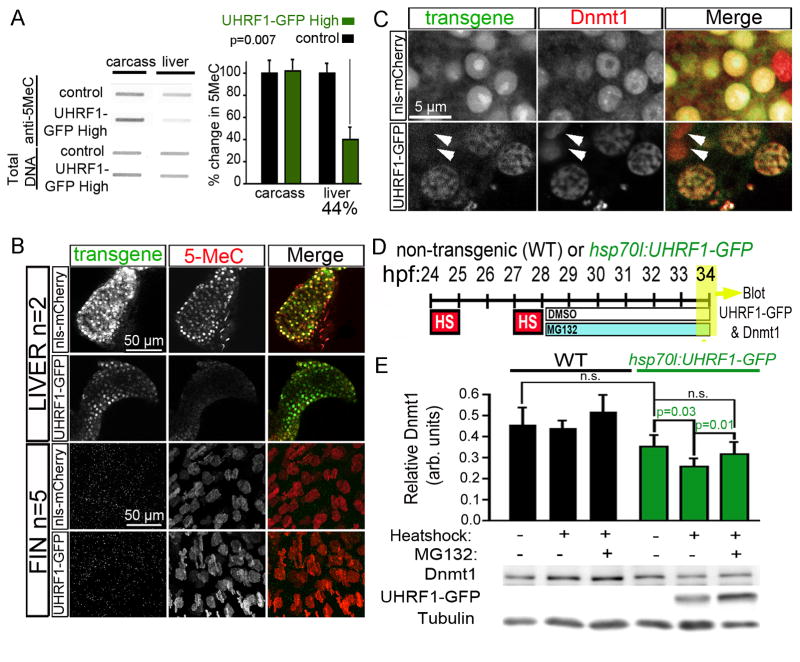
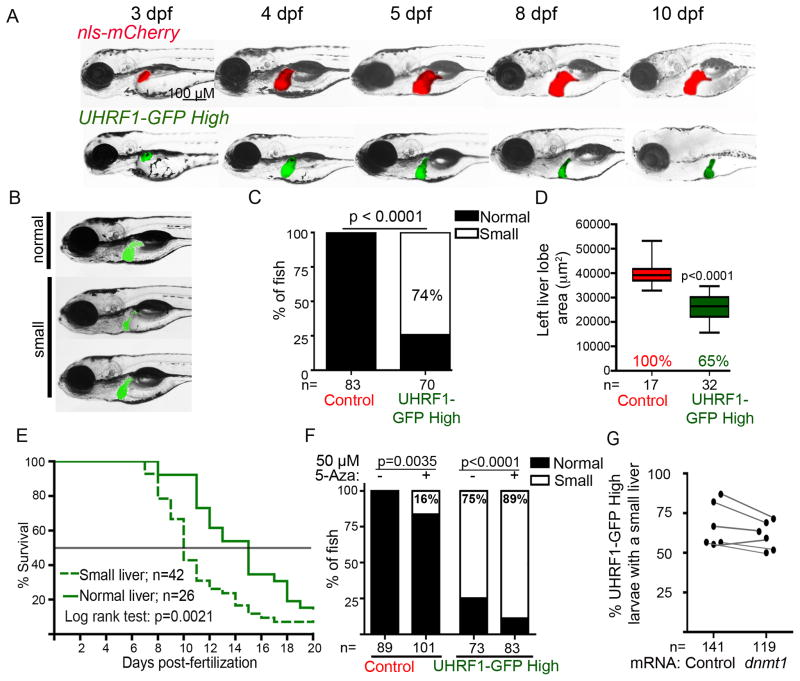
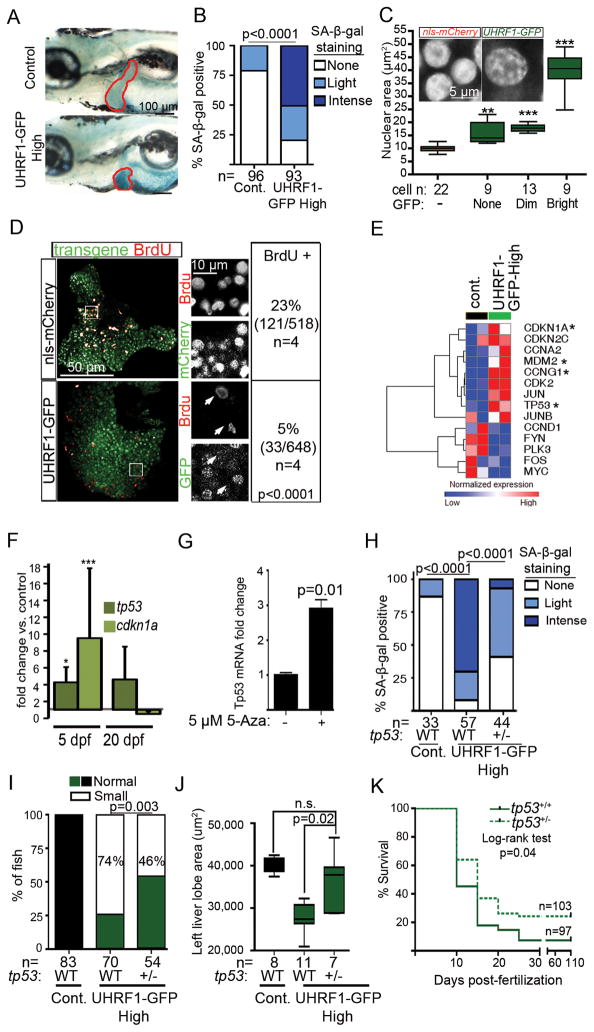
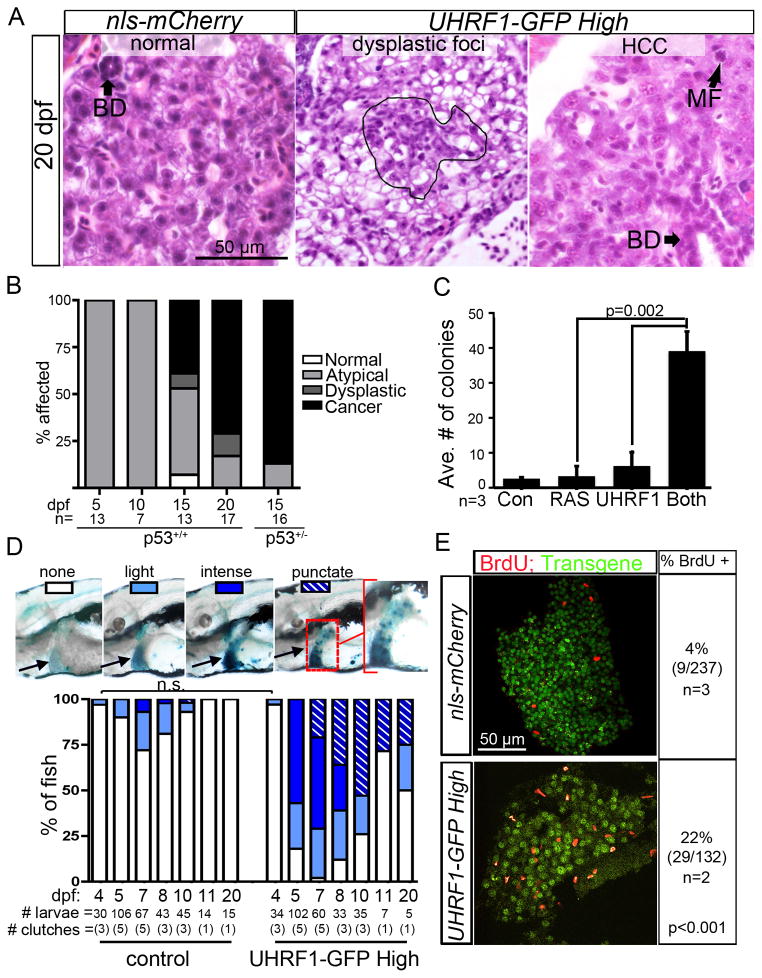
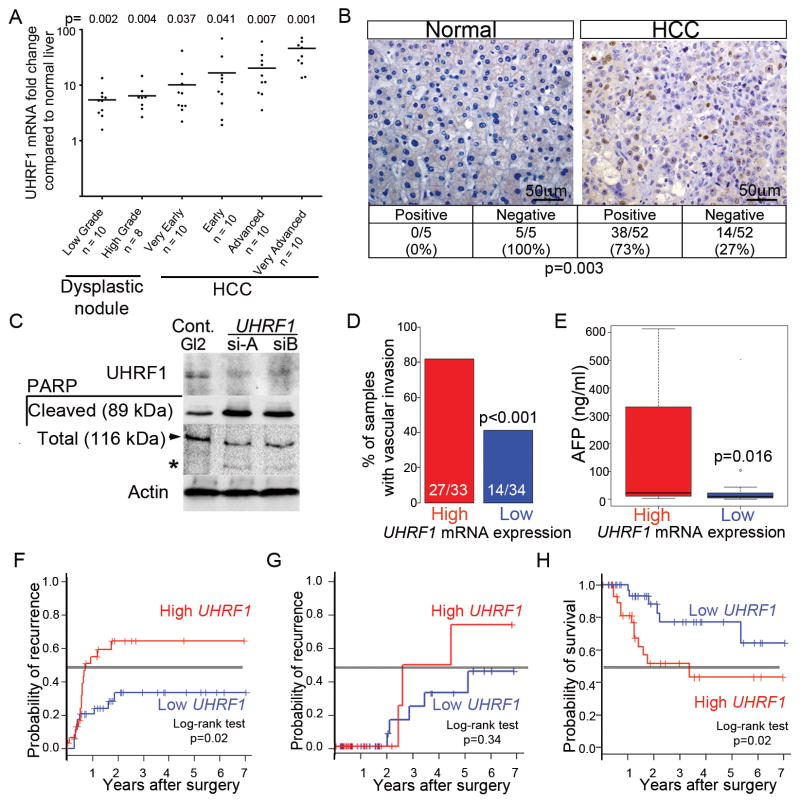
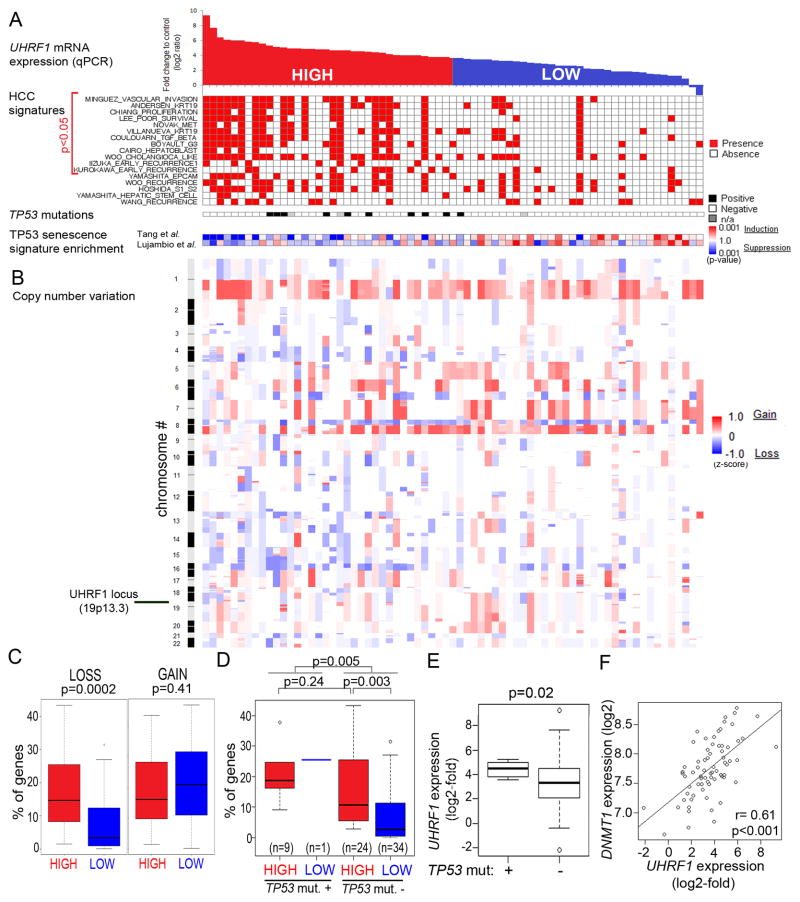
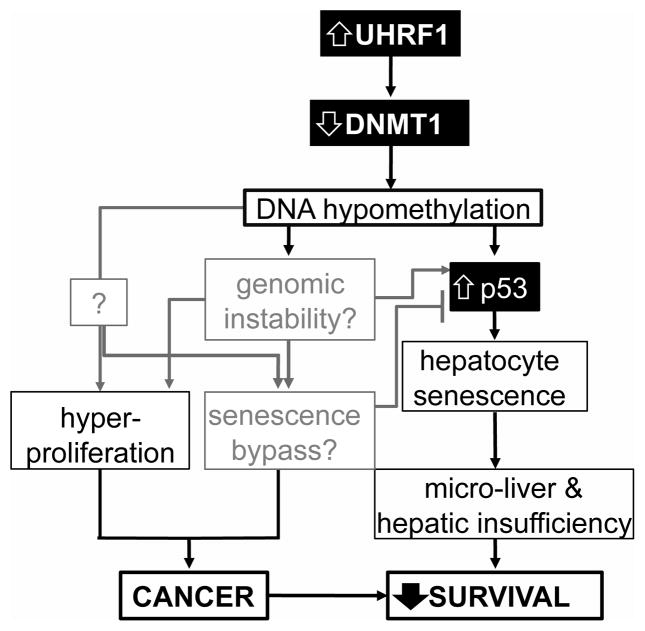
Ubiquitin-like with PHD and RING finger domains 1 (UHRF1) is an essential regulator of DNA methylation that is highly expressed in many cancers. Here, we use transgenic zebrafish, cultured cells, and human tumors to demonstrate that UHRF1 is an oncogene. UHRF1 overexpression in zebrafish hepatocytes destabilizes and delocalizes Dnmt1 and causes DNA hypomethylation and Tp53-mediated senescence. Hepatocellular carcinoma (HCC) emerges when senescence is bypassed. tp53 mutation both alleviates senescence and accelerates tumor onset. Human HCCs recapitulate this paradigm, as UHRF1 overexpression defines a subclass of aggressive HCCs characterized by genomic instability, TP53 mutation, and abrogation of the TP53-mediated senescence program. We propose that UHRF1 overexpression is a mechanism underlying DNA hypomethylation in cancer cells and that senescence is a primary means of restricting tumorigenesis due to epigenetic disruption.


Figures

Figure 1
Figure 1. High UHRF1 expression causes global DNA hypomethylation
(A) 5MeC levels and total DNA stained with methylene blue were measured in 5 dpf control and UHRF1-GFP High livers (n=4) and liver-less carcasses (n=3). The ratio of 5MeC to total DNA was averaged and normalized to controls. Student’s T-test was used to determine p values. (B) Confocal stacks of livers (top) and fins (bottom) from 5 dpf nls-mCherry and UHRF1-GFP High larvae stained with anti-5MeC. Since a hepatocyte specific promoter was used for transgenesis, there was no transgene expression in the fin. (C) Dnmt1 is uniform in the hepatocyte nucleus of 4 dpf nls-mCherry larvae but is found in GFP-containing punctae in UHRF1-GFP High hepatocytes. Arrows point to cells that do not express GFP and have Dnmt1 distribution pattern similar to controls. (D) Tg(hsp70I:UHRF1-EGFP) and non-transgenic controls were heat shocked at 37° C for 1 hour at 24 and 27 hpf, treated with 10 μM MG132 or DMSO at 28 hpf and collected at 34 hpf for immunoblotting. (E) Dnmt1 levels normalized to tubulin were averaged from 6 experiments. Student’s T-test was used to determine p values; n.s.: not significant; error bars represent SD. See also Figure S1.
Figure 2
Figure 2. UHRF1-induced hypomethylation reduces liver size
(A) Individual larvae were imaged daily from 3–10 dpf. (B) 5 dpf UHRF1-GFP High larvae display a range of liver sizes scored as “normal” or “small”‘ (C) 3 clutches were scored according to criteria in B; n= number of larvae. Fisher’s exact test was used to determine p value. (D) The area of the left liver lobe was measured in 5 dpf fish from 2 clutches. Boxes represent 75th and 25th percentile, horizontal line is the median and whiskers mark lowest and highest values. Student’s T-test was used to determine p value. (E) UHRF1-GFP High larvae were sorted by liver size on 5 dpf and tracked daily for survival to 20 dpf. Data are pooled from three clutches. (F) UHRF1-GFP High and control larvae were treated with 50 μM 5-Aza from 2.5–5 dpf and scored for liver size in 6 clutches. Fisher’s exact test was used to determine p values. (G) UHRF1-GFP High embryos were injected with mRNA encoding dnmt1 or Mpi before 1 hpf. The percent of fish with a normal liver size was scored at 5 dpf in 6 clutches. See also Figure S2.
Figure 3
Figure 3. UHRF1 overexpression in hepatocytes induces Tp53-mediated senescence
(A) Intense senescence associated β-galactosidase (SA-β-gal) staining was detected in the liver (outlined) of 5 dpf UHRF1-GFP High larvae compared to light or no staining in controls. (B) 5 dpf fish from 5 clutches were scored for hepatic SA-β-gal staining. *** indicates p<0.0001 by Fisher’s exact test. (C) Nuclear size was measured in hepatocytes of a single control or UHRF1-GFP High 5 dpf liver and cells were stratified according to GFP expression. Inset shows confocal stack of the DNA organized into foci. ** and *** indicates p<0.001 or 0.0001, respectively compared to nuclear size in nls-mCherry larvae. (D) BrdU positive cells and the total number of transgene-expressing hepatocytes in nls-mCherry and UHRF1-GFP High larvae (Bottom) 5 dpf larvae. A Fisher’s exact test was used to calculate p value. In nls-mCherry larvae, most BrdU positive cells also express the transgene whereas the BrdU positive cells in UHRF1-GFP High livers did not express GFP (white arrows in magnified regions which are marked by the white box). (E) Heatmap of log2 values from RNAseq shows cell cycle regulators are down and Tp53 target genes (marked by *) are up in UHRF1-GFP High 5 dpf livers. (F) tp53 and cdkn1a mRNA expression were induced on 5 dpf and down regulated on 20 dpf in UHRF1-GFP High livers. * indicates p=0.05; *** indicates p=0.001 calculated by 1 sample Student’s T-test. Error bars represent SD. (G) 5-Aza induces Tp53 expression in primary mouse hepatocytes. Student’s T-test was used to determine p value with SD indicated by the error bars across 3 replicates. tp53+/− in UHRF1-GFP High larvae significantly reduced SA-β-gal staining in the liver (2 clutches) (H), and increased the percent of larvae with normal liver size (I), the area of the left liver lobe (J), and survival at 5 dpf (K). p values were calculated with a Fisher’s test with Freeman-Halton extension (H), Fisher’s exact test (I), and Student’s T-test. Boxes represent 75th and 25th percentile, horizontal line is the median and whiskers mark lowest and highest values. (J). See also Figure S3.
Figure 4
Figure 4. UHRF1 is an oncogene
(A) Atypical cells, dysplastic foci (outlined) and HCC are apparent in H&E stained UHRF1-GFP High livers. BD: bile duct, MF: mitotic figure. (B) Incidence of normal and atypical hepatocytes, dysplastic foci and cancer in the liver of UHRF1-GFP High fish on WT or tp53+/− background. (C) NIH-3T3 cell growth in soft agar is enhanced when UHRF1 overexpression is combined with RAS (n=3). p value was calculated by Student’s T-test and error bars represent the SD. (D) Hepatic SA-β-gal staining patterns in UHRF1-GFP High larvae changes as fish age. Images of 8 dpf larvae illustrate the SA-β-gal staining patterns that were scored in the time course shown in the graph. A significant increase in the number of UHRF1-GFP High fish with intense or punctate SA-β-gal compared to controls at all time points (p<0.01 by Fisher’s exact test) except at 4 dpf; not significant=n.s. (E) BrdU incorporation in the liver on 11 dpf is 5 times higher in UHRF1-GFP High fish than in controls. Total # of cells counted is indicated with n= # of clutches assessed. Fisher’s exact test was used to calculate p value. See also Figure S4.
Figure 5
Figure 5. UHRF1 mRNA and protein are overexpressed in HCC
(A) UHRF1 detected by qRT-PCR in 18 pre-neoplastic lesions and 40 HCCs from HCV infected patients compared to expression in 9 normal livers. Horizontal line indicates median. (B) Immunohistochemistry for UHRF1 protein (brown) was evaluated in 52 of the same HCCs examined in A plus 5 normal liver samples. Fisher’s exact test was used to calculate p value. 71 of the HCV-associated HCCs analyzed by qPCR were grouped into high (n=35) and low (n=36) UHRF1 expressing tumors based on the median log2-fold change of 3.64. (C) HepG2 cells transfected with control siRNA (GL2) or two different siRNAs targeting UHRF1 described in (Tien et al., 2011) were blotted for UHRF1, cleaved and total PARP (arrow indicates full length, * indicates cleaved protein). (D) Vascular invasion (33 high and 34 low tumors, 4 missing values), (E) serum AFP (29 UHRF1-high and 29 low tumors, 13 missing values), (F) early (<2 years) and (G) late (>2 years; 32 UHRF1-high and 35 low tumors, 4 missing values) tumor recurrence and (H) overall survival after surgery (32 high and 35 low tumors, 4 missing values) were stratified according to UHRF1-expression. Continuous and categorical variables were assessed by Wilcoxon rank-sum test and Fisher’s exact test, respectively. Clinical outcome difference was evaluated by log-rank test. In box and whisker plots, boxes represent the 75th and 25th percentiles, the whiskers represent the most extreme data points within interquartile range x 1.5, and the horizontal bar represents the median. See also Figure S5.
Figure 6
Figure 6. High UHRF1 expression defines a subclass of tumors with inactivated tp53, repression of senescence and chromosomal instability
(A) The 71 human HCC tumors analyzed in Figure 5C–G were rank-ordered according to UHRF1 expression by qPCR and classified as high (<median, red; n=35) or low (≥median, blue; n=36). The presences of aggressive human HCC gene signatures from published studies and of TP53 inactivating mutations are indicated by red and black boxes, respectively. TP53-mediated senescence gene signatures (Lujambio et al., 2013; Tang et al., 2007) are displayed as a range from repressed (blue) to activated (red). (B) Genome-wide profile of DNA copy number variation was obtained from GEO geneset GSE9829. (C) Proportion of genes with DNA copy number loss and gain in tumors according to UHRF1 expression. (D) Proportion of genes with DNA copy number loss according to UHRF1 expression and TP53 mutation status. (E) UHRF1 expression is significantly higher in tumors with TP53 mutations. (F) DNMT1 expression by microarray analysis is significantly correlated with UHRF1 expression assessed by qPCR in HCCs. In box and whisker plots, boxes represent the 75th and 25th percentiles, the whiskers represent the most extreme data points within interquartile range x 1.5, and the horizontal bar represents the median. See also Figure S6 and Tables S1-S6.
Figure 7
Figure 7. Model of the relationship between UHRF1 overexpression, DNA hypomethylation, Tp53 mediated senescence, cancer and survival
Factors investigated in this study are in solid black boxes with black lines indicating the correlations demonstrated in this work and gray lines indicating relationships that are speculative. Senescence reduces liver size and function and reduces larval survival while cancer occurs when senescence is bypassed and also reduces survival.

Similar articles

Cited by

References

    1. Anderson RM, Bosch JA, Goll MG, Hesselson D, Dong PD, Shin D, Chi NC, Shin CH, Schlegel A, Halpern M, Stainier DY. Loss of Dnmt1 catalytic activity reveals multiple roles for DNA methylation during pancreas development and regeneration. Dev Biol 2009 - PMC - PubMed
    1. Arita K, Ariyoshi M, Tochio H, Nakamura Y, Shirakawa M. Recognition of hemi-methylated DNA by the SRA protein UHRF1 by a base-flipping mechanism. Nature. 2008;455:818–821. - PubMed
    1. Avvakumov GV, Walker JR, Xue S, Li Y, Duan S, Bronner C, Arrowsmith CH, Dhe-Paganon S. Structural basis for recognition of hemi-methylated DNA by the SRA domain of human UHRF1. Nature. 2008;455:822–825. - PubMed
    1. Babbio F, Pistore C, Curti L, Castiglioni I, Kunderfranco P, Brino L, Oudet P, Seiler R, Thalman GN, Roggero E, et al. The SRA protein UHRF1 promotes epigenetic crosstalks and is involved in prostate cancer progression. Oncogene 2012 - PubMed
    1. Berdasco M, Esteller M. Aberrant epigenetic landscape in cancer: how cellular identity goes awry. Dev Cell. 2010;19:698–711. - PubMed

Publication types

MeSH terms

Substances

Associated data