. 2014 Mar 15;88(2):178-88.
doi: 10.1016/j.bcp.2014.01.027. Epub 2014 Jan 31.

Role of Bcl-xL/Beclin-1 in interplay between apoptosis and autophagy in oxaliplatin and bortezomib-induced cell death

Affiliations

Role of Bcl-xL/Beclin-1 in interplay between apoptosis and autophagy in oxaliplatin and bortezomib-induced cell death

Seog-Young Kim et al. Biochem Pharmacol. .

Abstract

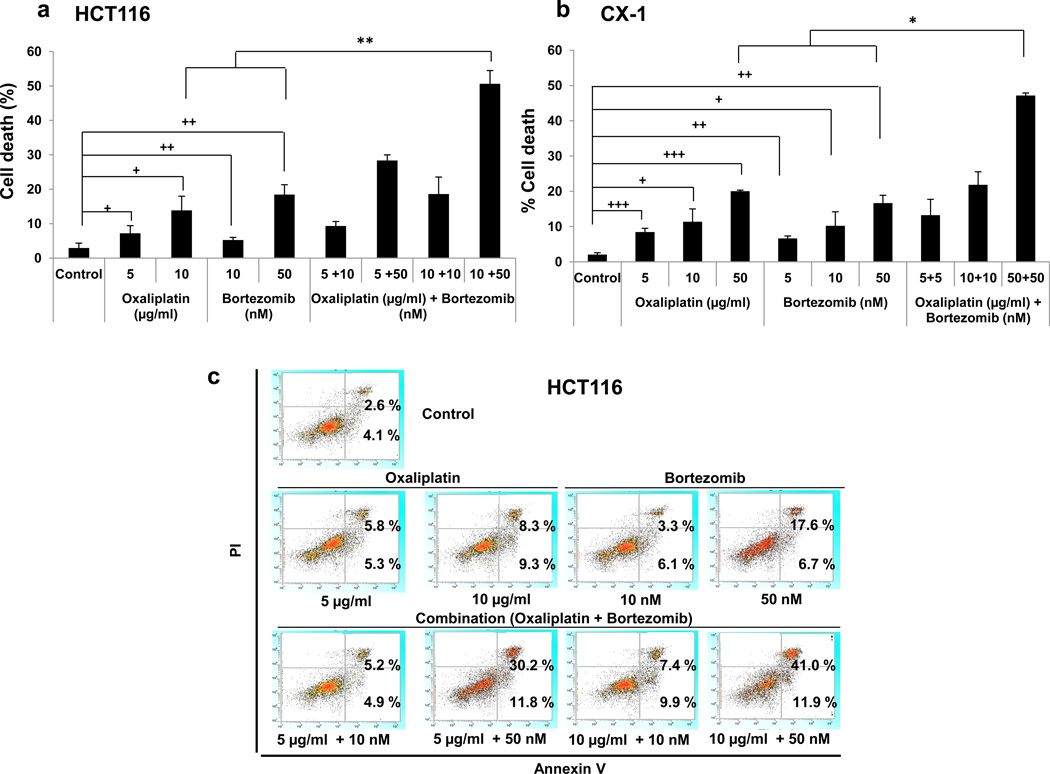
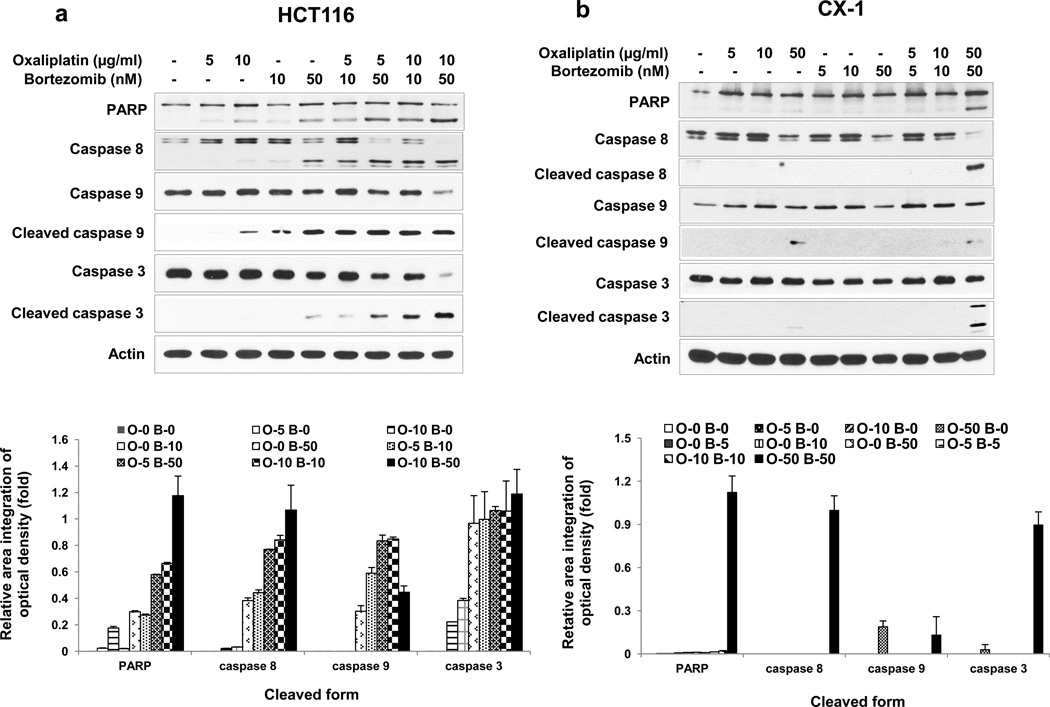
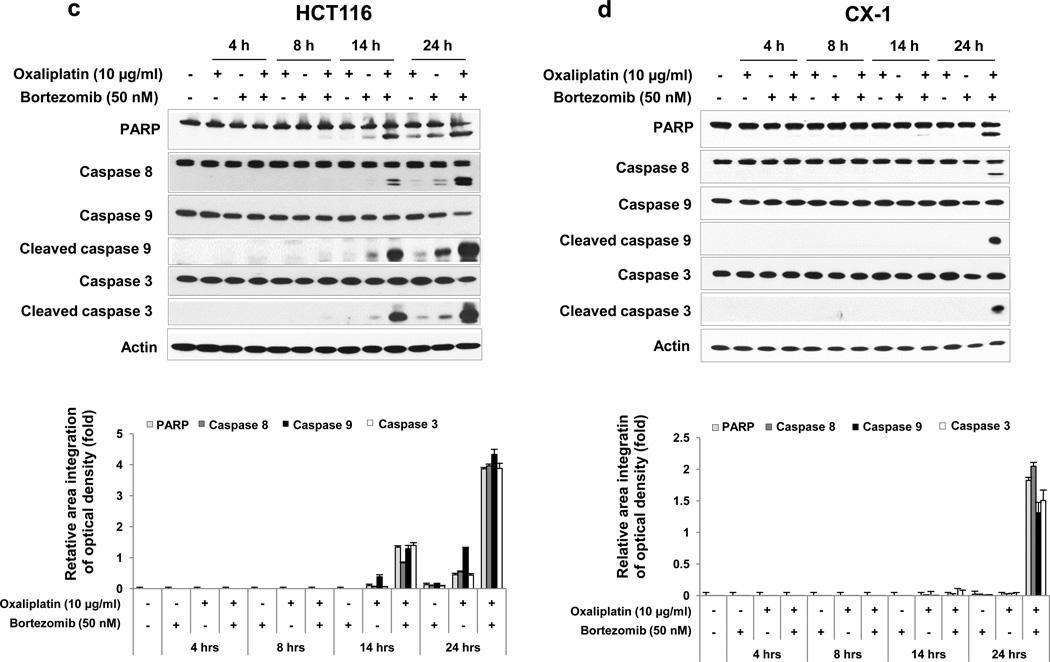
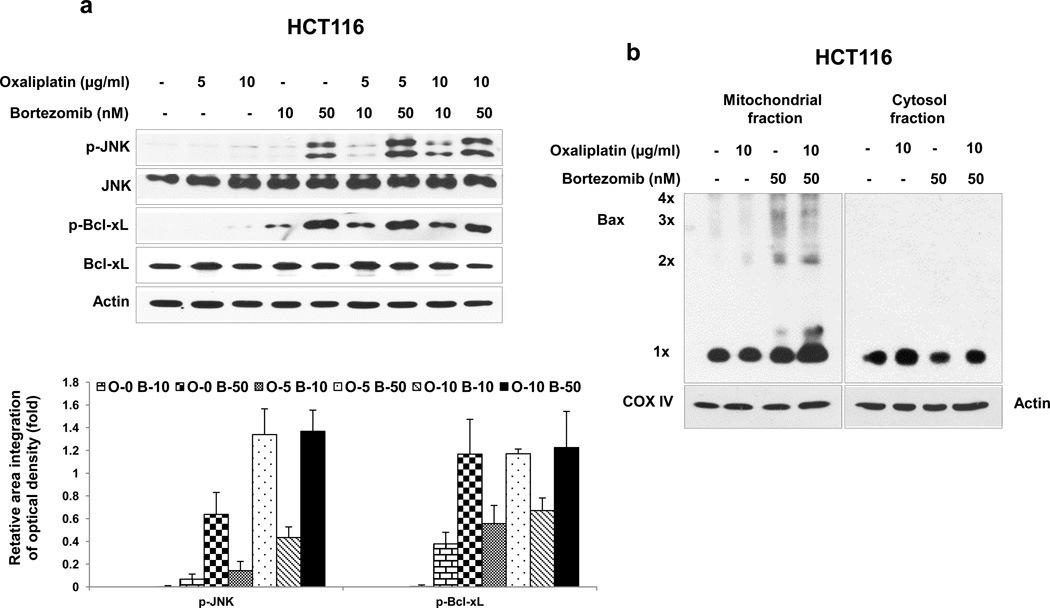
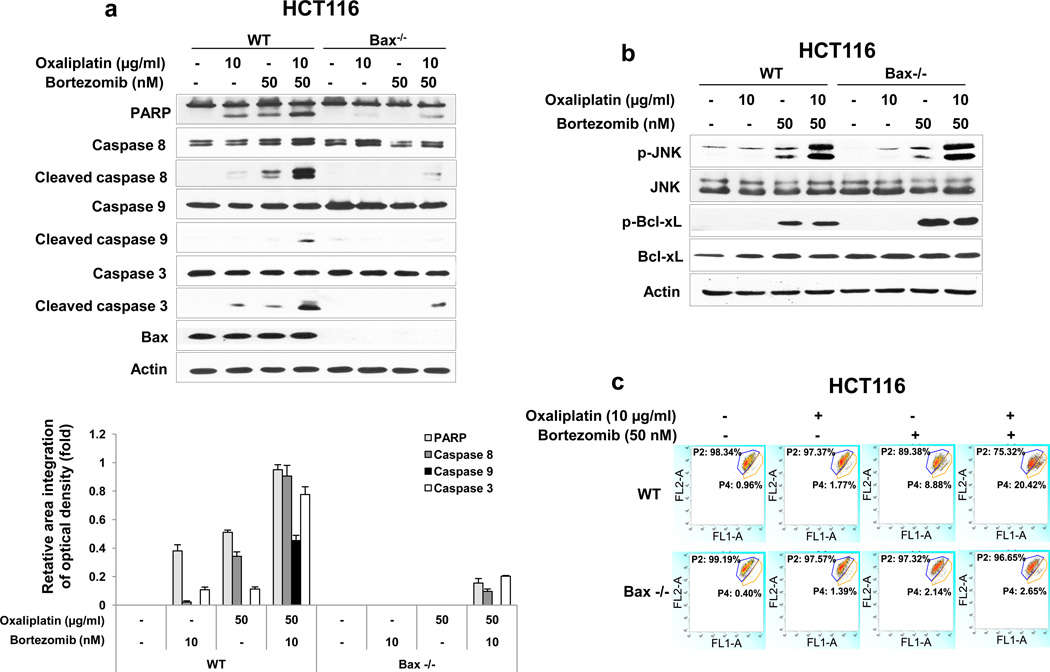
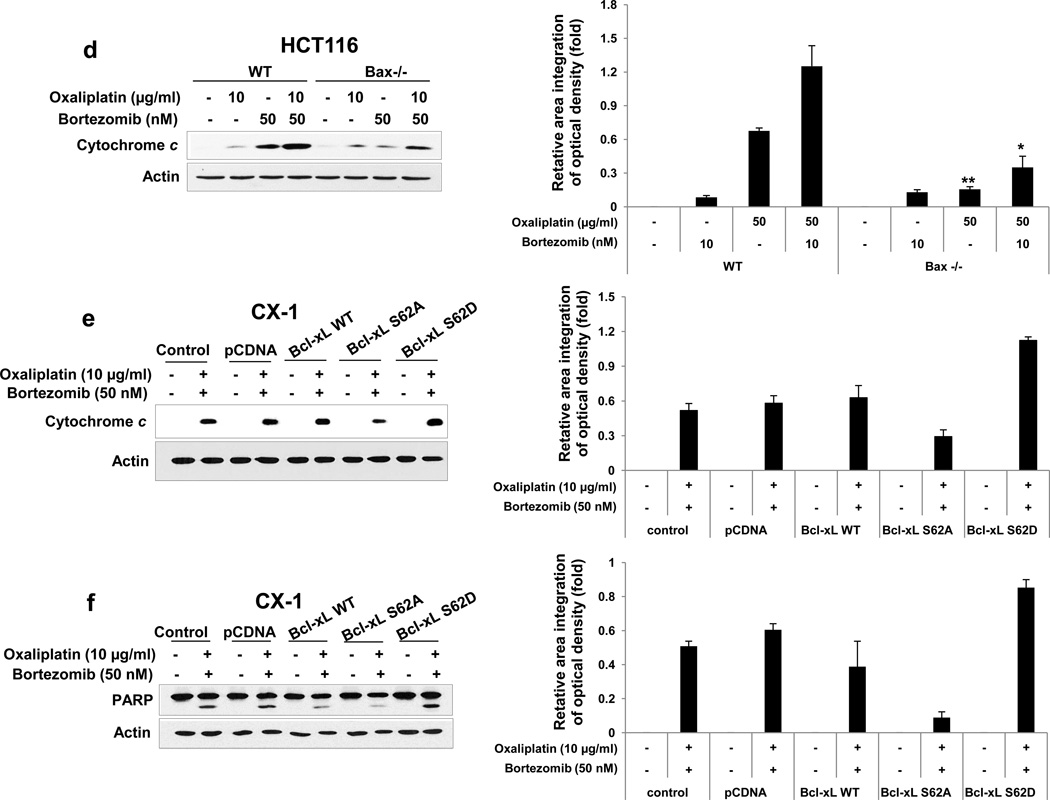
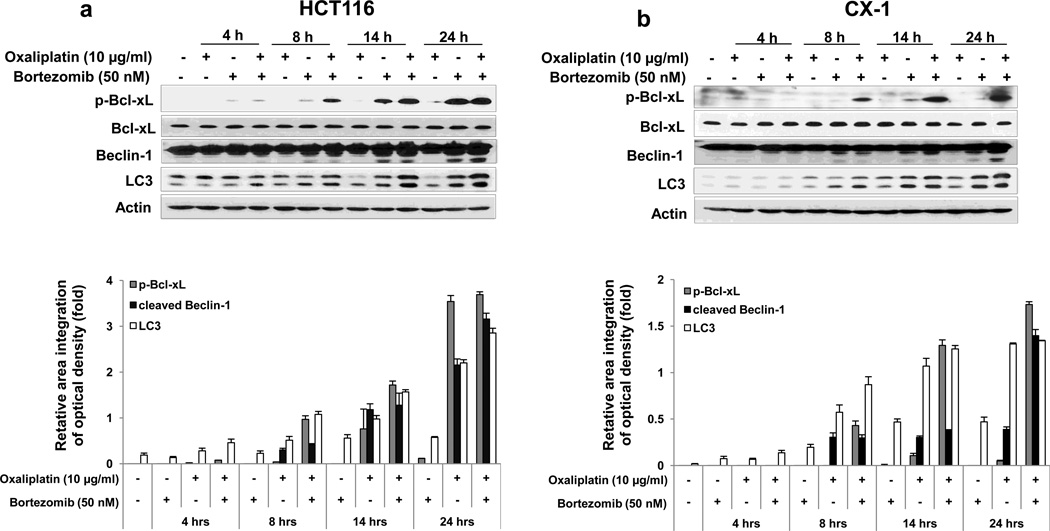
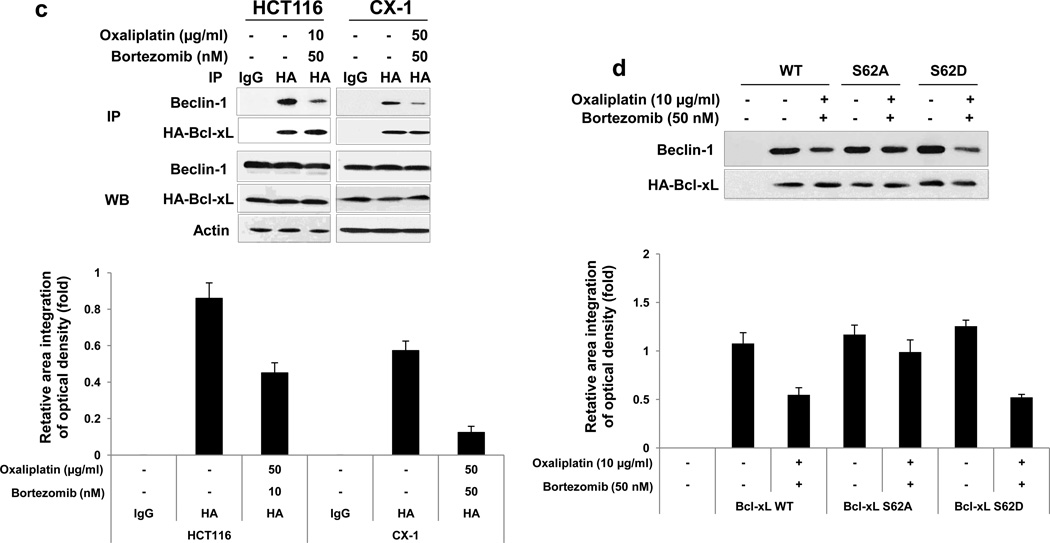
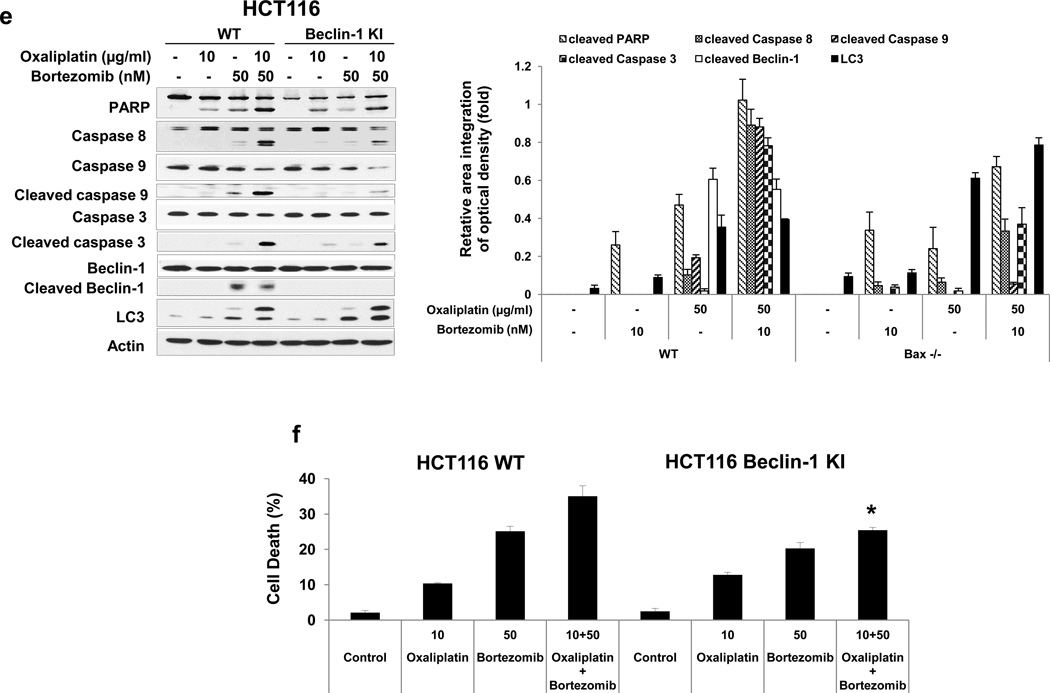
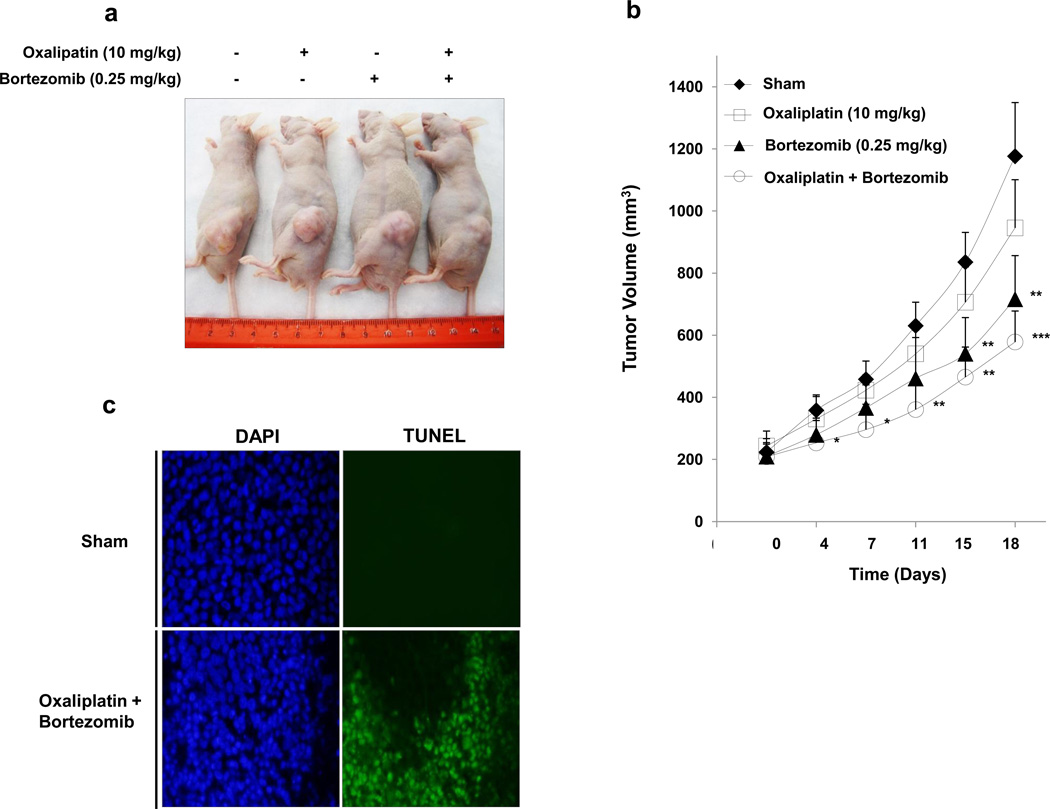
Recent studies indicate that a complex relationship exists between autophagy and apoptosis. In this study we investigated a regulatory relationship between autophagy and apoptosis in colorectal cancer cells utilizing molecular and biochemical approaches. For this study, human colorectal carcinoma HCT116 and CX-1 cells were treated with two chemotherapeutic agents-oxaliplatin, which induces apoptosis, and bortezomib, which triggers both apoptosis and autophagy. A combinatorial treatment of oxaliplatin and bortezomib caused a synergistic induction of apoptosis which was mediated through an increase in caspase activation. The combinational treatment of oxaliplatin and bortezomib promoted the JNK-Bcl-xL-Bax pathway which modulated the synergistic effect through the mitochondria-dependent apoptotic pathway. JNK signaling led to Bcl-xL phosphorylation at serine 62, oligomerization of Bax, alteration of mitochondrial membrane potential, and subsequent cytochrome c release. Overexpression of dominant-negative mutant of Bcl-xL (S62A), but not dominant-positive mutant of Bcl-xL (S62D), suppressed cytochrome c release and synergistic death effect. Interestingly, Bcl-xL also affected autophagy through alteration of interaction with Beclin-1. Beclin-1 was dissociated from Bcl-xL and initiated autophagy during treatment with oxaliplatin and bortezomib. However, activated caspase 8 cleaved Beclin-1 and suppressed Beclin-1-associated autophagy and enhanced apoptosis. A combinatorial treatment of oxaliplatin and bortezomib-induced Beclin-1 cleavage was abolished in Beclin-1 double mutant (D133AA/D149A) knock-in HCT116 cells, restoring the autophagy-promoting function of Beclin-1 and suppressing the apoptosis induced by the combination therapy. In addition, the combinatorial treatment significantly inhibited colorectal cancer xenografts' tumor growth. An understanding of the molecular mechanisms of crosstalk between apoptosis and autophagy will support the application of combinatorial treatment to colorectal cancer.

Keywords: Bcl-xL; Beclin-1; Bortezomib; Mitochondria-dependent pathway; Oxaliplatin.


Figures

Figure 1
Figure 1. Oxaliplatin/bortezomib-induced cytotoxicity in colon cancer cells
HCT116 (a, c) and CX-1 (b) cells were treated with various concentrations of oxaliplatin/bortezomib for 24 hours. (a) and (b) Cell death was analyzed by the trypan blue dye exclusion assay. Error bars represent SD from triplicate experiments. Cross †, ††, or ††† represents a statistically significant difference at P <0.05, P <0.01, or <0.001, respectively. Asterisk * or ** represents a statistically significant difference at P <0.05 or P <0.01, respectively. (c) After drug treatment, cells were stained with fluorescence isothiocyanate (FITC)-Annexin V and PI. Apoptosis was detected by the flow-cytometric assay.
Figure 2
Figure 2. Oxaliplatin/bortezomib-induced apoptotic death in colon cancer cells
a and b, HCT116 (a) and CX-1 (b) cells were treated with various concentrations of oxaliplatin/bortezomib for 24 hours. After drug treatment, the cleavage of caspase 8, 9, 3 or PARP was detected by immunoblotting (upper panels). Actin was used to confirm the equal amount of proteins loaded in each lane. Densitometry analysis of the bands from the cleaved forms of caspase 8, 9, 3 or PARP was performed (lower panels). Error bars represent SD from triplicate experiments. (c) and (d) Kinetics of oxaliplatin/bortezomib-induced apoptosis in HCT116 cells (c) or CX-1 cells (d) were examined by treatment with 10 μg/ml oxaliplatin or/and 50 nM bortezomib for various times. After treatment, the cleavage of caspase 8, 9, 3 or PARP was detected by immunoblotting (upper panels). Actin was shown as an internal standard. Densitometry analysis of the bands from the cleaved forms of caspase 8, 9, 3 or PARP was performed (lower panels). Error bars represent SD from triplicate experiments.
Figure 3
Figure 3. Role of the JNK-Bcl-xL pathway in Bax oligomerization
(a) and (b) HCT116 cells were treated with oxaliplatin/bortezomib for 24 hours. (a) Cell lysates containing equal amounts of protein were separated by SDS-PAGE and immunoblotted with anti-phospho-JNK (p-JNK), anti-JNK, antiphospho-Bcl-xL (p-Bcl-xL), or anti- Bcl-xL antibody (upper panel). Actin was shown as an internal standard. Densitometry analysis of the bands from the phosphorylated forms of JNK or Bcl-xL was performed (lower panel). Error bars represent SD from triplicate experiments. (b) After the drug treatment, mitochondrial and cytosolic fractions from HCT116 cells were isolated and proteins were cross-linked with 1 mM dithiobis (succinimidyl propionate) and then subjected to immunoblotting with anti-Bax antibody. Bax monomer (1×) and multimers (2×, 3×, and 4×) are indicated. Actin was used as a cytosolic marker and COX IV as a mitochondrial marker.
Figure 4
Figure 4. Role of Bax and subsequent cytochrome c release during treatment with oxaliplain/bortezomib
(a) and (b) HCT116 wild-type (WT) and HCT116 Bax−/− cells were treated with oxaliplatin/ bortezomib for 24 hours. (a) Lysates containing equal amounts of protein were separated by SDS-PAGE and immunoblotted with anti-PARP, anti-caspase 8/9/3, or anti-Bax antibody (upper panel). Densitometry analysis of the bands from the cleaved forms of caspase 8, 9, 3 or PARP was performed (lower panel). Error bars represent SD from triplicate experiments. (b) Also cell lysates were immunoblotted with anti-phospho-JNK (p-JNK), anti-JNK, anti-phospho-Bcl-xL (p-Bcl-xL), or anti-Bcl-xL antibody. Actin was shown as an internal standard. (c) HCT116 WT and HCT116 Bax−/− cells were treated with oxaliplatin/bortezomib and stained with JC-1 and then analyzed by flow cytometry to examine alterations of mitochondrial potential. (d) In the same experimental set, cytochrome c release into cytosol was determined by immunoblotting for cytochrome c in the cytosolic fraction (left panel). Actin was used to confirm the equal amount of proteins loaded. Densitometry analysis of the bands from released cytochrome c was performed (right panel). Error bars represent SD from triplicate experiments. Asterisk * or ** represents a statistically significant difference at P <0.05 or P <0.01, respectively. (e) and (f) CX-1 cells were stably transfected with control plasmid, HA-Bcl-xL WT, HA-Bcl-xL S62A, or HA-Bcl-xL S62D plasmid and then treated with oxaliplatin and bortezomib for 24 hours. After treatment, cytosolic fractions were isolated and cytochrome c release into cytosol (e) or lysates containing equal amounts of protein were separated by SDS-PAGE and PARP cleavage (f) was determined by immunoblotting (left panels). Actin was used to confirm the equal amount of proteins loaded. Densitometry analysis of the bands from released cytochrome c (e) or cleaved form of PARP (f) was performed (right panels). Error bars represent SD from triplicate experiments.
Figure 5
Figure 5. Role of Beclin-1 in oxaliplatin/bortezomib-induced cell death
Kinetics of oxaliplatin/bortezomib-induced Bcl-xL phosphorylation and Beclin-1 in HCT116 cells (a) or CX-1 cells (b) were examined by treatment with 10 μg/ml oxaliplatin or/and 50 nM bortezomib for various times. After treatment, anti-phospho-Bcl-xL (p-Bcl-xL), anti-Bcl-xL, anti-Beclin-1 or anti-LC3 antibody was detected by immunoblotting (upper panels). Actin was shown as an internal standard. Densitometry analysis of the bands from the phosphorylated forms of Bcl-xL, cleaved forms of Beclin-1, or LC3-II was performed (lower panel). Error bars represent SD from triplicate experiments. (c) HCT116 or CX-1 cells were stably transfected with HA-tagged Bcl-xL plasmid. Cells were treated with oxaliplatin/bortezomib for 24 hours. Cell lysates were immunoprecipitated with anti-HA antibody or mock antibody (IgG) and immunoblotted with anti-Beclin-1 or anti-HA antibody (top of upper panel). The presence of HA-Bcl-xL and Beclin-1 in the lysates was verified by immunoblotting (bottom of upper panel). Actin was shown as an internal standard. Densitometry analysis of the bands from the immunoprecipitated Beclion-1 was performed (lower panel). Error bars represent SD from triplicate experiments. (d) CX-1 cells were stably transfected with HA-Bcl-xL WT, HA-Bcl-xL S62A, or HABcl-xL S62D plasmid and then treated with oxaliplatin and bortezomib for 24 hours. Cell lysates were immunoprecipitated with anti-HA antibody or mock antibody (IgG) and immunoblotted with anti-Beclin-1 or anti-HA antibody. Densitometry analysis of the bands from the immunoprecipitated Beclion-1 was performed (lower panel). Error bars represent SD from triplicate experiments. (e) and (f), HCT116 cells and HCT116 Beclin-1 knock-in cells were treated with oxaliplatin/bortezomib for 24 hours. (e) Cell lysates were immunoblotted with anti-PARP, anti-caspase 8/9/3, anti-Beclin-1, or anti-LC3 antibody (left panel). Actin was shown as an internal standard. Densitometry analysis of the bands from the cleaved forms of capase 8, 9, 3, PARP, Beclin-1, or LC3-II was performed (lower panel). Error bars represent SD from triplicate experiments. (f) In the same experimental set, cell death was analyzed by the trypan blue dye exclusion assay. Error bars represent SD from triplicate experiments. Asterisk * represents a statistically significant difference at P <0.05.
Figure 6
Figure 6. Effect of oxaliplatin/bortezomib on the growth of HCT116 xenograft
NU/NU mice were inoculated subcutaneously with 1 × 10⁶ tumor cells per mouse, and the tumors were allowed to grow to 200 mm3. A total of 10 mg/kg oxaliplatin and/or 0.25 mg/kg bortezomib was administered by intraperitoneal injection, respectively. (a) Photograph of representative tumor bearing mouse from each group 18 days after drug administration. (b) Tumor growth curve. Error bars represent SD from 5 mice. *, **, or ***, statistically significant difference compared with the control group at P < 0.05, P < 0.01, or P < 0.001 respectively. (c) Tumor tissues were harvested at day 18 after drug administration and subjected to TUNEL assay to detect apoptosis. Cell nuclei were stained with 4’, 6-diamidino-2-phenylindole (DAPI). Representative images are shown.

Similar articles

Cited by

References

    1. Cancer Facts & Figures. American Cancer Society; 2013.
    1. Macdonald JS, Smalley SR, Benedetti J, Hundahl SA, Estes NC, Stemmermann GN, Haller DG, Ajani JA, Gunderson LL, Jessup JM, Martenson JA. Chemoradiotherapy after surgery compared with surgery alone for adenocarcinoma of the stomach or gastroesophageal junction. N Engl J Med. 2001;345:725–730. - PubMed
    1. Rothenberg ML, Meropol NJ, Poplin EA, Van Cutsem E, Wadler S. Mortality associated with irinotecan plus bolus fluorouracil/leucovorin: summary findings of an independent panel. J Clin Oncol. 2001;18:3801–3807. - PubMed
    1. Amaravadi RK, Lippincott-Schwartz J, Yin XM, Weiss WA, Takebe N, Timmer W, DiPaola RS, Lotze MT, White E. Principles and current strategies for targeting autophagy for cancer treatment. Clin Cancer Res. 2011;17:654–666. - PMC - PubMed
    1. Chen N, Karantza V. Autophagy as a therapeutic target in cancer. Cancer Biol Ther. 2011;11:157–168. - PMC - PubMed

Publication types

MeSH terms