. 2014 Mar;46(3):310-5.
doi: 10.1038/ng.2892. Epub 2014 Feb 2.

A general framework for estimating the relative pathogenicity of human genetic variants

Affiliations

A general framework for estimating the relative pathogenicity of human genetic variants

Martin Kircher et al. Nat Genet. 2014 Mar.

Abstract

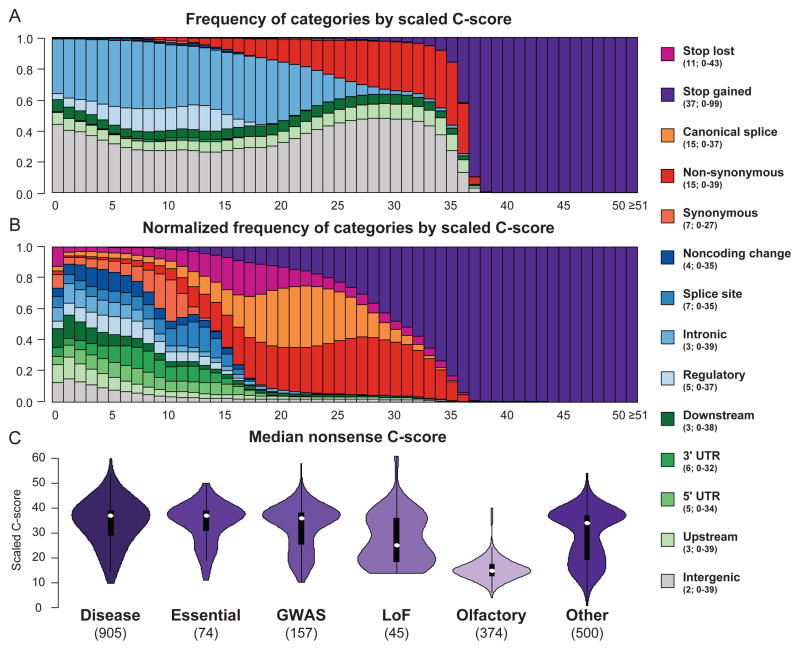
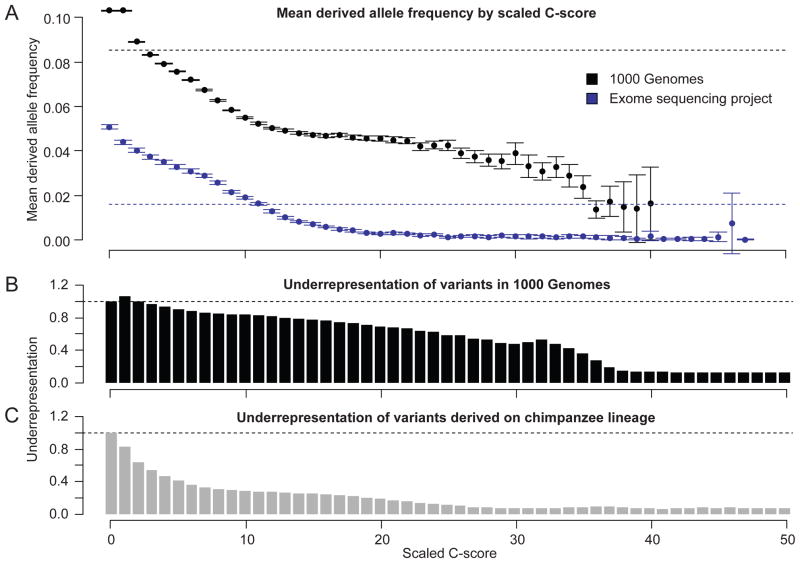
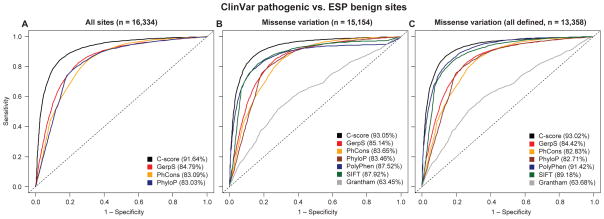
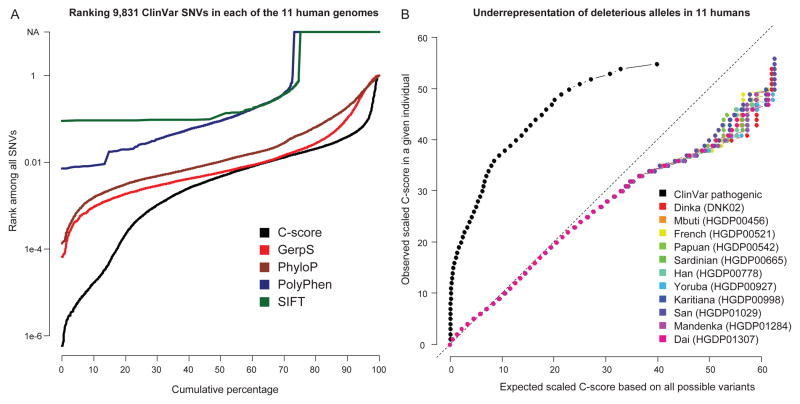
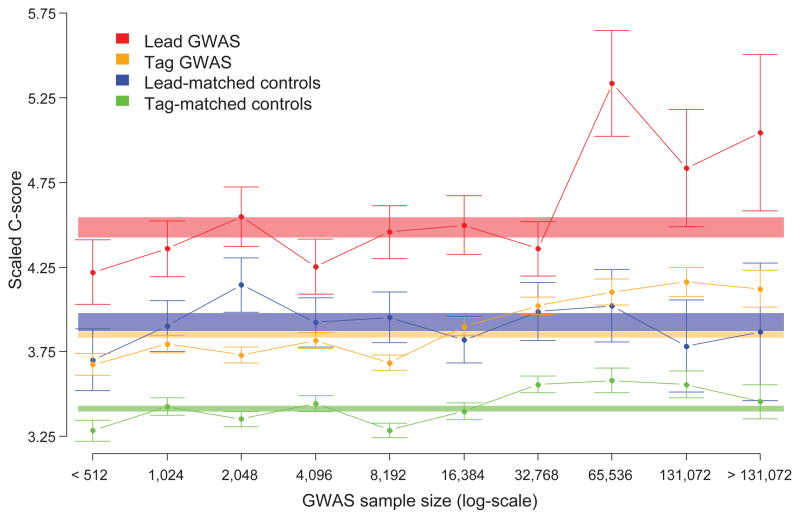
Current methods for annotating and interpreting human genetic variation tend to exploit a single information type (for example, conservation) and/or are restricted in scope (for example, to missense changes). Here we describe Combined Annotation-Dependent Depletion (CADD), a method for objectively integrating many diverse annotations into a single measure (C score) for each variant. We implement CADD as a support vector machine trained to differentiate 14.7 million high-frequency human-derived alleles from 14.7 million simulated variants. We precompute C scores for all 8.6 billion possible human single-nucleotide variants and enable scoring of short insertions-deletions. C scores correlate with allelic diversity, annotations of functionality, pathogenicity, disease severity, experimentally measured regulatory effects and complex trait associations, and they highly rank known pathogenic variants within individual genomes. The ability of CADD to prioritize functional, deleterious and pathogenic variants across many functional categories, effect sizes and genetic architectures is unmatched by any current single-annotation method.


Figures

Figure 1
Figure 1
Relationship of scaled C-scores and categorical variant consequences. The upper plot shows the proportion of substitutions with a specific consequence for each scaled C-score bin, while the middle panel shows the proportion of substitutions with a specific consequence after first normalizing by the total number of variants observed in that category. The legend indicates the median and range of scaled C-score values for each category. Consequences are obtained from the Ensembl Variant Effect Predictor (Supplementary Note), e.g. “noncoding change” refers to changes in annotated non-coding transcripts. Detailed counts of functional assignments in each C-score bin are in Supplementary Table 8. The lower panel shows violin plots of the median C-scores of potential nonsense (stop-gained) variants for genes that: harbor at least 5 known pathogenic mutations (“disease”); are predicted to be “essential”; harbor variants associated with complex traits (“GWAS”); harbor at least 2 loss-of-function mutations in 1000 Genomes (“LoF”); encode olfactory receptor proteins; or are in a random selection of 500 genes (“Other”; see Supplementary Note).
Figure 2
Figure 2
Relationship between scaled C-scores and: the average derived allele frequency (DAF) of variants identified in the 1000 Genomes Project or ESP (upper panel); the under-representation of polymorphic sites in 1000 Genomes (middle panel); and chimpanzee lineage derived variants (lower panel). The dashed lines in the upper plot indicate the mean DAF and confidence intervals indicate 1.96x standard errors of the mean (SEM) DAF in each bin. Under-representation is defined as the proportion of 1000 Genomes (middle panel) or chimpanzee-derived (lower panel) variants in a specific scaled C-score bin divided by the frequency with which that scaled C-score is observed for all possible mutations of the human reference assembly (10C-score/−10). The stronger under-representation of chimpanzee-derived variants relative to 1000 Genomes variants is expected given that the former are mostly fixed or high-frequency variants (and have survived many generations of purifying selection) while the latter are mostly low-frequency variants. Depletion values in both panels for C-score bins other than 0 are significantly different from expectation (binomial proportion test, all p-values <10−11).
Figure 3
Figure 3
Receiver operating characteristics (ROC) for discriminating curated, pathogenic mutations defined by the NIH ClinVar database matched to apparently benign ESP alleles (DAF ≥ 5%) with the same categorical consequence. The left panel shows genome-wide variants for which GerpS, PhCons, and PhyloP scores are defined (n=16,334), while the middle panel limits the analysis to missense changes (n=15,154), with missing values imputed to an upper value limit of each score, and right panel to missense changes for which PolyPhen, SIFT and Grantham scores are all defined (n=13,358). Versions of the right panel that exclude the overlap between PolyPhen training data and the ClinVar database or use a CADD model trained without PolyPhen as a feature are shown in Supplementary Fig. 12. Area under the curve (AUC) values are provided in the figure legend for each of the scores used.
Figure 4
Figure 4
Ranking of pathogenic ClinVar variants among the variants identified by whole genome sequencing of eleven human individuals from diverse populations. Left panel: Cumulative distributions of the ranks of 9,831 pathogenic ClinVar variants when “spiked in” to each of 11 personal genomes. For example, C-scores of ~30% of ClinVar variants rank in the top 0.1% of all variants within a personal genome, and most rank in the top 1%. About 25% of pathogenic ClinVar SNVs are not scored by PolyPhen/SIFT because of missing values or its restriction to missense variation; note also that ranks for PolyPhen/SIFT are computed among missense variants only and are therefore derived from far fewer total variants (see a plot restricted to missense variation in Supplementary Fig. 16). Right panel: A QQ-plot of the C-scores of the SNVs identified from the eleven individuals and pathogenic ClinVar SNVs. For a given scaled C-score observed in an individual, the fraction of that individual’s variants with a C-score at least that large was computed (y-axis). The C-score corresponding to this quantile of the distribution of all possible variants is displayed on the x-axis. High C-scores are underrepresented compared to the set of all possible variants. In contrast, known disease-causal variants from ClinVar have large C-scores relative to the set of all possible variants. This fact can be exploited to prioritize causal variants identified from whole genome sequencing of individual genomes (left panel and Supplementary Tables 10–11).
Figure 5
Figure 5
C-scores for GWAS SNPs are higher than nearby control SNPs and dependent on study sample size. The average scaled C-score (y-axis) is plotted for each category of SNP, as indicated by color, relative to the sample sizes of the association studies in which the SNPs were identified (x-axis). Sample size bins are log2-scaled and mutually exclusive; for example, the bin labeled “1024” represents all SNPs from studies with between 512 and 1024 samples. Error bars are ±1 standard errors of the mean (SEM). Shaded rectangles represent the overall, i.e. across all sample sizes, scaled C-score means ±1 SEM for each category as indicated by the color.

Comment in

References

    1. Cooper GM, et al. Single-nucleotide evolutionary constraint scores highlight disease-causing mutations. Nat Methods. 2010;7:250–1. - PMC - PubMed
    1. Cooper GM, Shendure J. Needles in stacks of needles: finding disease-causal variants in a wealth of genomic data. Nat Rev Genet. 2011;12:628–40. - PubMed
    1. Musunuru K, et al. From noncoding variant to phenotype via SORT1 at the 1p13 cholesterol locus. Nature. 2010;466:714–9. - PMC - PubMed
    1. Ward LD, Kellis M. Interpreting noncoding genetic variation in complex traits and human disease. Nat Biotechnol. 2012;30:1095–106. - PMC - PubMed
    1. Ng SB, et al. Targeted capture and massively parallel sequencing of 12 human exomes. Nature. 2009;461:272–6. - PMC - PubMed

Publication types