. 2014 Mar;7(3):373-85.
doi: 10.1242/dmm.012104. Epub 2014 Jan 30.

Synaptic abnormalities in a Drosophila model of Alzheimer's disease

Affiliations

Synaptic abnormalities in a Drosophila model of Alzheimer's disease

Siddhita D Mhatre et al. Dis Model Mech. 2014 Mar.

Abstract

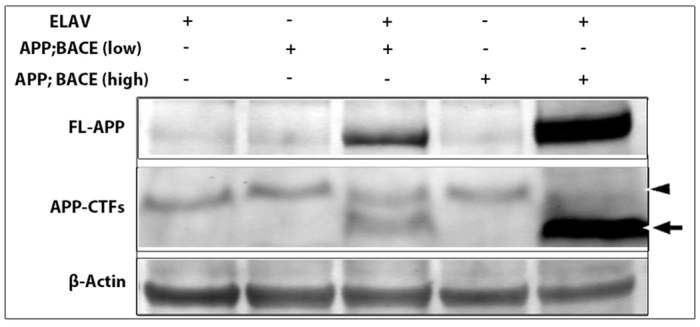
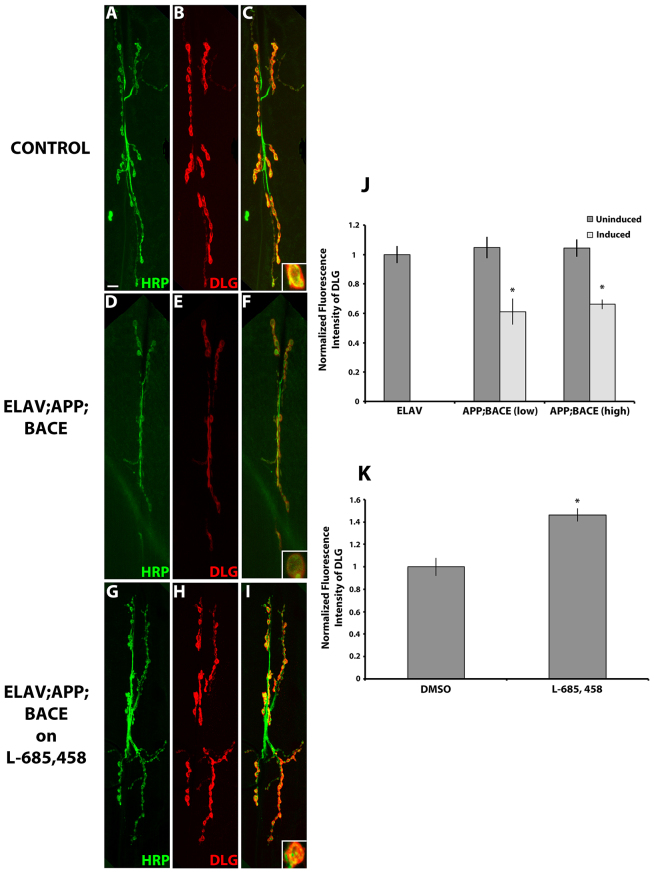
Alzheimer's disease (AD) is an age-related neurodegenerative disease characterized by memory loss and decreased synaptic function. Advances in transgenic animal models of AD have facilitated our understanding of this disorder, and have aided in the development, speed and efficiency of testing potential therapeutics. Recently, we have described the characterization of a novel model of AD in the fruit fly, Drosophila melanogaster, where we expressed the human AD-associated proteins APP and BACE in the central nervous system of the fly. Here we describe synaptic defects in the larval neuromuscular junction (NMJ) in this model. Our results indicate that expression of human APP and BACE at the larval NMJ leads to defective larval locomotion behavior, decreased presynaptic connections, altered mitochondrial localization in presynaptic motor neurons and decreased postsynaptic protein levels. Treating larvae expressing APP and BACE with the γ-secretase inhibitor L-685,458 suppresses the behavioral defects as well as the pre- and postsynaptic defects. We suggest that this model will be useful to assess and model the synaptic dysfunction normally associated with AD, and will also serve as a powerful in vivo tool for rapid testing of potential therapeutics for AD.

Keywords: APP; Alzheimer’s disease; BACE; Drosophila; NMJ; Synapse.


Figures

Fig. 1.
Fig. 1.
Differential expression of transgenes in fly lines. Western blot analysis of human APP and fly β-actin is detected in fly head lysates. Two independent fly lines were tested for the expression of the transgenes. Lane 1: elav; +; + heterozygous flies. Lane 2: +; APP; BACE (low) heterozygous flies. Lane 3: elav; APP; BACE (low) heterozygous flies. Lane 4: +; APP, BACE; + (high) heterozygous flies. Lane 5: elav; APP, BACE; + (high) heterozygous flies. FL-APP (full length APP; ~110 kD), APP-CTFs (C-terminal fragments; ~10–12 kD) and Appl-CTFs (~15 kD) were detected by C1/6.1. Arrow indicates β-CTFs in lanes 3 and 5. Arrowhead indicates Appl-CTFs in lanes 1–5. β-actin antibody was utilized for loading controls.
Fig. 2.
Fig. 2.
Effect of APP and BACE expression on behavioral phenotypes of Drosophila third instar larvae. (A) Number of body wall contractions per minute of third instar larvae under induced (Gal4 with UAS) and uninduced (Gal4 or UAS alone) conditions (n>30). (B) Distance crawled by larvae in 120 seconds (n>30). (C) Crawling velocity in cm/second for the third instar larvae under examination (n>30). Treatments are indicated. *P<0.05. Error bar represents standard error in each case.
Fig. 3.
Fig. 3.
γ-secretase inhibitor suppresses behavioral phenotypes in Drosophila third instar larvae expressing APP and BACE. (A) Number of body wall contractions per minute of third instar larvae expressing APP; BACE (high) raised on food with either DMSO or L-685,458 (n>30). (B) Distance crawled by larvae in 120 seconds (n>30). (C) Crawling velocity in cm/second for the third instar larvae under examination (n>30). Treatments are indicated. *P<0.05. Error bar represents standard error in each case.
Fig. 4.
Fig. 4.
Expression of human APP and BACE in Drosophila alters synapse formation. (A,B) Confocal image of the synapse of segment A3, muscle 6/7 stained with neuronal marker, HRP. (A) elav; +; + heterozygous larvae. (B) elav; APP; BACE (low) heterozygous larvae. Scale bar: 10 μm. Arrows represent 1s type boutons; arrowheads represent 1b type boutons. (C–G) Histograms depict quantitative analysis of bouton and branch number on muscles 6 and 7 at abdominal segment 3. (C) Total number of boutons. (D) Number of 1s type boutons. (E) Number of 1b type boutons. (F) Total number of branches. (G) Average muscle 6 and 7 area. Treatments are indicated. Analysis represents n>15. *P<0.05. Error bar represents standard error in each case.
Fig. 5.
Fig. 5.
Effect of γ-secretase inhibitor on synapse formation in Drosophila expressing APP and BACE. Confocal image of the synapse of segment A3, muscle 6/7 stained with neuronal marker HRP. (A) elav; APP; BACE (high) heterozygous larvae fed on DMSO. (B) elav; APP; BACE (high) heterozygous larvae fed on L-685,458. Scale bar: 10 μm. (C–G) Histogram depicts quantitative analysis of bouton and branch number on muscles 6 and 7 at abdominal segment 3 on APP; BACE (high) heterozygous larvae fed on either DMSO or L-685,458. (C) Total number of boutons. (D) Number of 1s type boutons. (E) Number of 1b type boutons. (F) Total number of branches. (G) Average muscle 6 and 7 area. Treatments are indicated. Analysis represents n>15. *P<0.05. Error bar represents standard error in each case.
Fig. 6.
Fig. 6.
Expression of human APP and BACE in Drosophila does not significantly alter active zones in synapses. (A–I) Confocal images of the synapse of segment A3, muscle 6/7 stained with neuronal marker HRP (green) and active zone marker Brp (red). (A–C) elav; +; + heterozygous larvae. (D–F) elav; APP; BACE (low) heterozygous larvae. (G–I) elav; APP; BACE (high) heterozygous larvae fed on L-685,458. Color merges are shown (C,F,I) with higher magnification of one bouton in the lower right. Scale bar: 10 μm. (J,K) Histograms depict quantitative analysis on larvae fed on food without drug. (J) Average number of active zones per NMJ. (K) Average Brp density. (L,M) Histograms depict quantitative analysis on elav; APP; BACE (high) heterozygous third instar Drosophila larvae fed on either DMSO or L-685,458. (L) Average number of active zones per NMJ. (M) Average Brp density. Treatments are indicated. Analysis represents n=8–10. *P<0.05. Error bar represents standard error in each case.
Fig. 7.
Fig. 7.
Expression of human APP and BACE in Drosophila does not alter synaptic vesicular protein CSP. (A–I) Confocal image of the synapse of segment A3, muscle 6/7 stained with neuronal marker, HRP (green) and presynaptic vesicle protein, CSP (red). (A–C) elav; +; + heterozygous larvae. (D–F) elav; APP; BACE (low) heterozygous larvae. (G–I) elav; APP; BACE (high) heterozygous larvae fed on L-685,458. Color merges are shown in C,F,I. Scale bar: 10 μm. (J,K) Histograms depict quantitative analysis. (J) Normalized fluorescence intensity of CSP. (K) Fluorescence intensity of CSP for elav; APP; BACE (high) heterozygous larvae fed on either DMSO or L-685,458 normalized to the vehicle control (DMSO). Treatments are indicated. Analysis represents n=10–14. *P<0.05. Error bar represents standard error in each case.
Fig. 8.
Fig. 8.
Expression of human APP and BACE in Drosophila alters the postsynaptic protein DLG. (A–I) Confocal image of the synapse of segment A3, muscle 6/7 stained with neuronal marker HRP (green) and postsynaptic protein DLG (red). (A–C) elav; +; + heterozygous larvae. (D–F) elav; APP; BACE (low) heterozygous larvae. (G–I) elav; APP; BACE (high) heterozygous larvae fed on L-685,458. Color merges are shown (C,F,I) with higher magnification of one bouton in the lower right. Scale bar: 10 μm. (J,K) Histograms depict quantitative analysis. (J) Normalized fluorescence intensity of DLG. (K) Fluorescence intensity of DLG for elav; APP; BACE (high) heterozygous larvae fed on either DMSO or L-685,458 normalized to the vehicle control (DMSO). Treatments are indicated. Analysis represents n=10–14. *P<0.05. Error bar represents standard error in each case.
Fig. 9.
Fig. 9.
Expression of human APP and BACE in Drosophila alters mitochondrial localization in the motor neurons. (A–I) Confocal images of the synapse of segment A3, muscle 6/7 stained with neuronal marker HRP (blue) and Mito-GFP (green). (A–C) elav; +; Mito-GFP heterozygous larvae. (D–F) elav; APP; Mito-GFP/BACE (low) heterozygous larvae. (G–I) elav; APP; Mito-GFP/BACE (high) heterozygous larvae fed on L-685,458. Color merges are shown (C,F,I). Scale bar: 10 μm. (J,K) Histograms depict quantitative analysis. (J) Normalized fluorescence intensity of Mito-GFP. (K) Fluorescence intensity of Mito-GFP for elav; APP; BACE (high) heterozygous larvae fed on either DMSO or L-685, 458 normalized to the vehicle control (DMSO). Treatments are indicated. Analysis represents n=8–15. *P<0.05. Error bar represents standard error in each case.

References

    1. Ashley J., Packard M., Ataman B., Budnik V. (2005). Fasciclin II signals new synapse formation through amyloid precursor protein and the scaffolding protein dX11/Mint. J. Neurosci. 25, 5943–5955 - PMC - PubMed
    1. Atwood H. L., Karunanithi S., Georgiou J., Charlton M. P. (1997). Strength of synaptic transmission at neuromuscular junctions of crustaceans and insects in relation to calcium entry. Invert. Neurosci. 3, 81–87 - PubMed
    1. Bonini N. M., Fortini M. E. (2003). Human neurodegenerative disease modeling using Drosophila. Annu. Rev. Neurosci. 26, 627–656 - PubMed
    1. Borlikova G. G., Trejo M., Mably A. J., McDonald J. M., Frigerio C. S., Regan C. M., Murphy K. J., Masliah E., Walsh D. M. (2013). Alzheimer brain-derived amyloid beta-protein impairs synaptic remodeling and memory consolidation. Neurobiol. Aging. 34, 1315–1327 - PMC - PubMed
    1. Braak H., Braak E. (1998). Evolution of neuronal changes in the course of Alzheimer’s disease. J. Neural Transm. Suppl. 53, 127–140 - PubMed

Publication types

MeSH terms