. 2014 Mar;124(3):1069-82.
doi: 10.1172/JCI67280.

Mutant p53-associated myosin-X upregulation promotes breast cancer invasion and metastasis

Mutant p53-associated myosin-X upregulation promotes breast cancer invasion and metastasis

Antti Arjonen et al. J Clin Invest. 2014 Mar.

Abstract

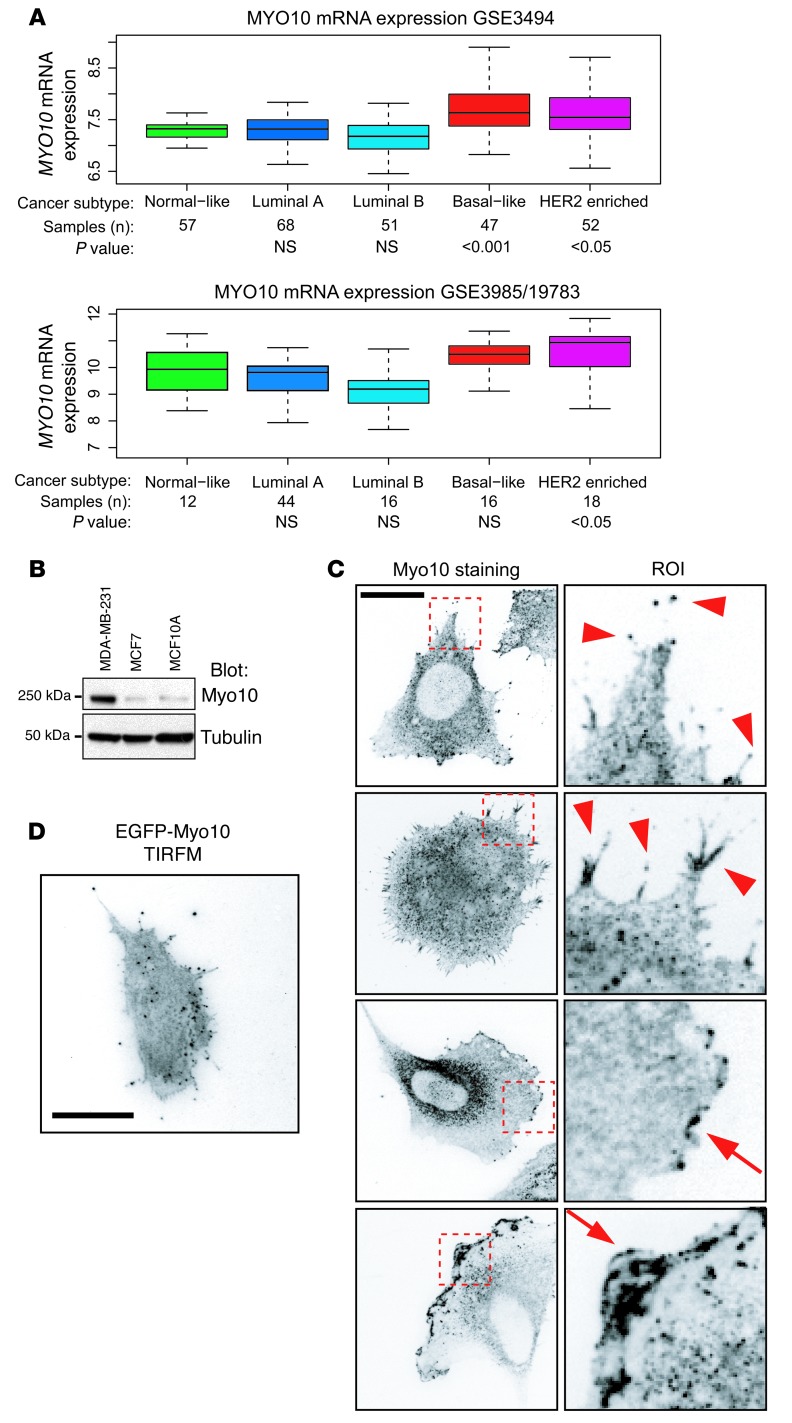
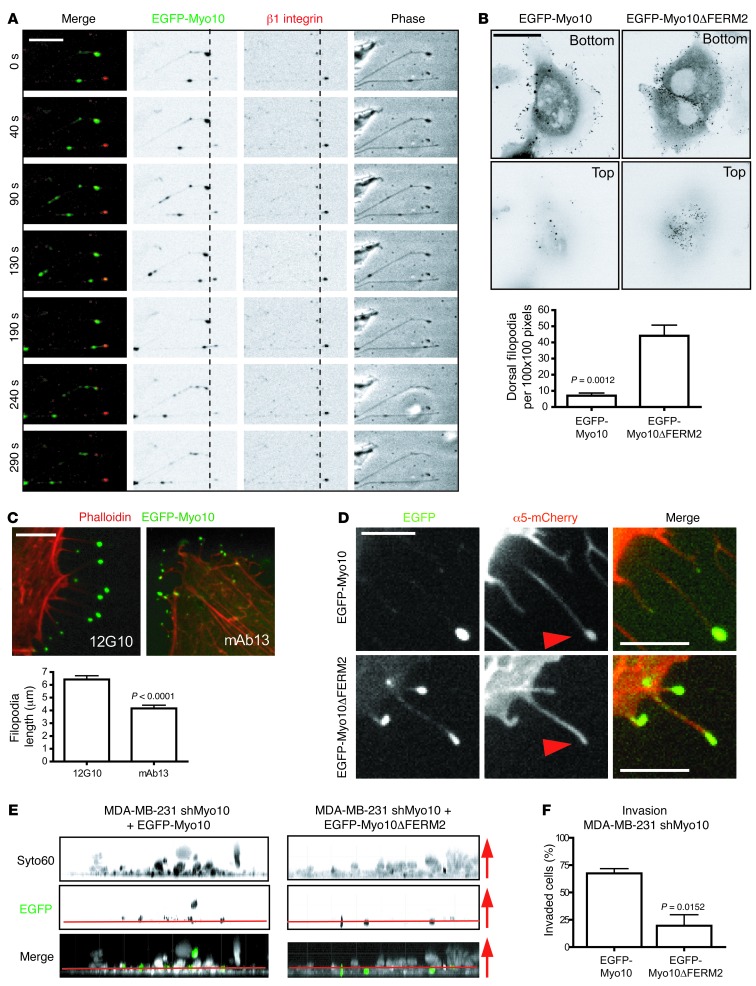
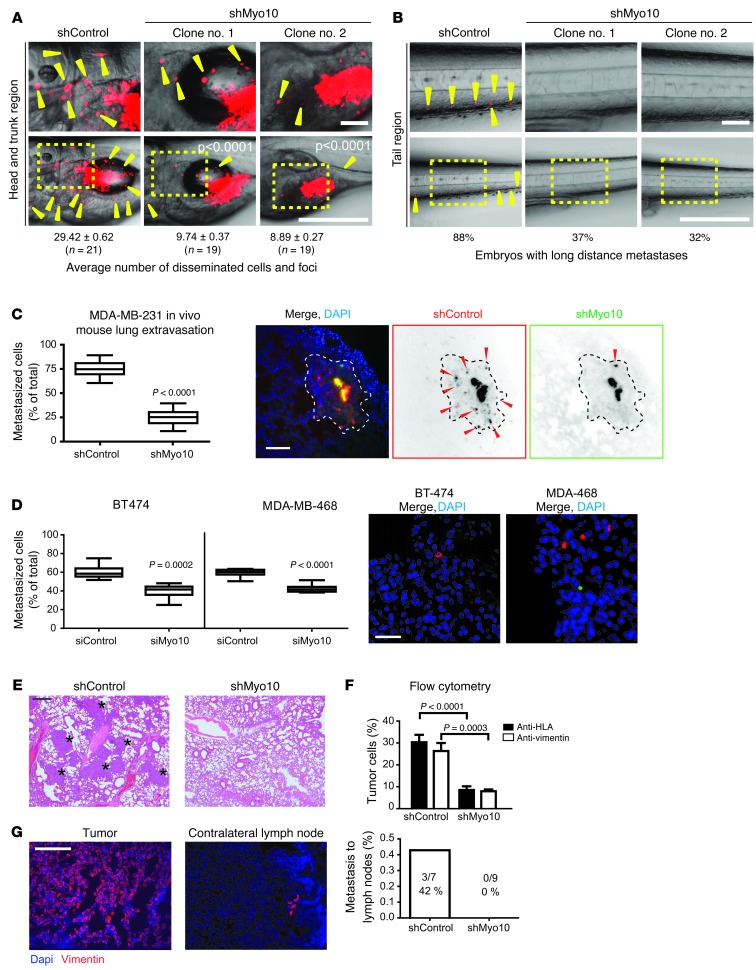
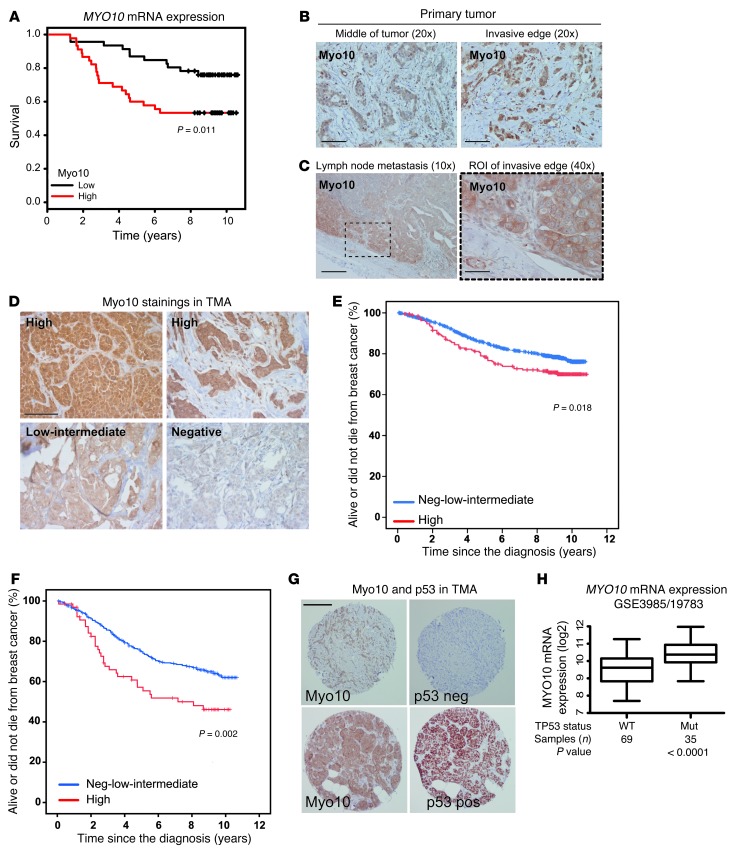
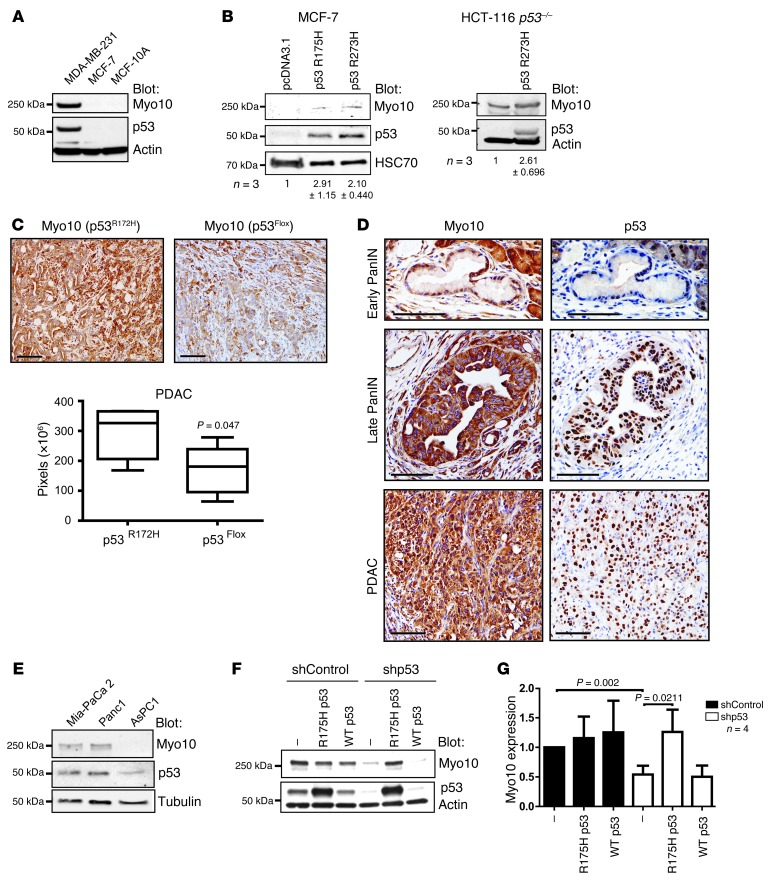
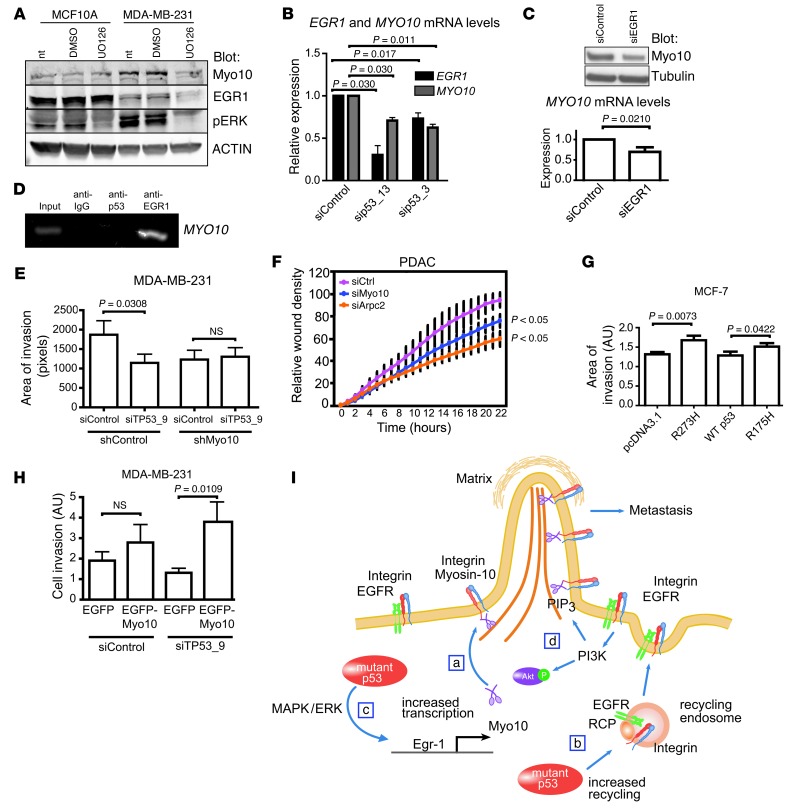
Mutations of the tumor suppressor TP53 are present in many forms of human cancer and are associated with increased tumor cell invasion and metastasis. Several mechanisms have been identified for promoting dissemination of cancer cells with TP53 mutations, including increased targeting of integrins to the plasma membrane. Here, we demonstrate a role for the filopodia-inducing motor protein Myosin-X (Myo10) in mutant p53-driven cancer invasion. Analysis of gene expression profiles from 2 breast cancer data sets revealed that MYO10 was highly expressed in aggressive cancer subtypes. Myo10 was required for breast cancer cell invasion and dissemination in multiple cancer cell lines and murine models of cancer metastasis. Evaluation of a Myo10 mutant without the integrin-binding domain revealed that the ability of Myo10 to transport β₁ integrins to the filopodia tip is required for invasion. Introduction of mutant p53 promoted Myo10 expression in cancer cells and pancreatic ductal adenocarcinoma in mice, whereas suppression of endogenous mutant p53 attenuated Myo10 levels and cell invasion. In clinical breast carcinomas, Myo10 was predominantly expressed at the invasive edges and correlated with the presence of TP53 mutations and poor prognosis. These data indicate that Myo10 upregulation in mutant p53-driven cancers is necessary for invasion and that plasma-membrane protrusions, such as filopodia, may serve as specialized metastatic engines.


Figures

Figure 1
Figure 1. Myo10 is upregulated in breast cancer.
(A) The expression levels of MYO10 mRNA in 109 (GEO GSE3985/GSE19783) and 251 (GEO GSE3494) clinical breast tumor samples are shown as the log2 expression ratio. Clinical tumor classification, number of samples, and statistical significance are indicated below the box plots. (B) Western blot of Myo10 in the indicated breast cancer cell lines. Tubulin is shown for loading control. (C) Immunofluorescence staining of Myo10 in MDA-MB-231 cells. Right panel shows ROI (10 μm × 10 μm). Arrowheads point to filopodial, and arrows point to lamellipodial Myo10 localization. Scale bar: 10 μm. (D) Total internal reflection fluorescence microscope (TIRFM) image of MDA-MB-231 cell expressing EGFP-Myo10. Scale bar: 10 μm.
Figure 2
Figure 2. Myo10 regulates spreading, migration, and invasion.
(A) shMyo10–expressing MDA-MB-231 cell clones analyzed by Western blot for expression of Myo10, Talin-1, β1 integrin, and tubulin. (B) Morphology of shRNA-expressing cells on Matrigel. Shown are cell outlines, calculated cell area, and roundness (inverse of major axis/minor axis). Area units are pixels. n = 25 (shControl); n = 26 (shMyo10). Scale bar: 20 μm. (C) Random migration of shMyo10-expressing (pooled clones no. 1 and no. 2) MDA-MB-231 cells on Matrigel. Cumulative mean square displacement of tracked cells is shown. n = 75 (shControl) and n = 85 (shMyo10). (D) Invasion of shMyo10-expressing (pooled clones no. 1 and no. 2) MDA-MB-231 cells into Matrigel (4 days). Images show side views of invasion. Column graph shows mean invasion areas, and arrows indicate the direction of invasion. n = 10 (shControl); n = 14 (shMyo10) fields of view with ×20 objective. (E) Invasion of MCF-7 cells transfected with EGFP alone or EGFP-Myo10. Column graph shows the percentage of invaded GFP-positive cells from all GFP-positive cells. n = 10 (shControl); n = 8 (shMyo10) fields of view with ×20 objective. (F) Adhesion of shMyo10-expressing (pooled clones no. 1 and no. 2) MDA-MB-231 cells on fibronectin (5 μg/ml) was analyzed at 30- and 60-minute time points as 3 independent experiments. (G) Filopodial phenotype of shMyo10-expressing (pooled clones no. 1 and no. 2) MDA-MB-231 cells spreading actively on fibronectin (5 μg/ml). The number of cells expressing clear filopodial phenotype is shown. n = 21 (shControl); n = 25 (shMyo10). (H) Images show examples of the filopodia phenotype. Scale bar: 20 μm. Mean ± SEM and Mann-Whitney test P values are provided.
Figure 3
Figure 3. Myo10-mediated targeting of integrin to the filopodia tip is critical for invasion.
(A) Cells expressing EGFP-Myo10 (green) stained with fluorescently labeled β1 integrin antibody (red). Time-lapse images of filopodia dynamics acquired at 10-second intervals. Still images of Myo10 moving back and forth along filopodia are shown. β1 Integrin is mostly seen at the filopodia tip. Scale bar: 5 μm. (B) MDA-MB-231 cells transfected with EGFP-Myo10 and EGFP-Myo10ΔFERM2 and analyzed for filopodia localization. Images show confocal slices at the bottom and the top of the cells. Graph shows the number of dorsal filopodia. Scale bar: 10 μm. (C) MDA-MB-231 cells transfected with EGFP-Myo10 (green) and treated with β1 integrin function–blocking (mAb13) and –activating (12G10) antibodies and stained for filamentous actin. Filopodia lengths were measured along filopodia shafts. Scale bar: 10 μm. (D) Myo10 shRNA–expressing MDA-MB-231 cells (pooled clones no. 1 and no. 2; shMyo10) transfected as indicated and imaged for localization of β1 integrin at the filopodia tips. Representative images are shown. Scale bar: 5 μm. (E, F) shMyo10 cells transfected with EGFP-Myo10 or EGFP-Myo10ΔFERM2 (green) to reconstitute Myo10 expression. Invasion into Matrigel (4 days) was analyzed by detecting all cells with Syto60 staining (white in the merged image) and the transfected cells by EGFP. Images show side view z-stacks. Arrows indicate the direction of invasion. The noninvaded cells at the bottom of the wells are below the red line. n = 6 (EGFP-Myo10) and n = 9 (EGFP-MYO10 ΔFERM) fields of view with ×20 objective. Mean ± SEM and Mann-Whitney test P values are provided.
Figure 4
Figure 4. Myo10 regulates invasion and metastasis in vivo.
(A and B) Labeled shControl and shMyo10 MDA-MB-231 cells were microinjected into zebrafish embryos, and dissemination (yellow arrowheads) was observed 4 days after implantation. Top panels show higher magnification regions of head-trunk and tail areas. Scale bars 500 μm (top panels); 100 μm (bottom panels). (C and D) Extravasation of shControl and shMyo10 MDA-MB-231 cells (C) or siMyo10 and siControl-transfected MDA-MB-468 and BT-474 breast cancer cells (D) into mouse lungs was studied in vivo. shMyo10/siMyo10 cells (green) and shControl/siControl cells (red) were coinjected (1:1) into the tail vein. After 48 hours, extravasated cells (arrowheads) were analyzed from lung sections visually (C) (12 sections/mouse) or by flow cytometry (D). Shown are representative lung sections stained with dapi. Scale bar: 300 μm (C and D). Area containing extravasated shControl cells is indicated with a dashed line. (E and F) Lung colonization of tail vein–injected unstained shControl and shMyo10 cells (4 weeks after injection). Shown are representative H&E stainings of lung tissue sections (E) (metastases indicated with asterisks) and FACS analysis of the human HLA or human vimentin–positive cells (%) of all the cells isolated from lungs (F). Scale bar: 100 μm. (G) Systemic spreading of shMyo10 or shControl cells injected orthotopically to mammary fat pads of nude mice was assessed after 6 weeks from frozen contralateral lymph nodes with vimentin staining, and primary tumors were stained for reference. Quantitation shows the number of mice with metastasis in the lymph nodes. Scale bar: 300 μm. Mean ± SEM and Mann Whitney test P values; n = 10 mice.
Figure 5
Figure 5. High Myo10 expression in clinical breast cancer samples.
(A) MYO10 expression and survival (Kaplan-Meier curves) were analyzed in 104 patients with early breast cancer (GEO GSE3985/GSE19783 series; ref. 4). log-rank test P value, P = 0.011. (B) Myo10 protein immunostaining from the middle and at the invasive edges of the primary breast carcinomas. Scale bar: 200 μm. (C) Expression of Myo10 in a lymph node metastasis from the primary tumor shown in B. Scale bar: 100 μm (original magnification, ×10); 400 μm (original magnification, ×40). (D) Examples of immunostaining, and scoring of different Myo10 expression levels in TMA samples. Scale bar: 100 μm. (E) Survival of 1,326 Finnish patients with early breast cancer and high Myo10 expression (red) or low-intermediate/negative Myo10 expression (blue). log-rank test, P = 0.018. (F) Survival of the subset of 482 patients with regional lymph node–positive breast cancer (pN+) as in E. (G) Comparison of tumor Myo10 and p53 staining from adjacent TMA slices from a tumor with negative and positive Myo10 and p53 expression. Scale bar: 200 μm. (H) Analysis of MYO10 mRNA expression (log2 scale, P value, Student’s t test) and p53 mutations in breast cancer (n = 109; GEO GSE3985/GSE19783 series; ref. 4).
Figure 6
Figure 6. Mutant p53 regulates Myo10 expression.
(A) Western blot of Myo10, p53, and actin (loading control) in the indicated cell lines. (B) Western blot of mutant p53–transfected (R175H or R273H) MCF-7 and in HCT-116 p53–/– cells stably expressing mutant p53 (R273H). The number of experiments (n) and the quantification of Myo10 levels relative to the control are shown. (C) PDAC sections from mice expressing mutant p53 (p53R172H) and mice with deleted p53 (p53flox) were stained and quantified (Slidepath software, pixel count) for Myo10 expression. Scale bar: 100 μm. (P = 0.047, Mann Whitney test, n = 5 tumors). (D) Early PanIN (top panels), late PanIN (middle panels), and PDAC (bottom panels) sections were stained for Myo10 and mutant p53 expression. Scale bars: 100 μm. (E) Western blotting of Myo10, p53, and tubulin in human pancreatic cancer cell lines. (F, G) Myo10 expression in MDA-MB-231 cells upon shRNA-mediated mutant p53 silencing and reexpression of shRNA-insensitive R175H p53 or WT p53 (mean ± SEM, n = 4, Mann Whitney test).
Figure 7
Figure 7. Myo10 is necessary for mutant p53–driven invasion.
(A) Western blot of MCF10A and MDA-MB-231 cells treated 16 hours with DMSO or MEK inhibitor (UO126, 10 μM). NT, non-treated. (B)TaqMan qRT-PCR of MYO10 and EGR1 mRNA levels in MDA-MB-231 cells silenced with 2 different p53 targeting oligos. n = 2 (sip53_13); n = 4 (sip53_3). (C) Western blot and TaqMan qRT-PCR showing Myo10 expression upon silencing of EGR1 for 48 hours. (D) ChIP analysis of mutant p53 or EGR1 binding to MYO10 promoter by PCR using Myo10 promoter–specific primers. IgG antibody was used as negative control. (E) Matrigel invasion of shMyo10 cells upon silencing of TP53 (areas of invasion, n = 10, ×20 objective). (F) Invasion of murine PDAC cells transfected with siMyo10 or siArpc2 (Arp2/3 component, positive control) into Matrigel-overlaid wounds. (G) MCF-7 cells were transfected as indicated, and invasion was analyzed as in E. (H) Invasion of p53-silenced MDA-MB-231 cells transfected as indicated (percentage of invaded/all GFP-positive cells; n = 9–14; ×20 objective. (I) Model of mutant p53–driven, integrin-dependent invasion. (a) Mutant p53 induces Myo10 that contributes to mutant p53–driven invasion by transporting integrin to filopodia tips. (b) Mutant p53 increases integrin and EGFR recycling to the plasma membrane (19) providing integrins to be transported to filopodia tips by Myo10. (c) Mutant p53 drives Myo10 by increasing EGR1 transcription directly and via MAPK/ERK signaling. (d) Increased integrin-EGFR recycling elevates PIP3 levels via PI3K/Akt pathway (19) and activates Myo10 (48). Mean ± SEM and Mann-Whitney test P values are shown.

References

    1. Weigelt B, Peterse JL, van ‘t Veer LJ. Breast cancer metastasis: markers and models. Nat Rev Cancer. 2005;5(8):591–602. doi: 10.1038/nrc1670. - DOI - PubMed
    1. Sorlie T, et al. Gene expression patterns of breast carcinomas distinguish tumor subclasses with clinical implications. Proc Natl Acad Sci U S A. 2001;98(19):10869–10874. doi: 10.1073/pnas.191367098. - DOI - PMC - PubMed
    1. Perou CM, et al. Molecular portraits of human breast tumours. Nature. 2000;406(6797):747–752. doi: 10.1038/35021093. - DOI - PubMed
    1. Naume B, et al. Presence of bone marrow micrometastasis is associated with different recurrence risk within molecular subtypes of breast cancer. Mol Oncol. 2007;1(2):160–171. doi: 10.1016/j.molonc.2007.03.004. - DOI - PMC - PubMed
    1. Faix J, Rottner K. The making of filopodia. Curr Opin Cell Biol. 2006;18(1):18–25. doi: 10.1016/j.ceb.2005.11.002. - DOI - PubMed

Publication types

MeSH terms