. 2014 Apr 17;508(7496):357-63.
doi: 10.1038/nature13021. Epub 2014 Feb 2.

Skilled reaching relies on a V2a propriospinal internal copy circuit

Affiliations

Skilled reaching relies on a V2a propriospinal internal copy circuit

Eiman Azim et al. Nature. .

Abstract

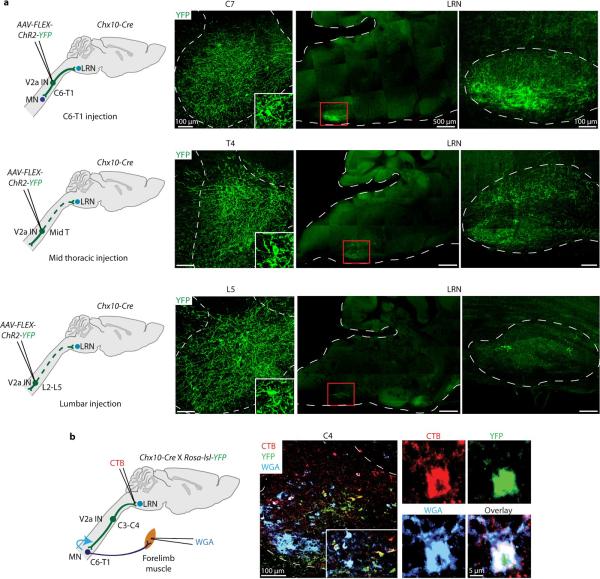
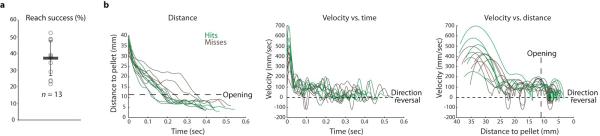
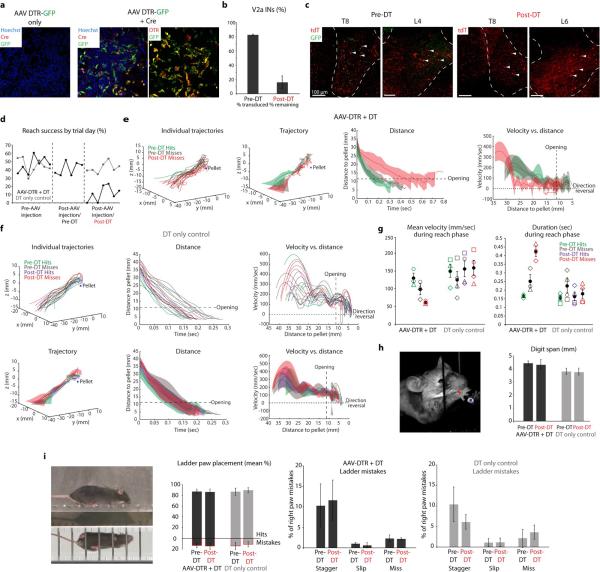
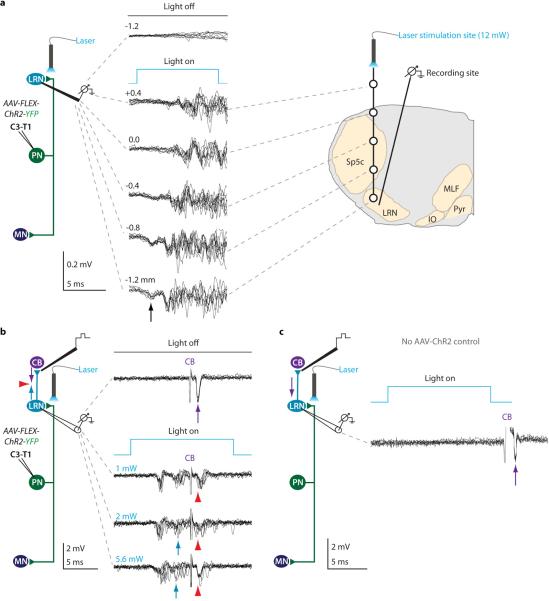
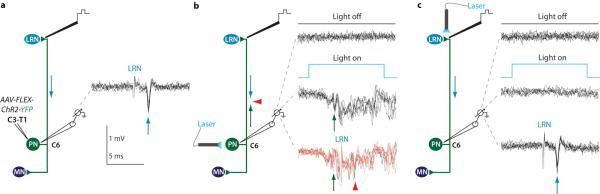
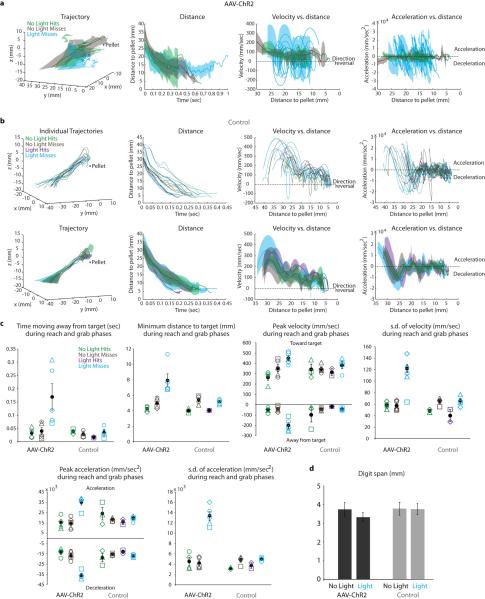
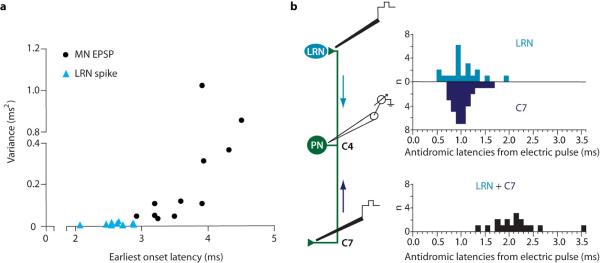
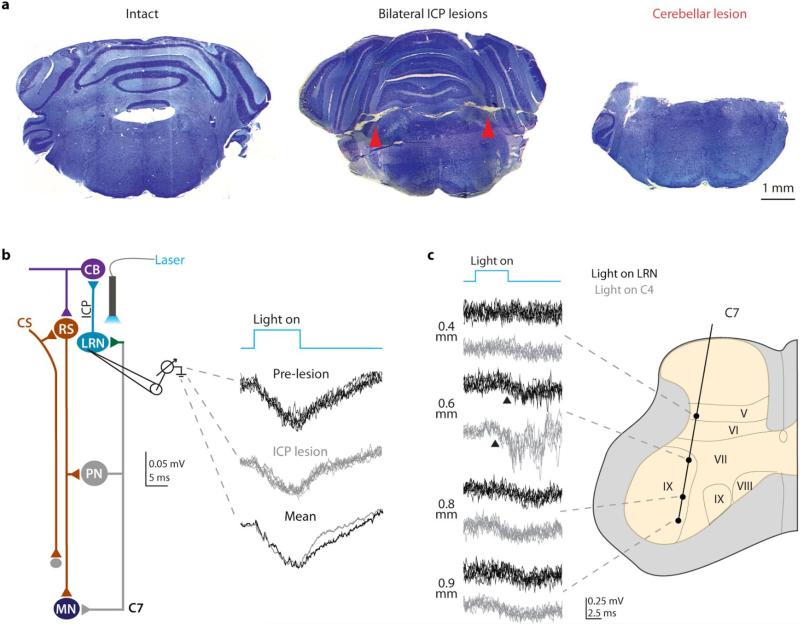
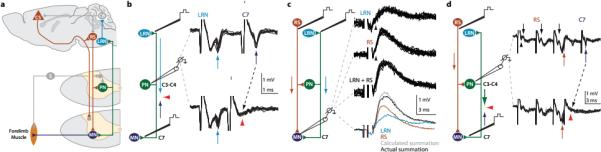
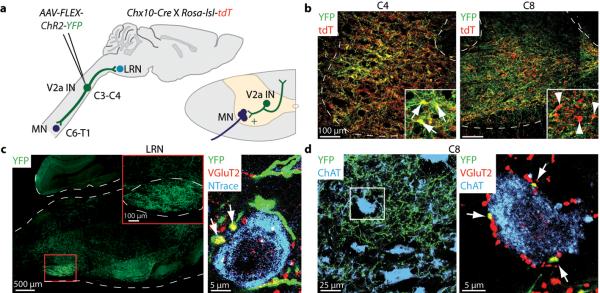
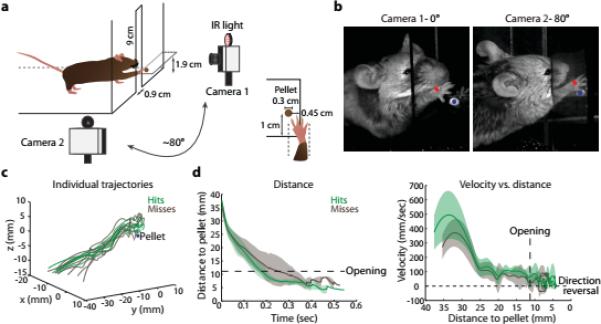
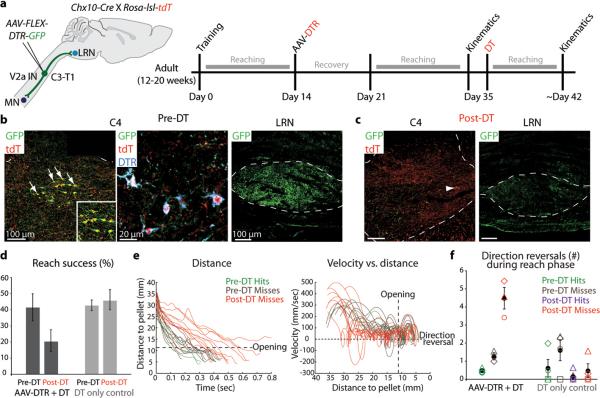
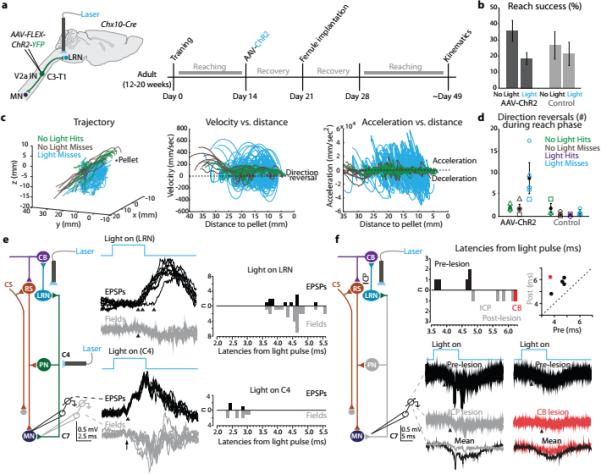
The precision of skilled forelimb movement has long been presumed to rely on rapid feedback corrections triggered by internally directed copies of outgoing motor commands, but the functional relevance of inferred internal copy circuits has remained unclear. One class of spinal interneurons implicated in the control of mammalian forelimb movement, cervical propriospinal neurons (PNs), has the potential to convey an internal copy of premotor signals through dual innervation of forelimb-innervating motor neurons and precerebellar neurons of the lateral reticular nucleus. Here we examine whether the PN internal copy pathway functions in the control of goal-directed reaching. In mice, PNs include a genetically accessible subpopulation of cervical V2a interneurons, and their targeted ablation perturbs reaching while leaving intact other elements of forelimb movement. Moreover, optogenetic activation of the PN internal copy branch recruits a rapid cerebellar feedback loop that modulates forelimb motor neuron activity and severely disrupts reaching kinematics. Our findings implicate V2a PNs as the focus of an internal copy pathway assigned to the rapid updating of motor output during reaching behaviour.


Figures

Extended Data Figure 1
Extended Data Figure 1. LRN-projecting V2a INs are restricted to cervical segments
a, AAV-FLEX-hChR2-YFP was injected unilaterally into C6-T1, mid thoracic and mid lumbar spinal cord of adult Chx10-Cre mice. YFP+ projections to the LRN could be identified following C3-C4 (see Fig. 2) and C6-T1 V2a IN transduction, but were minimal or absent following thoracic or lumbar transduction. b, Dual injection of CTB into the LRN (red) and WGA into triceps brachii muscle (blue) labeled YFP+ V2a INs (green) in intermediate levels of cervical cord in Chx10-Cre;Rosa-lsl-YFP mice. CTB also labeled YFPoff neurons, potentially corresponding to inhibitory PNs.
Extended Data Figure 2
Extended Data Figure 2. 3D kinematics of mouse reaching
a, Following training, mice exhibited a high degree of variability in success in the multi-reach assay (37.0% +/− 10.4% s.d.; n = 13). Error bars indicate s.d. The mean s.d. of reach success from day to day across mice was 10.2% +/− 4.1% s.d. (n = 13). b, Individual reach plots of paw distance to pellet, velocity vs. time and velocity vs. distance to pellet from a representative mouse. Transition from the early reach phase to the late grab phase of the movement is delineated by the box opening (large dashes). Velocity crossings of zero (small dashes) indicate reversals in direction toward or away from the pellet. See Fig. 3d for mean plots from the same mouse.
Extended Data Figure 3
Extended Data Figure 3. Ablation of C3-T1 V2a INs selectively perturbs reaching
a, AAV-FLEX-DTR-GFP plasmid DNA was transfected into 293T cells. Only when co-transfected with a Cre-expressing plasmid (red; middle panel) did recombination occur, resulting in expression of DTR (red; right panel) and GFP. b, After viral injection into C3-T1 of adult Chx10::tdT mice, 83% (+/− 0.3% s.e.m.; n = 2) of tdT+ V2a IN cell bodies co-expressed GFP and DTR. After DT administration, there was an 84% (+/− 9% s.e.m.; n = 2) reduction in the number of tdT+ V2a INs in C3-T1. Error bars indicate s.e.m. c, No GFP+ V2a INs (arrowheads) were found in mid thoracic or lumbar segments prior to DT administration, and normal numbers of V2a INs remained following DT administration (arrowheads). d, Success in the multi-reach task quantified by day from a representative DTR-transduced mouse (black) and control mouse (gray). Viral injection did not affect success rate, while subsequent DT administration reduced success in the DTR-transduced but not control mouse. See Fig. 4d for mean success rates across mice (pre-DT, 41.3% +/− 8.3% s.e.m.; post-DT, 20.7% +/− 6.7% s.e.m; n = 3 DTR, n = 4 control; two-way repeated-measures ANOVA, interaction of group × toxin: F1,5 = 6.67, P = 0.049; post-hoc Bonferroni test, DT: P < 0.05). e, Individual reach trajectories and mean kinematics from a representative DTR-transduced mouse reveal perturbation of trajectory, duration and velocity following ablation. There were no successful reaches in the kinematic assay following V2a IN ablation (Supplementary Note 4). See Fig. 4e for individual reach plots from the same mouse. f, Individual and mean reach kinematics from a representative control mouse show no effects of DT administration. Shaded regions indicate s.d. g, In DTR-transduced mice relative to control mice, mean paw velocity decreased (n = 3 DTR, n = 4 control; two-way repeated-measures ANOVA, interaction of group × condition, reach phase: F2,10 = 8.315, P = 0.008; post-hoc Tukey test, DTR pre-DT hits vs. post-DT misses, P < 0.01; grab phase: F2,10 = 0.063, P = 0.55) and mean duration of paw movement increased (reach phase: F2,10 = 15.37, P = 0.0009; post-hoc Tukey test, DTR pre-DT hits vs. post-DT misses, P < 0.0001, DTR pre-DT misses vs. post-DT misses, P < 0.01; grab phase: F2,10 = 0.99, P = 0.40) during the reach phase but not the grab phase following ablation. As shown in Fig. 4f, the mean number of direction reversals increased during the reach, but not the grab, phase in DTR-transduced mice, relative to control mice (reach phase: F2,10 = 19.03, P = 0.0004; post-hoc Tukey test, DTR pre-DT hits vs. post-DT misses, P < 0.001, DTR pre-DT misses vs. post-DT misses, P < 0.001; grab phase: F2,10 = 2.64, P = 0.12). Shapes represent individual mice and black circles indicate means across mice. See Extended Data Table 1. h, Digit abduction (maximum distance between digits 2 and 4) during grasp attempts was unaffected by V2a IN ablation (n = 3 DTR, n = 4 control; twoway repeated-measures ANOVA, F1,5 = 0.088, P = 0.78). i, V2a IN ablation had no effect on the mean number of mistakes in right forepaw placement during a horizontal ladder locomotion test (n = 3 DTR, n = 3 control; two-way repeated-measures ANOVA, F1,4 = 3.53, P = 0.13). Moreover, ablation had no effect on the types of mistakes made (stagger, slip, or miss; n = 3 DTR, n = 3 control; two-way repeated-measures ANOVA, stagger: F1,4 = 2.49, P = 0.19; slip: F1,4 = 0.41, P = 0.56; miss: F1,4 = 5.17, P = 0.09). Error bars indicate s.e.m.
Extended Data Figure 4
Extended Data Figure 4. Selective photo-activation of PN input to the LRN
a, Population recordings in the LRN revealed photo-stimulation induced synaptic activation of LRN neurons across a range of optical fiber depths in and above the brainstem. Retraction of the optical fiber from the LRN (presumably resulting in a decrease in light exposure) resulted in a reduced amplitude of the LRN extracellular field potential (arrow), and, consequently in an increase in LRN neuronal firing latency. Schematic depicts coronal section of caudal brainstem and optical fiber depths. Sp5c, spinal trigeminal nucleus, caudal part; MLF, medial longitudinal fasciculus; IO, inferior olive; Pyr, pyramidal tract. b, Extracellular recording of LRN neurons antidromically activated from cerebellum (CB; 20 μA; purple arrows), with the optical fiber just dorsal to the LRN, revealed activation (blue arrows) and spike collision (red arrowheads) across a range of laser intensities (also see Fig. 5a). Increasing the light intensity caused more intense synaptic firing and a slight shortening of the latency from light onset. c, Extracellular recording of LRN neurons in control mice revealed no activation and no collision of the electrically-induced antidromic spike from the cerebellum (purple arrows) during photo-stimulation (n = 0/14 neurons).
Extended Data Figure 5
Extended Data Figure 5. Photo-activation of PN terminals in the LRN does not elicit antidromic spikes
a, PNs in C6 were identified antidromically by electrical stimulation from the LRN (40 μA; arrows) and C7 ventral horn (40 μA; not shown) and by spike collision (not shown). b, Cervical photo-stimulation of the same PN cell bodies activated 69.2% of PNs (n = 9/13; green arrows indicate single spikes), as identified by collision of the LRN antidromic spike (lower red traces; red arrowheads; compare with antidromic spike in a; two lower black traces exhibit failed collision). c, In the same PNs, photo-stimulation of PN terminals in the LRN did not trigger antidromic spikes that invaded the cell body (0/31 PNs; 0/3 in control mice), whereas electrical stimulation in the LRN always produced antidromic spikes (lower traces; arrow; compare with antidromic spike in a). Also see Fig. 5b-d.
Extended Data Figure 6
Extended Data Figure 6. Selective photo-stimulation of PN terminals in the LRN perturbs reaching
a, Mean reach kinematics from a representative mouse with perturbed reach trajectory and large fluctuations in velocity and acceleration during PN terminal photo-stimulation. See Fig. 6c for individual reach plots from the same mouse. As shown in Fig. 6b, photo-stimulation reduced success in the multi-reach task in ChR2 vs. control mice (no light, 35.7% +/− 6.5% s.e.m.; light, 18.3% +/− 3.8% s.e.m.; n = 5 ChR2, n = 4 control; two-way repeated-measures ANOVA, interaction of group × light: F1,7 = 8.65, P = 0.02; post-hoc Bonferroni test, ChR2: P < 0.001). There were no successful reaches in the kinematic assay during PN terminal photo-stimulation (Supplementary Note 4). b, Individual and mean reach kinematics from a representative control mouse show no effects of LRN photo-stimulation. Shaded regions indicate s.d. c, As shown in Fig. 6d, the mean number of direction reversals during the reach phase increased during photo-stimulation in ChR2 mice, relative to control mice (n = 5 ChR2, n = 4 control; two-way ANOVA, interaction of group × condition, reach phase: F2,19 = 5.24, P = 0.02; post-hoc Tukey test, ChR2 no light hits vs. light misses, P < 0.01, ChR2 no light misses vs. light misses, P < 0.01; grab phase: F2,19 = 2.70, P = 0.09). In addition, photo-stimulation resulted in severe kinematic perturbation during the entire movement (reach and grab phases) in ChR2 mice relative to control mice, including increases in: the mean amount of time spent moving away from the pellet (F2,19 = 4.07, P = 0.03; post-hoc Tukey test, ChR2 no light hits vs. light misses, P < 0.01, ChR2 no light misses vs. light misses, P < 0.01); the mean minimum distance from the paw to the pellet (F2,19 = 6.37, P = 0.008; post-hoc Tukey test, ChR2 no light hits vs. light misses, P < 0.0001, ChR2 no light misses vs. light misses, P < 0.001); the mean peak velocity away from the pellet (F2,19 = 9.08, P = 0.002; post-hoc Tukey test, ChR2 no light hits vs. light misses, P < 0.001, ChR2 no light misses vs. light misses, P < 0.001); the mean s.d. of the velocity (F2,18 = 25.02, P < 0.0001; post-hoc Tukey test, ChR2 no light hits vs. light misses, P < 0.0001, ChR2 no light misses vs. light misses, P < 0.0001); the mean peak acceleration and deceleration (acceleration: F2,19 = 10.08, P = 0.001; post-hoc Tukey test, ChR2 no light hits vs. light misses, P < 0.001, ChR2 no light misses vs. light misses, P < 0.0001; deceleration: F2,19 = 21.53, P < 0.0001; post-hoc Tukey test, ChR2 no light hits vs. light misses, P < 0.0001, ChR2 no light misses vs. light misses, P < 0.0001); and the mean s.d. of the acceleration (F2,18 = 29.21, P < 0.0001; post-hoc Tukey test, ChR2 no light hits vs. light misses, P < 0.0001, ChR2 no light misses vs. light misses, P < 0.0001). Shapes represent individual mice. Black circles indicate means across mice. See Extended Data Table 2. d, Digit abduction (maximum distance between digits 2 and 4) during grasp attempts was unaffected by photo-stimulation (n = 5 ChR2, n = 4 control; two-way repeated-measures ANOVA, F1,7 = 3.71, P = 0.10). Error bars indicate s.e.m.
Extended Data Figure 7
Extended Data Figure 7. Variance of LRN neuronal spiking and motor neuron EPSPs during PN terminal photo-stimulation, and evaluation of electrically-induced antidromic action potentials in PNs
a, LRN neurons exhibited low jitter spiking (mean variance 0.009 +/− 0.006 ms2 s.d.; n = 9), consistent with monosynaptic input, during photo-stimulation of PN terminals in the LRN. This contrasts sharply with large motor neuron (MN) EPSP jitter during PN terminal photo-stimulation (mean variance 0.28 +/− 0.35 ms2 s.d.; n = 11), consistent with recruitment of a polysynaptic pathway. An ~30-fold increase in the variance for MN EPSPs as compared to LRN spiking can be seen. Variance was calculated with respect to the shortest latency response. b, Antidromic spiking of PN somata evoked by electrical stimulation of their ascending (LRN; light blue) and descending (C7; dark blue) axonal branches occurred with a mean latency of ~1 ms in each case, adding to a total conduction time of about 2 ms (black). Subtracting approximate axonal activation and two soma invasion times, which are likely each on the order of 0.4 ms, provides an estimate for the conduction time of an antidromic action potential across both branches of the PN – in the ~1 – 1.2 ms range. See Supplementary Discussion.
Extended Data Figure 8
Extended Data Figure 8. Photo-stimulation of PN input to the LRN before and after cerebellar lesion
a, Post-physiology histology confirmed intact inferior cerebellar peduncles (ICP) in control mice and bilateral lesion of ICP (red arrowheads; n = 4) and complete removal of cerebellar cortex and deep cerebellar nuclei (n = 1) in experimental mice. b, Cerebellar lesions resulted in no change in LRN field potential size during PN terminal photo-stimulation (n = 2; two-tailed paired t-test). c, In non-lesioned mice, C7 field potential recordings revealed that photo-stimulation of PN terminals in the LRN (black traces) or PN somata in C4 (gray traces) elicited responses restricted to ventral regions of the gray matter, near motor neurons and their dendrites. Field onsets (arrowheads) were consistently longer following LRN vs. C4 photo-stimulation (also see Fig. 6e). Schematic depicts axial section of C7 and recording electrode depths. Roman numerals indicate Rexed laminae.
Figure 1
Figure 1. Identification of mouse PNs
a, PNs receive direct and indirect supraspinal (corticospinal–CS; reticulospinal–RS) and sensory (S) input. PNs innervate cervical motor neurons (MN) and LRN neurons that project to cerebellum (CB). b, In vivo extracellular recordings (C3/C4) while stimulating LRN (20-100 μA) and C7 ventral horn (40 μA) revealed antidromic spikes (arrows) and collision (red arrowheads; n = 12). c, Intracellular MN recordings during LRN stimulation revealed monosynaptic EPSPs (100 μA; n = 29). LRN-induced EPSPs summate with monosynaptic EPSPs elicited by RS stimulation (100 μA; n = 34; arrowheads, EPSP onset). d, Extracellular PN recordings, identified via C7 (17 μA; blue arrows) and LRN stimulation (not shown), revealed monosynaptic spikes following RS stimulation (3 × 50 μA; red arrows; n = 14) and collision (red arrowheads; n = 17). See Supplementary Note 1.
Figure 2
Figure 2. Excitatory PNs are a V2a IN subpopulation
a, Unilateral C3/C4 injection of AAV-FLEX-hChR2-YFP into Chx10::tdT mice. b, 82% (+/− 7% s.e.m.; n = 2) of C3/C4 tdT+ V2a INs were transduced (C4, yellow neurons, arrows; C8, red only neurons, arrowheads). c, YFP+ V2a INs project to LRN. Neurons, labeled with NeuroTrace (blue), studded with vGluT2+ (red), YFP+ boutons (arrows, yellow boutons). Sparse YFP+ axonal labeling also in facial nucleus. d, C7/C8 ChAT+ MNs (blue) contacted by vGluT2+ (red), YFP+ boutons (arrows, yellow boutons).
Figure 3
Figure 3. Reaching kinematics
a, Mice were trained to reach for a food pellet displaced to the left. b, High-speed capture and tracking of an infrared (IR)-reflective marker attached to the right paw. c, Trajectories of successful (hits, green traces) and unsuccessful trials (misses, brown traces) from a representative mouse. d, Mean kinematics from a representative mouse. Transition from reach to grab phase delineated by box opening (large dashes). Velocity crossings of zero (small dashes) indicate direction reversals. Shaded regions indicate s.d. See Extended Data Fig. 2b.
Figure 4
Figure 4. Cervical V2a IN ablation perturbs reaching
a, Experimental design. b, After C3-T1 AAV-FLEX-DTR-GFP injection 83% (+/− 0.3% s.e.m.; n = 2) of tdT+ V2a INs co-expressed GFP and DTR (arrows), and GFP+ projections were detected in LRN. c, Post-DT, 84% (+/− 9% s.e.m.; n = 2) of C3-T1 tdT+ V2a INs and GFP+ LRN projections were eliminated (arrowhead, spared V2a IN). d, Ablation reduced success in the multi-reach task (n = 3 DTR, n = 4 control). e, Kinematics from a representative V2a IN-ablated mouse. See Extended Data Fig. 3e. f, Mean number of direction reversals increased during reach, but not grab, phase in V2a IN-ablated mice. Shapes represent individual mice. Error bars indicate s.e.m. See Extended Data Table 1 and Extended Data Fig. 3 for statistical analysis.
Figure 5
Figure 5. Photo-activation of PN terminals in the LRN
a, Extracellular recording of LRN neurons antidromically activated from cerebellum (20 μA; purple arrows) during PN terminal photo-stimulation (473 nm) revealed repeated spiking (n = 8/21; blue arrows) and collision (red arrowheads, two collision failures in bottom traces). b, PNs in C3/C4 were identified by electrical stimulation from LRN (80 μA) and C7 (40 μA) and by collision (not shown). c, Photo-stimulation of the same PN cell bodies activated 69% of PNs (n = 9/13; green arrows), verified by collision of C7 spike (lower traces; red arrowheads; compare with antidromic spike in b). See Supplementary Note 6. d, In the same PNs, photo-stimulation of terminals in LRN did not trigger antidromic spikes (0/31 PNs; 0/3 control), whereas electrical stimulation in LRN always produced antidromic spikes (lower traces; arrow; compare with antidromic spike in b). See Extended Data Fig. 5.
Figure 6
Figure 6. PN terminal photo-stimulation perturbs forelimb movement via a cerebellar-motor loop
a, Experimental design. b, Photo-stimulation reduced success in the multi-reach task (n = 5 ChR2, n = 4 control). c, Kinematics from a representative AAV-ChR2 mouse. See Extended Data Fig. 6a. d, Mean number of reach phase direction reversals increased during photo-stimulation. See Extended Data Table 2 and Extended Data Fig. 6 for statistical analysis. e, Intracellular recording from forelimb MNs during PN terminal photo-stimulation revealed EPSPs with varying onset (upper black traces, bars; 0.8 ms between first two arrowheads, 2.5 ms between first and third arrowheads; n =11). Cervical photo-stimulation of PN cell bodies produced shorter latency fixed onset EPSPs (lower black traces, bars; onset (arrowhead) 0.6 ms from volley in field (arrow); n = 3). Field potentials recorded in C6/C7 ventral horn (gray traces, gray bars) had similar onset and duration as MN EPSPs (n = 27, LRN-light; n = 8, C4-light). f, Bilateral lesion of inferior cerebellar peduncles (ICP; gray traces) or cerebellar extirpation (CB; red traces) reduced field potential size (mean reduction in area; 56% +/− 8.8% s.d.; P = 0.001; n = 5; two-tailed paired t-test). Shortest latency fields (~3.6 to 4.7 ms) were eliminated after lesions (histogram, scatter plot). Error bars indicate s.e.m.

Comment in

Similar articles

Cited by

References

    1. Iwaniuk AN, Whishaw IQ. On the origin of skilled forelimb movements. Trends Neurosci. 2000;23:372–376. doi:S0166-2236(00)01618-0 [pii] - PubMed
    1. Fitts PM. The information capacity of the human motor system in controlling the amplitude of movement. Journal of experimental psychology. 1954;47:381–391. - PubMed
    1. Morasso P. Spatial control of arm movements. Exp Brain Res. 1981;42:223–227. - PubMed
    1. Lawrence DG, Kuypers HG. The functional organization of the motor system in the monkey. I. The effects of bilateral pyramidal lesions. Brain : a journal of neurology. 1968;91:1–14. - PubMed
    1. Lawrence DG, Kuypers HG. The functional organization of the motor system in the monkey. II. The effects of lesions of the descending brain-stem pathways. Brain : a journal of neurology. 1968;91:15–36. - PubMed

Publication types