. 2014 Mar 6;507(7490):118-23.
doi: 10.1038/nature12951. Epub 2014 Feb 2.

Polarized release of T-cell-receptor-enriched microvesicles at the immunological synapse

Affiliations

Polarized release of T-cell-receptor-enriched microvesicles at the immunological synapse

Kaushik Choudhuri et al. Nature. .

Abstract

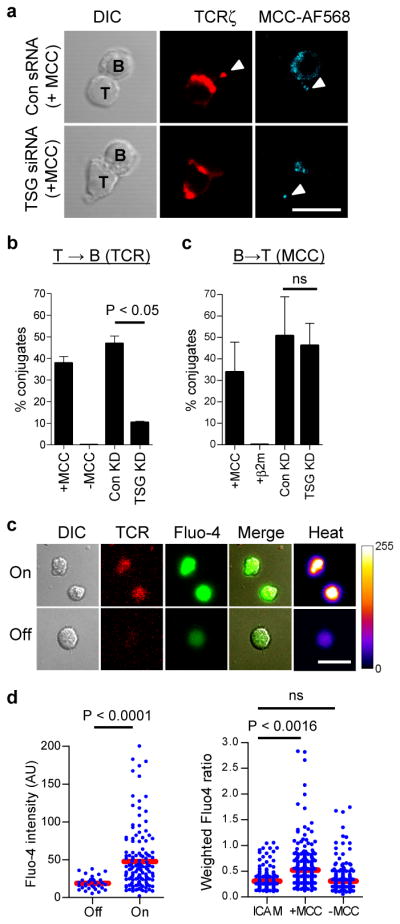
The recognition events that mediate adaptive cellular immunity and regulate antibody responses depend on intercellular contacts between T cells and antigen-presenting cells (APCs). T-cell signalling is initiated at these contacts when surface-expressed T-cell receptors (TCRs) recognize peptide fragments (antigens) of pathogens bound to major histocompatibility complex molecules (pMHC) on APCs. This, along with engagement of adhesion receptors, leads to the formation of a specialized junction between T cells and APCs, known as the immunological synapse, which mediates efficient delivery of effector molecules and intercellular signals across the synaptic cleft. T-cell recognition of pMHC and the adhesion ligand intercellular adhesion molecule-1 (ICAM-1) on supported planar bilayers recapitulates the domain organization of the immunological synapse, which is characterized by central accumulation of TCRs, adjacent to a secretory domain, both surrounded by an adhesive ring. Although accumulation of TCRs at the immunological synapse centre correlates with T-cell function, this domain is itself largely devoid of TCR signalling activity, and is characterized by an unexplained immobilization of TCR-pMHC complexes relative to the highly dynamic immunological synapse periphery. Here we show that centrally accumulated TCRs are located on the surface of extracellular microvesicles that bud at the immunological synapse centre. Tumour susceptibility gene 101 (TSG101) sorts TCRs for inclusion in microvesicles, whereas vacuolar protein sorting 4 (VPS4) mediates scission of microvesicles from the T-cell plasma membrane. The human immunodeficiency virus polyprotein Gag co-opts this process for budding of virus-like particles. B cells bearing cognate pMHC receive TCRs from T cells and initiate intracellular signals in response to isolated synaptic microvesicles. We conclude that the immunological synapse orchestrates TCR sorting and release in extracellular microvesicles. These microvesicles deliver transcellular signals across antigen-dependent synapses by engaging cognate pMHC on APCs.


Conflict of interest statement

Competing financial interests: The authors declare no competing financial interests.

Figures

Figure 1
Figure 1. Antigen-induced release of TCR-enriched microvesicles at the center of IS
a., b. Transmission electron micrographs of AND T cells interacting with supported lipid bilayers (SLB) containing ICAM-1, and the indicated pMHC (underlined). Inset, low magnification images of the same cells. Scale bar, 500 nm; inset scale bar, 2 μm; red arrowheads, extracellular microvesicles; white arrowheads, plasma membrane. c. A three-dimensional ultrastructural model of the IS center. The model was constructed from dual-axis tomograms of 4 serial sections of a single IS (numbered in d.). MVB, Multivesicular body; ILV, intraluminal vesicle; scale bar 250 nm. d. Model in c. with intracellular components and plasma membrane removed. Scale bar, 250 nm. e. Model in d. rotated 90° in the x-axis. Examples of an extracellular microvesicle (i), tethered vesicle (ii), and plasma membrane projection (iii) are indicated. Dotted lines, section boundaries; scale bar, 250 nm. f. Quantitation of microvesicle production by AND T cells in response to MCC/I-Ek (100 molec./ μm2) or the weak agonist K99A/I-Ek (100 molec./ μm2), or with additional costimulation provided by CD80 and CD48 on bilayers (200 molec./ μm2 for both). Microvesicle production by OTII T cells, in response to OVA/I-Ab pMHC ligand (100 molec./ μm2), was also measured. N is indicated above bars. Results are pooled from two independent experiments. g. Overlay of TCR (red) and F-actin (green) fluorescence in TIRFM images of the AND T cell IS. Scale bar, 3 μm. h. A three-dimensional model of the IS center constructed from an electron-tomogram of the first en face section of the cell interface in g.. T cell plasma membrane, green; microvesicles, orange. The model is overlayed on a slice of the segmented en face tomogram, and shown separately in i.. (scale bar in l., 500 nm., which also applies to h.–i. and m.–o.). Overlay of TCR (j.) and F-actin (k.) fluorescence in g., shown as a heat map, with the en face electron micrograph of the same cell. White dashed boxes and asterisk in g., j.–k. indicate the orientation of the IS center in relation to the tomogram and model overlays in h.–i., and l.–o.. l.–m (asterisk position indicated in i.). Overlay of microvesicles modeled in i. (white), scaled and aligned with the TCR fluorescence in j. (l.) and F-actin in k. (m.). n.–o. Overlay of the T cell plasma membrane in modeled in i. (white) scaled and aligned with the TCR fluorescence in j. (n.) and F-actin in k. (o.).
Figure 2
Figure 2. TCR-enriched microvesicles are post-signaling extracellular products of T cell activation that retain pMHC-binding competence
Optical-EM correlation of sessile AND T cells forming an IS in response to MCC/I-Ek and ICAM-1 (a.) and resuming motility (b.), showing the distributions of F-actin (green) and TCR (red) in relation to released microvesicles deposited on the bilayer (arrowheads). Scale bar 4 μm. c. Quantitation of phosphotyrosine (pY) fluorescence intensity in arbitrary units (AU) of released TCR-enriched microvesicles (V) and their originating cells (C) detected by indirect immunofluorescence labeling and TIRFM. d. Enrichment of fluorescently labeled cognate MCC/I-Ek or non-binding β2m/I-Ek by released TCR-enriched microvesicles. Fold pMHC enrichment is defined as: (pMHC fluorescence intensity colocalized with TCR-enriched microvesicles)/ (free bilayer pMHC fluorescence intensity). Error bars represent s.e.m.
Figure 3
Figure 3. Biogenesis of TCR-enriched microvesicles is mediated by ESCRT proteins and antagonized by HIV GAG
a. Optical-EM correlation of TCR and and MCC/I-Ek distributions of a representative AND T cell following siRNA-mediated TSG101 suppression. Scale bar 3 μm. b. Electron micrographs of en face sections of human CD4+ T cells forming IS in response to TCR engagement. Cells were transfected with a construct encoding dominant negative VPS4 fused to GFP (VPS4dn-GFP) or GFP only. Red boxes and arrowheads indicate regions imaged at higher magnification in right panels. Arrowheads in c. indicate nascent vesicles tethered to the plasma membrane. d. Quantitation of limiting membrane-tethered microvesicles expressed as a percentage of total microvesicles within central compartments of the IS in cells expressing indicated constructs. Means and s.d. are shown, P value is for Student’s t-test. N is indicated above data bars. Results are pooled from two independent experiments. e–g. Representative optical-EM correlation of the IS in human CD4+ T cells transfected with a construct encoding HIV GAG fused to GFP (GAG-GFP, green). Red, TCR; scale bar, 3 μm. e. T cell without central GAG-GFP accumulation resuming migration and releasing TCR-enriched microvesicles (arrowhead). f. T cell forming an IS with centrally accumulated GAG-GFP. g. T cell with centrally accumulated GAG-GFP resuming motility and releasing GAG-GFP-containing microvesicles (arrowheads). h. Higher magnification image of boxed region in g. showing internal juxta-membrane density in GAG-containing microvesicles. Arrowhead, plasma membrane; scale bar, 500 nm.
Figure 4
Figure 4. TSG101 selectively controls TCR transfer to B cells which signal in response to pMHC engagement by microvesicle-tethered TCR
a. Confocal microscopy of AND T cells, treated with TSG101 suppressing siRNA (TSG siRNA) or control oligo-RNA (Con sRNA), forming conjugates with congenic splenic B cells loaded with fluorescent MCC peptide (cyan). T = 30 min.; red, TCRζ; arrowheads, transferred TCR and fluorescent MCC peptide; scale bar, 10 μm. b. Quantitation of TCR transfer to B cells in T-B conjugates. c. Quantitation of MCC peptide transfer to T cells in T-B conjugates. Means from three independent experiments are shown in b.–c. error bars represent s.d. d. Live B cells loaded with calcium-sensitive fluorescent dye Fluo-4 were imaged by confocal microscopy on bilayers containing deposited TCR-enriched microvesicles (T = 30 min.). Panels show DIC and fluorescence images of TCR-enriched microvesicle patches on bilayers (red) and Fluo-4 fluorescence in B cells (green and heat map). Shown are examples of B cells interacting with TCR-containing microvesicles (On), or on bilayer areas without detectable TCR-enriched microvesicles (Off). Scale bar, 10 μm. e. Quantitation of Flou-4 fluorescence intensity of B cells ‘On’ or ‘Off’ TCR-enriched microvesicles. Data are representative of two experiments. f. Quantitation of Fluo-4 intensity of B cells pulsed with MCC peptide or without antigen, after 30 min incubation on bilayers containing ICAM-1 alone, or with bilayers containing deposited TCR-enriched microvesicles. Fluorescence values were divided by the mean Flou-4 intensity of B cells treated with 1 μM ionomycin at the end of the experiment. Data pooled from two independent experiments. Blue dots, fluorescence intensity in individual cells; red bars, sample mean; P value, one-way ANOVA corrected for all comparisons.

Similar articles

Cited by

References

    1. Lanzavecchia A. Antigen-specific interaction between T and B cells. Nature. 1985;314:537–9. - PubMed
    1. Stinchcombe JC, Majorovits E, Bossi G, Fuller S, Griffiths GM. Centrosome polarization delivers secretory granules to the immunological synapse. Nature. 2006;443:462–5. - PubMed
    1. Monks CR, Freiberg BA, Kupfer H, Sciaky N, Kupfer A. Three-dimensional segregation of supramolecular activation clusters in T cells. Nature. 1998;395:82–6. - PubMed
    1. Grakoui A, et al. The immunological synapse: a molecular machine controlling T cell activation. Science. 1999;285:221–7. - PubMed
    1. Varma R, Campi G, Yokosuka T, Saito T, Dustin ML. T cell receptor-proximal signals are sustained in peripheral microclusters and terminated in the central supramolecular activation cluster. Immunity. 2006;25:117–27. - PMC - PubMed

Publication types

MeSH terms

Substances