

Epigenetic modification and inheritance in sexual reversal of fish
- PMID: 24487721
- PMCID: PMC3975060
- DOI: 10.1101/gr.162172.113
Epigenetic modification and inheritance in sexual reversal of fish
Abstract
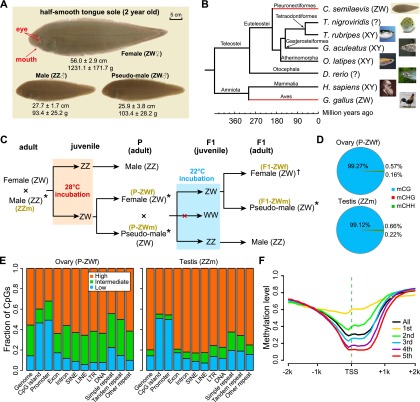
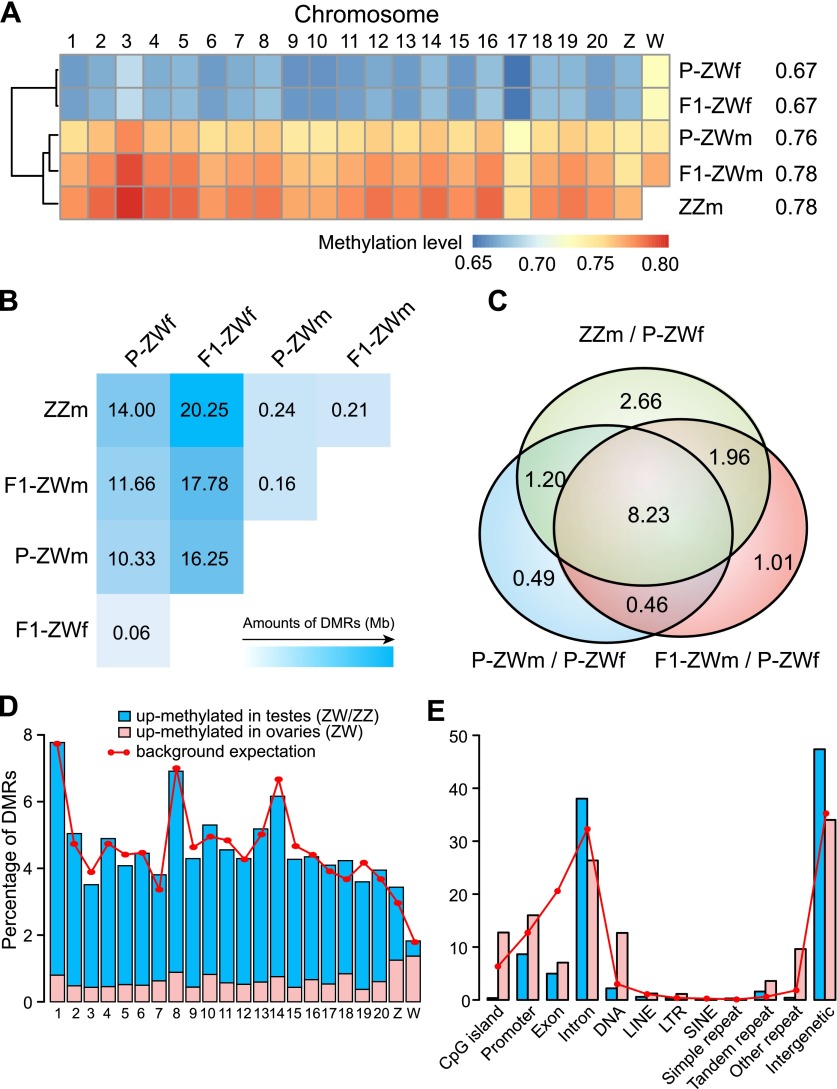
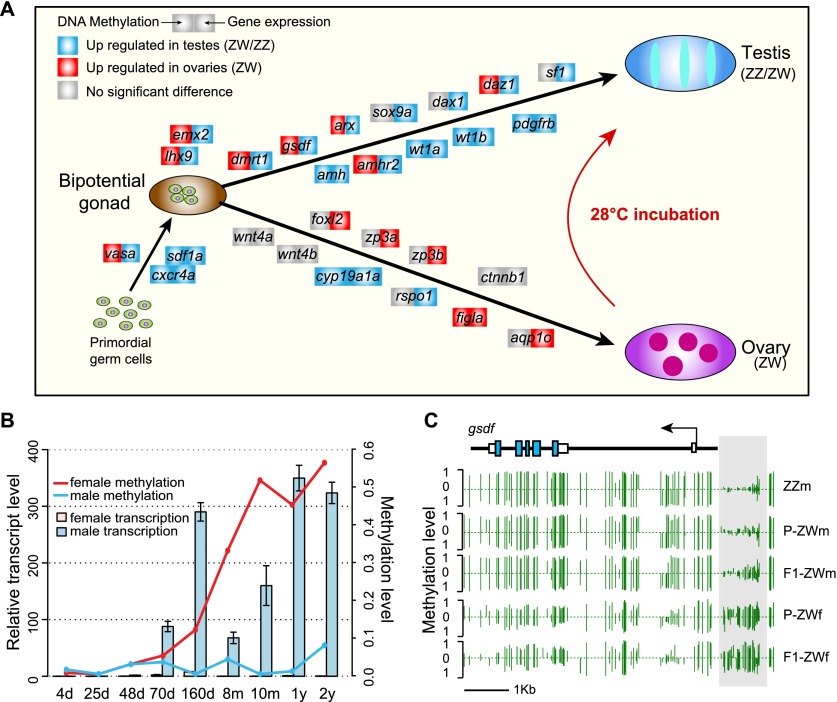
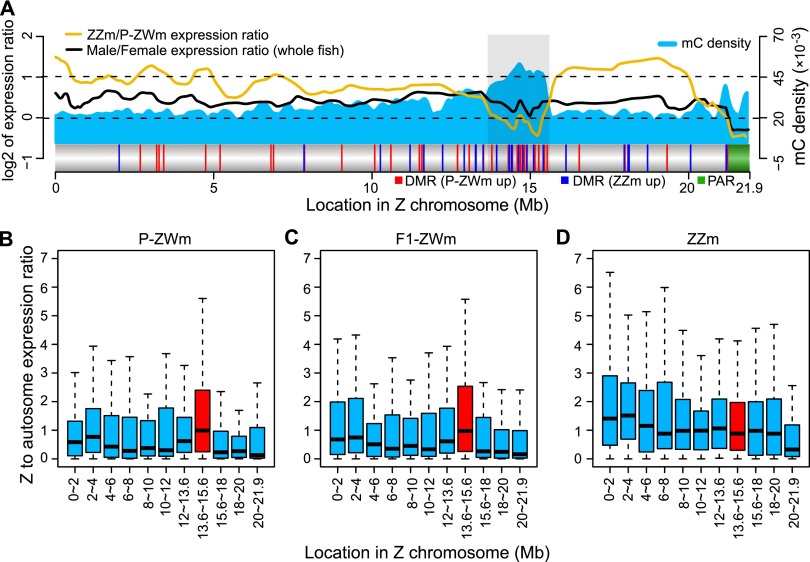
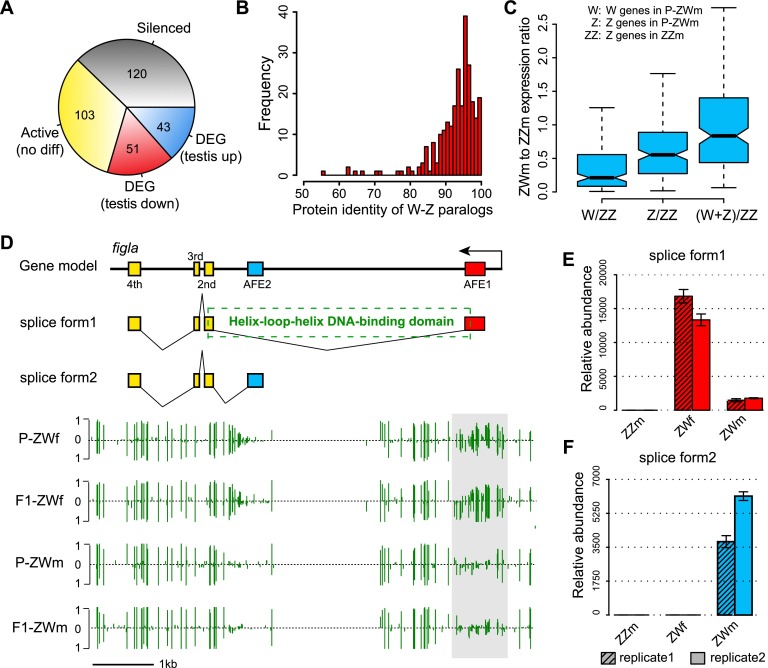
Environmental sex determination (ESD) occurs in divergent, phylogenetically unrelated taxa, and in some species, co-occurs with genetic sex determination (GSD) mechanisms. Although epigenetic regulation in response to environmental effects has long been proposed to be associated with ESD, a systemic analysis on epigenetic regulation of ESD is still lacking. Using half-smooth tongue sole (Cynoglossus semilaevis) as a model-a marine fish that has both ZW chromosomal GSD and temperature-dependent ESD-we investigated the role of DNA methylation in transition from GSD to ESD. Comparative analysis of the gonadal DNA methylomes of pseudomale, female, and normal male fish revealed that genes in the sex determination pathways are the major targets of substantial methylation modification during sexual reversal. Methylation modification in pseudomales is globally inherited in their ZW offspring, which can naturally develop into pseudomales without temperature incubation. Transcriptome analysis revealed that dosage compensation occurs in a restricted, methylated cytosine enriched Z chromosomal region in pseudomale testes, achieving equal expression level in normal male testes. In contrast, female-specific W chromosomal genes are suppressed in pseudomales by methylation regulation. We conclude that epigenetic regulation plays multiple crucial roles in sexual reversal of tongue sole fish. We also offer the first clues on the mechanisms behind gene dosage balancing in an organism that undergoes sexual reversal. Finally, we suggest a causal link between the bias sex chromosome assortment in the offspring of a pseudomale family and the transgenerational epigenetic inheritance of sexual reversal in tongue sole fish.
Figures
Similar articles
-
Single Locus Maintains Large Variation of Sex Reversal in Half-Smooth Tongue Sole (Cynoglossus semilaevis).G3 (Bethesda). 2017 Feb 9;7(2):583-589. doi: 10.1534/g3.116.036822. G3 (Bethesda). 2017. PMID: 28007836 Free PMC article.
-
Induction of mitogynogenetic diploids and identification of WW super-female using sex-specific SSR markers in half-smooth tongue sole (Cynoglossus semilaevis).Mar Biotechnol (NY). 2012 Feb;14(1):120-8. doi: 10.1007/s10126-011-9395-2. Epub 2011 Jul 8. Mar Biotechnol (NY). 2012. PMID: 21735350
-
Expression pattern and functional analysis of R-spondin1 in tongue sole Cynoglossus semilaevis.Gene. 2018 Feb 5;642:453-460. doi: 10.1016/j.gene.2017.11.047. Epub 2017 Nov 16. Gene. 2018. PMID: 29155330
-
Do the Offspring of Sex Reversals Have Higher Sensitivity to Environmental Perturbations?Sex Dev. 2021;15(1-3):134-147. doi: 10.1159/000515192. Epub 2021 Apr 28. Sex Dev. 2021. PMID: 33910195 Review.
-
What was the ancestral sex-determining mechanism in amniote vertebrates?Biol Rev Camb Philos Soc. 2016 Feb;91(1):1-12. doi: 10.1111/brv.12156. Epub 2014 Nov 25. Biol Rev Camb Philos Soc. 2016. PMID: 25424152 Review.
Cited by
-
Origin and chromatin remodeling of young X/Y sex chromosomes in catfish with sexual plasticity.Natl Sci Rev. 2022 Oct 28;10(2):nwac239. doi: 10.1093/nsr/nwac239. eCollection 2023 Feb. Natl Sci Rev. 2022. PMID: 36846302 Free PMC article.
-
Dynamic epimarks in sex-related genes predict gonad phenotype in the European sea bass, a fish with mixed genetic and environmental sex determination.Epigenetics. 2018;13(9):988-1011. doi: 10.1080/15592294.2018.1529504. Epub 2018 Oct 23. Epigenetics. 2018. PMID: 30265213 Free PMC article.
-
Sex-specific dmrt1 and cyp19a1 methylation and alternative splicing in gonads of the protandrous hermaphrodite barramundi.PLoS One. 2018 Sep 18;13(9):e0204182. doi: 10.1371/journal.pone.0204182. eCollection 2018. PLoS One. 2018. PMID: 30226860 Free PMC article.
-
Gonad Transcriptome Analysis of High-Temperature-Treated Females and High-Temperature-Induced Sex-Reversed Neomales in Nile Tilapia.Int J Mol Sci. 2018 Feb 28;19(3):689. doi: 10.3390/ijms19030689. Int J Mol Sci. 2018. PMID: 29495590 Free PMC article.
-
Three Copies of zbed1 Specific in Chromosome W Are Essential for Female-Biased Sexual Size Dimorphism in Cynoglossus semilaevis.Biology (Basel). 2024 Feb 23;13(3):141. doi: 10.3390/biology13030141. Biology (Basel). 2024. PMID: 38534411 Free PMC article.
References
-
- Bayne RAL, Martins da Silva SJ, Anderson RA 2004. Increased expression of the FIGLA transcription factor is associated with primordial follicle formation in the human fetal ovary. Mol Hum Reprod 10: 373–381 - PubMed
-
- Beißbarth T, Speed TP 2004. GOstat: Find statistically overrepresented Gene Ontologies within a group of genes. Bioinformatics 20: 1464–1465 - PubMed
-
- Benjamini Y, Drai D, Elmer G, Kafkafi N, Golani I 2001. Controlling the false discovery rate in behavior genetics research. Behav Brain Res 125: 279–284 - PubMed
Publication types
MeSH terms
Associated data
- Actions
LinkOut - more resources
Full Text Sources
Other Literature Sources
Molecular Biology Databases
Miscellaneous