. 2014 Apr;25(3-4):95-108.
doi: 10.1007/s00335-013-9499-2. Epub 2014 Feb 1.

The Collaborative Cross as a resource for modeling human disease: CC011/Unc, a new mouse model for spontaneous colitis

Affiliations

The Collaborative Cross as a resource for modeling human disease: CC011/Unc, a new mouse model for spontaneous colitis

Allison R Rogala et al. Mamm Genome. 2014 Apr.

Abstract

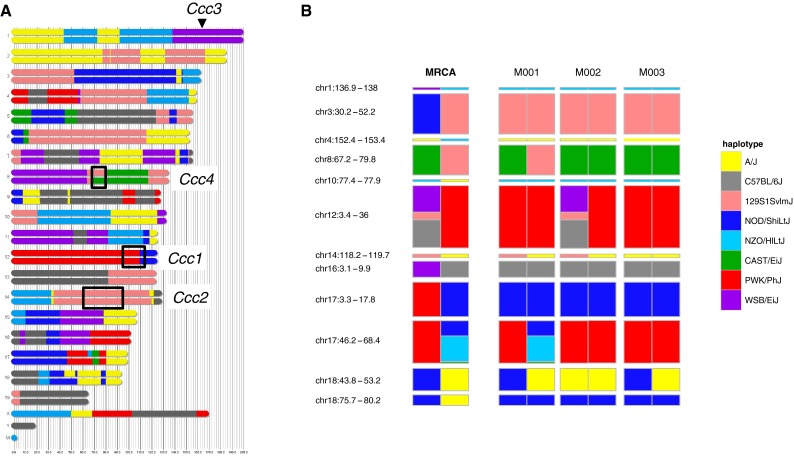
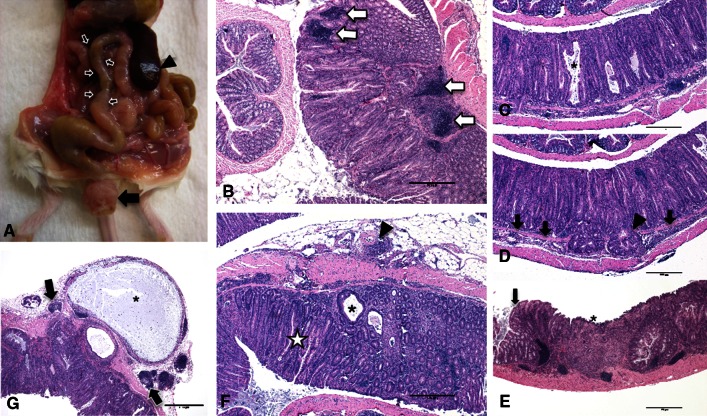
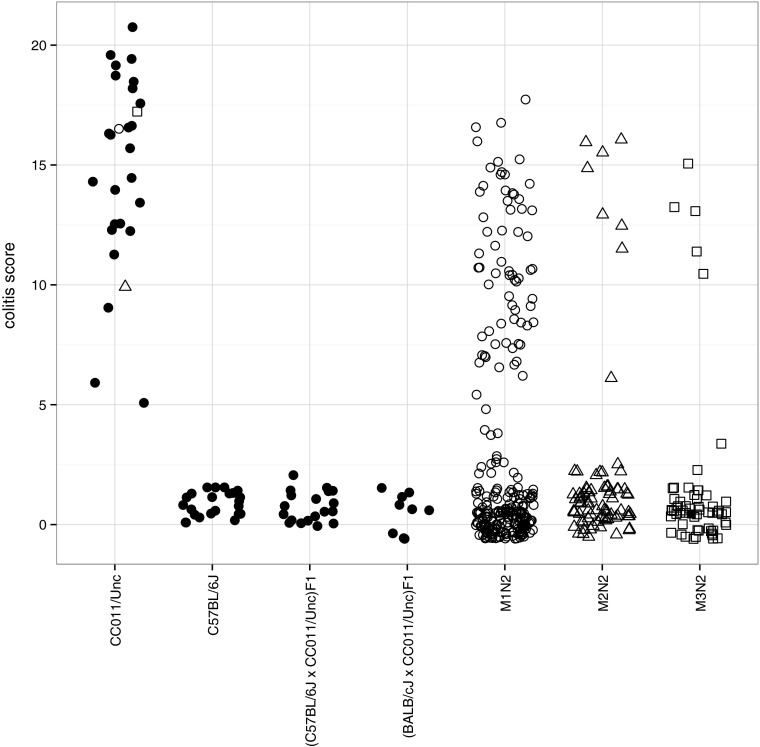
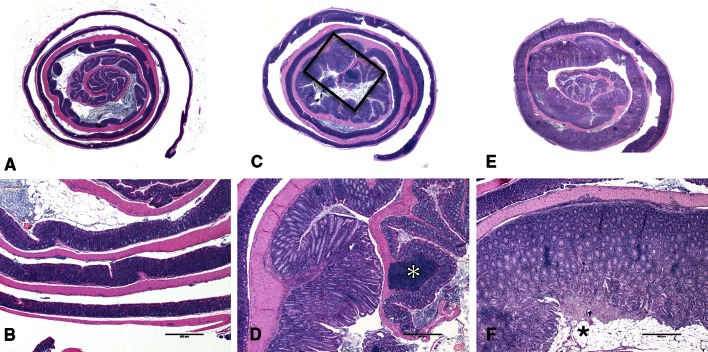
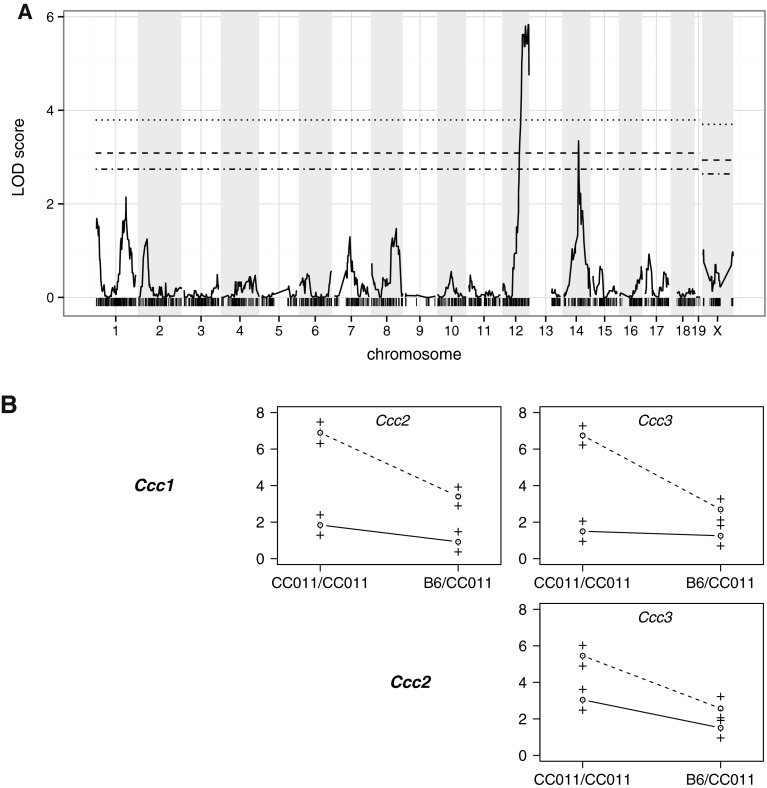
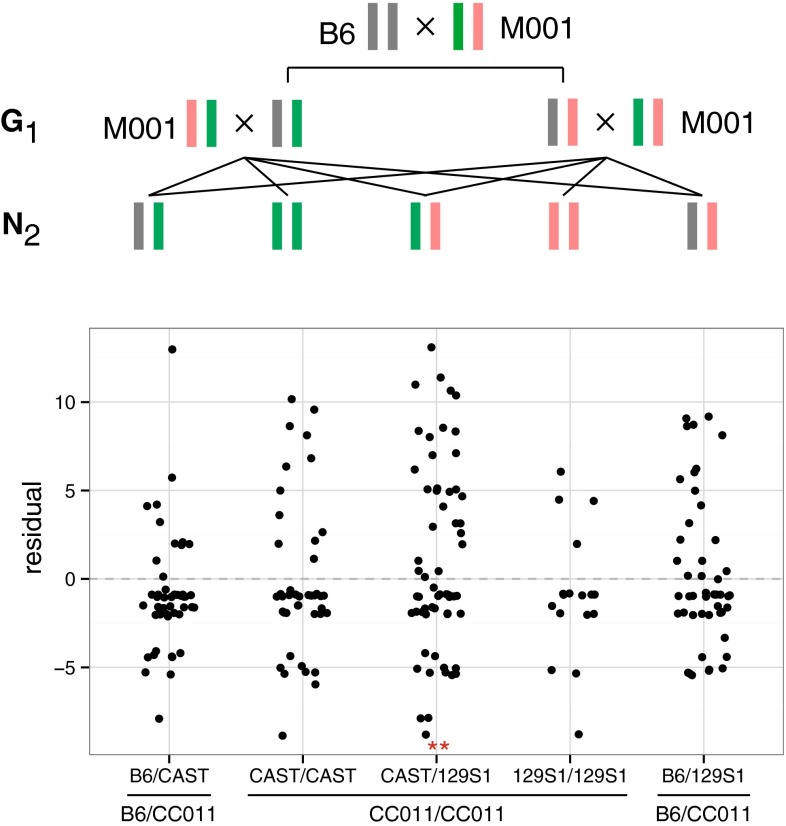
Inflammatory bowel disease (IBD) is an immune-mediated condition driven by improper responses to intestinal microflora in the context of environmental and genetic background. GWAS in humans have identified many loci associated with IBD, but animal models are valuable for dissecting the underlying molecular mechanisms, characterizing environmental and genetic contributions and developing treatments. Mouse models rely on interventions such as chemical treatment or introduction of an infectious agent to induce disease. Here, we describe a new model for IBD in which the disease develops spontaneously in 20-week-old mice in the absence of known murine pathogens. The model is part of the Collaborative Cross and came to our attention due to a high incidence of rectal prolapse in an incompletely inbred line. Necropsies revealed a profound proliferative colitis with variable degrees of ulceration and vasculitis, splenomegaly and enlarged mesenteric lymph nodes with no discernible anomalies of other organ systems. Phenotypic characterization of the CC011/Unc mice with homozygosity ranging from 94.1 to 99.8% suggested that the trait was fixed and acted recessively in crosses to the colitis-resistant C57BL/6J inbred strain. Using a QTL approach, we identified four loci, Ccc1, Ccc2, Ccc3 and Ccc4 on chromosomes 12, 14, 1 and 8 that collectively explain 27.7% of the phenotypic variation. Surprisingly, we also found that minute levels of residual heterozygosity in CC011/Unc have significant impact on the phenotype. This work demonstrates the utility of the CC as a source of models of human disease that arises through new combinations of alleles at susceptibility loci.


Figures

Fig. 1
Fig. 1
Pedigree of the CC011/Unc strain. Partial pedigree of the CC011/Unc strain including all phenotyped mice and their most recent common ancestors. Affected individuals with asterisks denote mice subject to full veterinary evaluation and pathogen analysis. Affected individuals with an open circle denote mice phenotyped using the “roll” method as described in the text. Most recent common ancestors (MRCA) of the CC011/Unc strain are indicated
Fig. 2
Fig. 2
Founder haplotype contributions to CC011/Unc strain. a Genome mosaic of male M001. Colors denote the contribution of each founder strain according to the key to the right of the figure. Black boxes span the QTL identified in this study, Ccc1, Ccc2 and Ccc4, while the arrowhead indicates the maximum peak at the third QTL, Ccc3. b Twelve intervals of residual heterozygosity in the CC011/Unc strain. Phased local haplotypes for the MRCA and the sires of the N2 population (M001, M002 and M003) are shown. The vertical widths of the intervals are to scale. Note M001, M002 and M003 have each fixed an allele for a different subset of the heterozygous regions
Fig. 3
Fig. 3
Gross and histologic lesions associated with colitis in CC011/Unc strain. a Gross necropsy of 20-week-old mouse. Note the enlarged spleen (arrowhead), thickened proximal colon (small arrows), relative lack of abdominal fat, and rectal prolapse (large arrow). b Focal colitis on transverse colonic fold (right) contrasted with unaffected transverse colonic fold in same histologic section (left). The abnormal mucosa exhibits marked hyperplasia with glands approximately 2.5–3× normal height, increased glandular tortuosity, loss of mucous-producing cells, and numerous lymphoid aggregates (arrows) and leukocytic infiltrate within both the lamina propria and the submucosa. c Proliferative colitis with numerous mucinous lakes (asterisk). d Proliferative colitis with submucosal herniation of the mucosal glands (arrowhead) through the muscularis mucosa (denoted by arrows). e Ulceration (asterisk) and focal colitis. The arrow denotes the region of demarcation between normal tissue (left) and the affected tissue. f Section from mouse with diffuse colitis depicting marked periarteritis (arrowhead), severe inflammation throughout the submucosa and lamina propria, marked glandular hypertrophy with significant reduction in the number of mucous cells (star), and mucinous lakes (asterisk). g Large mucinous serosal cyst (asterisk) with small reactive mesenteric lymph nodes on both sides (arrows)
Fig. 4
Fig. 4
Colitis severity distribution in CC011/Unc, C57BL/6J, F1 and N2 progeny. Colitis score (y-axis) represents the sum of scores for seven components of the phenotype and ranges from 0 (no disease) to 21 (maximal disease). Each point represents one animal; open circles, animals which were scored for the phenotype and genotyped for genetic mapping, and closed circles, animals which were phenotyped but not genotyped. The CC011/Unc sires of the three groups of N2 progeny (M1N2, M2N2 and M3N2) mice are indicated with an open circle, triangle and square, respectively. Points are jittered in both vertical and horizontal directions for legibility
Fig. 5
Fig. 5
Range of histologic colitis in N2 mice. Photographs in the top row depict colon rolls at 1× magnification, while the bottom row depicts colons at a higher magnification. a An unaffected colon with a colitis score of zero paired with (b), a magnified region of the same colon. Note the uniformity and normal height of the mucosal glands as compared to the abnormal glands in (d) and (f). c A mildly affected colon (colitis score = 7) with a relatively focally affected region. The black rectangle outlines the region magnified in (d). Note the focal hyperplasia, decreased mucous cell population and inflammatory infiltrate within the lamina propria and submucosa. A large lymphoid aggregate appears on a proximal fold (white asterisk). e, f Represent severely affected colons (colitis score = 18). The entire length of the colon is diffusely thickened and inflamed (e). At higher magnification (f), severe hyperplasia, inflammatory infiltrate and superficial ulceration (asterisk) are evident
Fig. 6
Fig. 6
QTL scan for colitis score under single-locus model. a LOD score profile (n = 111 mice). Significance thresholds (dashed-dotted line, α = 0.10; dashed line, α = 0.05; α = 0.01) were derived from 1,000 permutations of the genotypes, performed separately for the autosomes and for the X chromosome. Vertical hashes along abscissa represent marker positions. b Allele-effect plots for pairs of colitis QTL (n = 257 mice). Phenotype means (+/− standard error) among individuals homozygous for the CC011/Unc allele (CC011/CC011) or heterozygous for the C57BL/6J and CC011/Unc alleles (B6/CC011) at the QTL peak indicated in the top of each cell are plotted according to their genotype (dotted line homozygous, solid line heterozygous) at the QTL peak indicated to the left of each row. Parallel lines are indicative of purely additive effects between loci, while convergent or crossing lines suggest epistasis
Fig. 7
Fig. 7
Relationship of residual heterozygosity in CC011/Unc to variability in colitis phenotype in N2 progeny. The sire (M001) of the 257 N2 progeny used for QTL mapping is segregating for the CAST/EiJ (CAST; green) and 129S1/SvImJ (129S1; pink) haplotypes at the Ccc4 locus. The G1 progeny of a C57BL/6J (B6; gray) female and M001 forms two classes based on their diplotype at this locus: B6/CAST (left) and B6/129S1 (right). Four classes of N2 progeny can arise from each class of G1, of which three are shared. These classes are represented as color-coded chromosome segments in the upper panel. The outer two classes are treated as heterozygous (B6/CC011) for QTL mapping, while the inner three classes are nominally homozygous (CC011/CC011). The lower panel plots the residuals from the full three-QTL model (additive effects of Ccc1, Ccc2 and Ccc3 plus the Ccc1 × Ccc3 interaction) according to diplotype at Ccc4 for all n = 257 M1N2 mice genotyped. Addition of diplotype at Ccc4 to the regression model is significant only for the CAST/129S1 class (t = 2.185 on 1 df; p = 0.0298**). Presence of the CAST/129S1 diplotype at this locus adds 2.3 (95 % confidence interval 0.2, 4.4) points to colitis score

References

    1. Aylor DL, Valdar W, Foulds-Mathes W, Buus RJ, Verdugo RA, Baric RS, Ferris MT, Frelinger JA, Heise M, Frieman MB, Gralinski LE, Bell TA, Didion JD, Hua K, Nehrenberg DL, Powell CL, Steigerwalt J, Xie Y, Kelada SN, Collins FS, Yang IV, Schwartz DA, Branstetter LA, Chesler EJ, Miller DR, Spence J, Liu EY, McMillan L, Sarkar A, Wang J, Wang W, Zhang Q, Broman KW, Korstanje R, Durrant C, Mott R, Iraqi FA, Pomp D, Threadgill D, de Villena FP, Churchill GA. Genetic analysis of complex traits in the emerging Collaborative Cross. Genome Res. 2011;21:1213–1222. doi: 10.1101/gr.111310.110. - DOI - PMC - PubMed
    1. Bleich A, Büchler G, Beckwith J, Petell LM, Affourtit JP, King BL, Shaffer DJ, Roopenian DC, Hedrich HJ, Sundberg JP, Leiter EH. Cdcs1 a major colitis susceptibility locus in mice; Subcongenic analysis reveals genetic complexity. Inflamm Bowel Dis. 2010;16:765–775. doi: 10.1002/ibd.21146. - DOI - PMC - PubMed
    1. Borm ME, He J, Kelsall B, Pena AS, Strober W, Bouma G. A major quantitative trait locus on mouse chromosome 3 is involved in disease susceptibility in different colitis models. Gastroenterology. 2005;128:74–85. doi: 10.1053/j.gastro.2004.10.044. - DOI - PubMed
    1. Bottomly D, Ferris MT, Aicher LD, Rosenzweig E, Whitmore A, Aylor DL, Haagmans BL, Gralinski LE, Bradel-Tretheway BG, Bryan JT, Threadgill DW, de Villena FP, Baric RS, Katze MG, Heise M, McWeeney SK. Expression quantitative trait Loci for extreme host response to influenza a in pre-collaborative cross mice. G3: Genes Genomes Genetics. 2012;2:213–221. doi: 10.1534/g3.111.001800. - DOI - PMC - PubMed
    1. Boulard O, Kirchberger S, Royston DJ, Maloy KJ, Powrie FM. Identification of a genetic locus controlling bacteria-driven colitis and associated cancer through effects on innate inflammation. J Exp Med. 2012;209:1309–1324. doi: 10.1084/jem.20120239. - DOI - PMC - PubMed

Publication types

LinkOut - more resources