. 2015 Jan 29;34(5):558-67.
doi: 10.1038/onc.2013.590. Epub 2014 Feb 3.

EphA2 promotes infiltrative invasion of glioma stem cells in vivo through cross-talk with Akt and regulates stem cell properties

Affiliations

EphA2 promotes infiltrative invasion of glioma stem cells in vivo through cross-talk with Akt and regulates stem cell properties

H Miao et al. Oncogene. .

Abstract

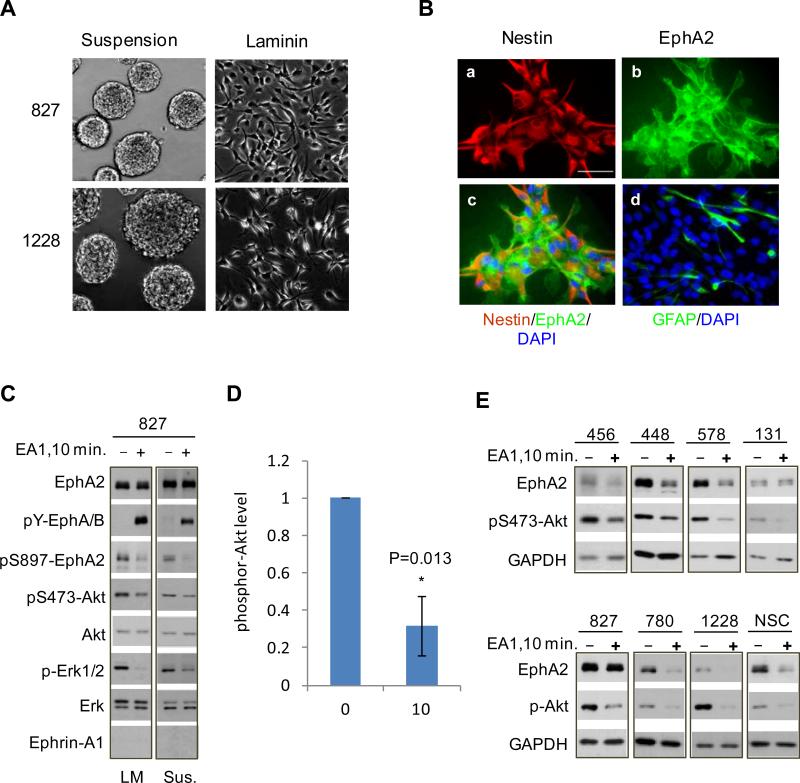
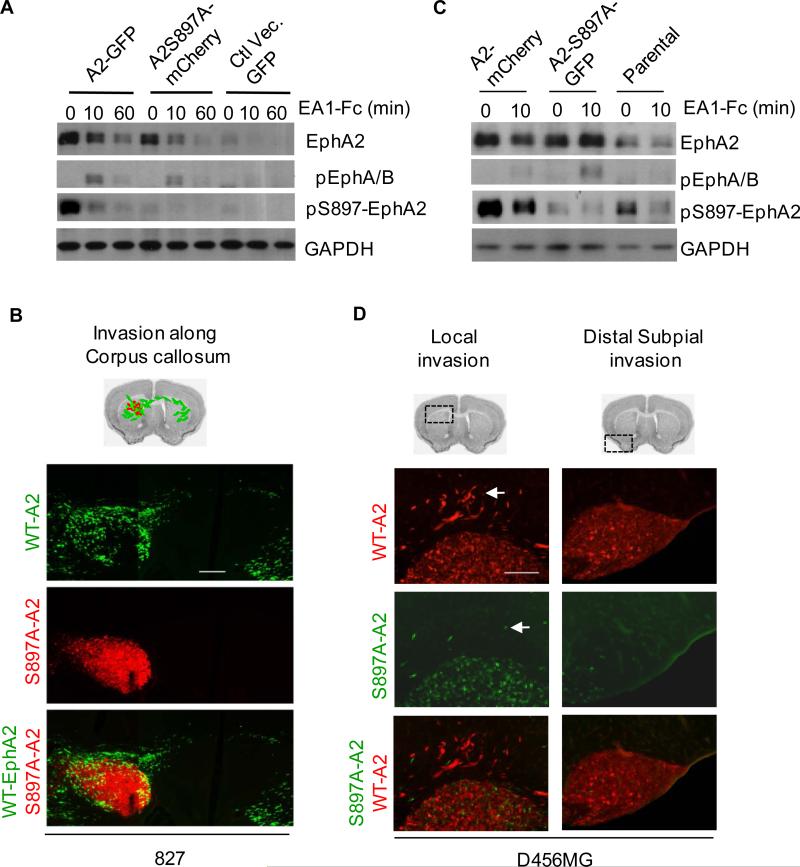
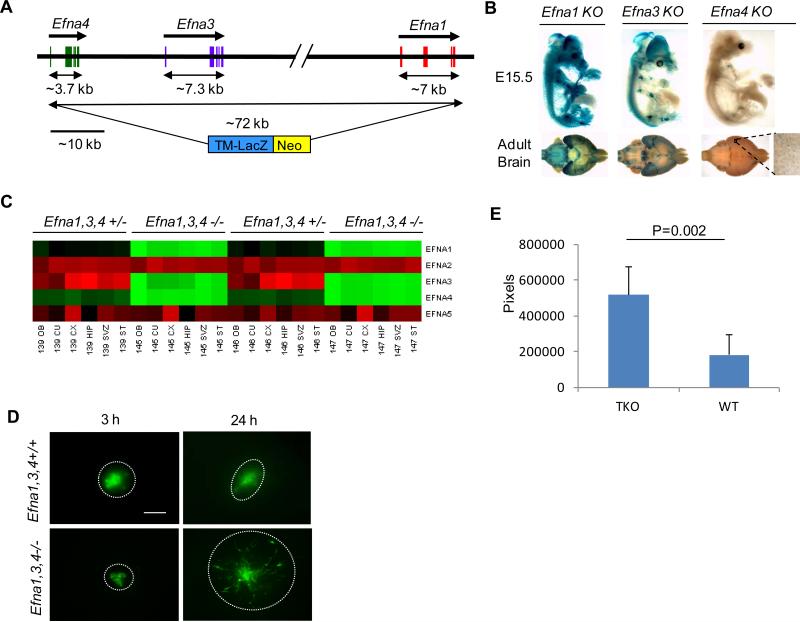
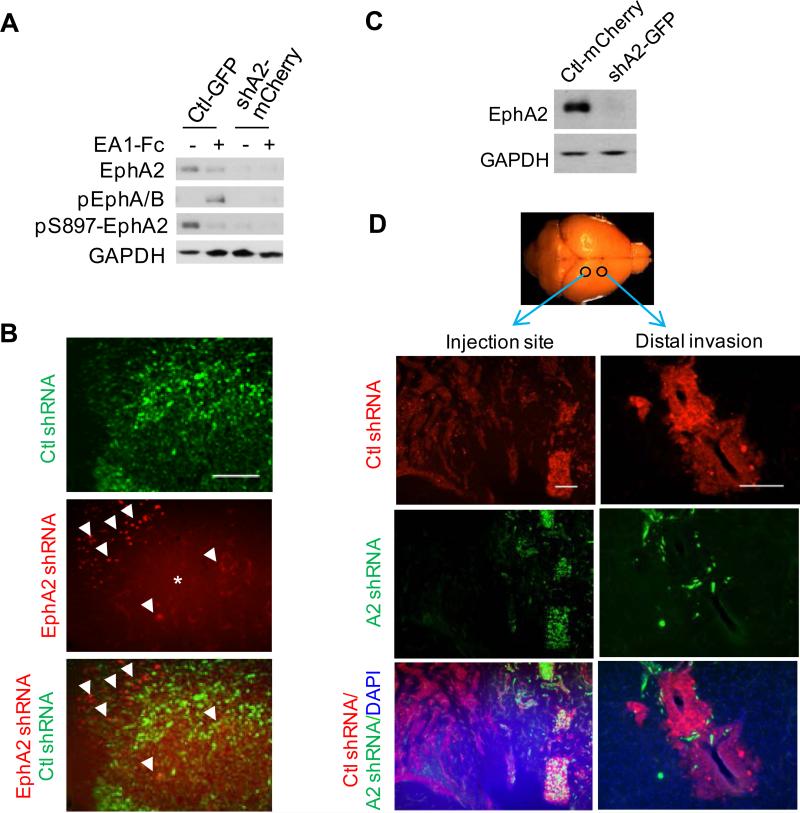
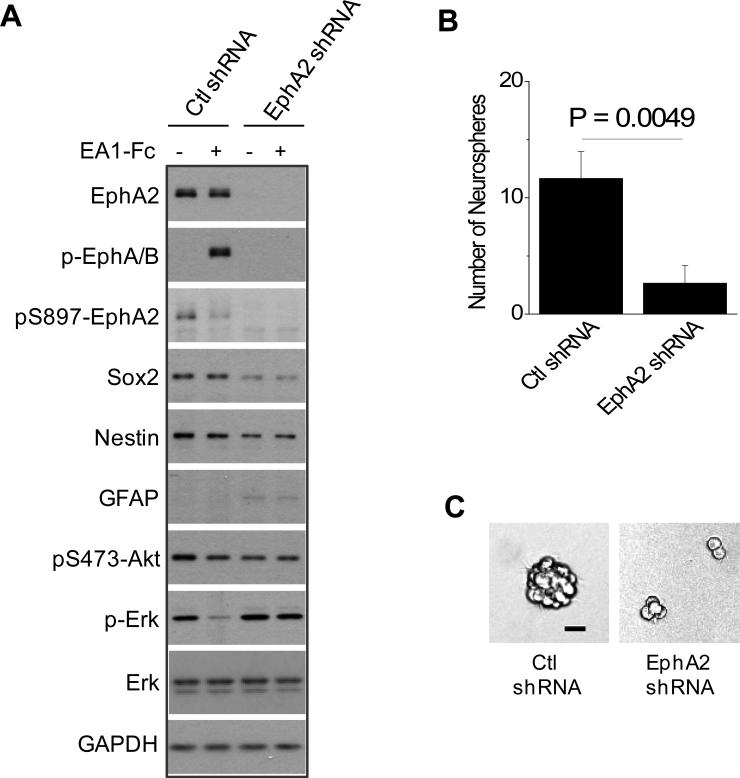
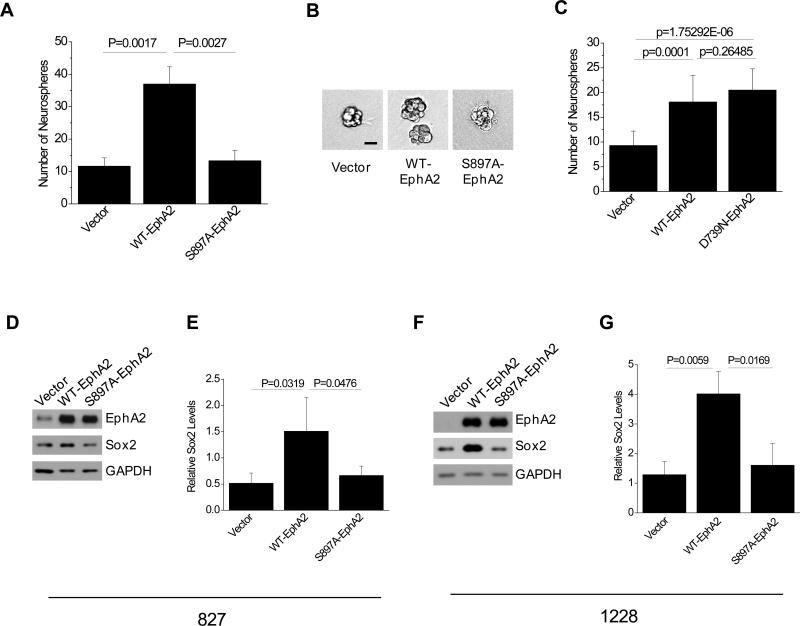
Diffuse infiltrative invasion is a major cause for the dismal prognosis of glioblastoma multiforme (GBM), but the underlying mechanisms remain incompletely understood. Using human glioma stem cells (GSCs) that recapitulate the invasive propensity of primary GBM, we find that EphA2 critically regulates GBM invasion in vivo. EphA2 was expressed in all seven GSC lines examined, and overexpression of EphA2 enhanced intracranial invasion. The effects required Akt-mediated phosphorylation of EphA2 on serine 897. In vitro the Akt-EphA2 signaling axis is maintained in the absence of ephrin-A ligands and is disrupted upon ligand stimulation. To test whether ephrin-As in tumor microenvironment can regulate GSC invasion, the newly established Efna1;Efna3;Efna4 triple knockout mice (TKO) were used in an ex vivo brain slice invasion assay. We observed significantly increased GSC invasion through the brain slices of TKO mice relative to wild-type (WT) littermates. Mechanistically EphA2 knockdown suppressed stem cell properties of GSCs, causing diminished self-renewal, reduced stem marker expression and decreased tumorigenicity. In a subset of GSCs, the reduced stem cell properties were associated with lower Sox2 expression. Overexpression of EphA2 promoted stem cell properties in a kinase-independent manner and increased Sox2 expression. Disruption of Akt-EphA2 cross-talk attenuated stem cell marker expression and neurosphere formation while having minimal effects on tumorigenesis. Taken together, the results show that EphA2 endows invasiveness of GSCs in vivo in cooperation with Akt and regulates glioma stem cell properties.


Figures

Figure 1
Figure 1
EphA2 is expressed in glioma stem cells (GSCs) and is phosphorylated on S897. (A) Phase images of GSCs cultured in suspension or on laminin-coated surface. (B) The 827 line of GSCs were cultured on laminin and subjected to immunofluorescence analysis for Nestin (a) and EphA2 (b), which were merged with DAPI in (c). (d) A fraction of GSCs also express GFAP, a differentiation marker. Scale bar, 50 μm. (C) EphA2 in GSCs was phosphorylated on S897 in the absence of ligand stimulation. Ephrin-A1 treatment led to EphA2 activation, and inhibition of Akt and pS897-EphA2. GSCs cultured on laminin (LM) or in suspension (Sus.) were stimulated with ephrin-A1-Fc and lysed. Whole cell lysates were subjected to immunoblot with the indicated antibodies. (D) Quantitative densitometry analysis shows significant Akt inhibition by the ligand-activated EphA2. Data from 4 independent experiments were analyzed. (E) EphA2 receptor is expressed in NSCs and 7 independent preparations of GSCs, and mediates Akt inhibition when stimulated with ephrin-A1 ligand.
Figure 2
Figure 2
Disruption of Akt-EphA2 signaling axis inhibits the infiltrative invasion of GSCs in vivo. A) Characterization of 827 GSCs expressing WT- or S897A-EphA2. 827 cells were sequentially infected first with WT- or S897A-EphA2 retroviral vectors and then with lentiviral vectors expressing eGFP or mCherry. Empty pBabe vector-infected cells tagged with GFP were used as controls. The cells were stimulated with ephrin-A1-Fc and blotted with the indicated antibodies. B) Direct comparison of intracranial invasiveness of WT- vs. S897A-EphA2-expressing 827 cells after co-injection at 1:1 ratio. A representative section shows reduced invasion by S897A-EphA2-mCherry cells (red) compared WT-EphA2-eGFP cells (green). C) Characterization of D456MG GSCs expressing WT- or S897A-EphA2 that were generated following similar strategies as in (A). D) Direct comparison of intracranial invasiveness of WT- vs. S897A-EphA2-expressing D456MG cells after co-injection at 1:1 ratio. S897A mutation significantly reduced invasion both locally (left panels) and distally (right panels). Scale bar, 200 μm. The experiments were performed three times using 6 animals each group. Data from representative experiments are shown.
Figure 3
Figure 3
Establishment of Efna1/Efna3/Efna4 triple knockout (TKO) mice and accelerated ex vivo invasion of GSCs through the mutant brain slices. (A) Schematic illustration depicting the strategies for generating Efna1/Efna3/Efna4 knockout mouse. Note that the 3 Efna genes are localized to a short region that is deleted to generate TKO mice. (B) X-gal staining of E15.5 or adult mouse brains from individual Efna knockout mice. (C) RT-PCR analysis of Efna1-5 gene expression in different regions of the heterozygous or homozygous Efna1,3,4 knockout mice. OB, olfactory bulb; CU, cerebellum; CX, cortex; SVZ, subventricular zone; ST, striatum. (D) Brain slices were prepared from neonatal littermates either wild type or homozygous knockout for Efna1/Efna3/Efna4. The 827 GSCs were tagged with eGFP and implanted in the cortical region near the corpus callosum. Invasion of GSCs was monitored under epifluorescent microscope. Images were collected at the indicated times. Scale bar, 300 μm. (E) Quantitative analyses of ex vivo invasion assays shown in (D). Total areas covered by the invading GSCs at 3 and 24 hours were measured. The net increases in areas from 3 to 24 hours were compared between the WT and TKO brain slices (n=7) using student t test.
Figure 4
Figure 4
Knocking down EphA2 expression in 827 cells inhibits in vivo tumor development and reduces expression of stem markers. (A) 827 cells expressing control vector or EphA2 shRNA were tagged with eGFP or mCherry by lentiviral infection, and analyzed by immunoblot with the indicated antibodies. (B) Co-injection of the two cell types are described as in Fig. 2. A representative brain section shows a significantly reduced tumor development by EphA2 shRNA-expressing 827 cells (Arrow heads point to the mCherry-tagged tumor cells; star indicates the background fluorescence signal common in mouse brain.) compared with control cells. (C) Silencing EphA2 expression in D456MG cells inhibit the invasion in vivo. D456MG cells were infected with lentivirus expressing control or EphA2 shRNA and then tagged with mCherry or eGFP, respectively. Immunoblot verified the knockdown. (D) Equal number of the two types of cells were mixed and injected as in Fig. 2A. Mice were sacrificed one month later and consecutive sections were prepared from each brain. Scale bars, 200 μm. The experiments were performed three times using 6 animals each group. Data from representative experiments are shown.
Figure 5
Figure 5
(A) Knocking down EphA2 in GSCs significantly reduced the expression of stem cell markers including Sox2 and nestin, and induced the expression of differentiation marker GFAP. 827 cells expressing control vector or EphA2 shRNA were stimulated with ephrin-A1-Fc, lysed, and blotted with the indicated antibodies. (B-C) EphA2 is required for the self-renewal of GSCs. One hundred cells were seeded in triplicates in the 6-well ultra-low adhesive plates. The number of neurospheres was counted (B) and representative images (C) were taken 4 days after plating. Scale bar, 25 μm.
Figure 6
Figure 6
EphA2 promotes GSC self-renewal and regulates Sox2 expression through crosstalk with Akt. (A-B) Promotion of GSCs renewal requires S897 phosphorylation. One hundred 827 GSCs infected with the indicated retrovirus were seeded in triplicates in the 6-well ultra-low adhesive plates. The number of neurospheres was counted (A) and representative images (B) were taken 4 days after plating. Scale bar, 25 μm. (C) Both WT- and kinase dead (D739N) EphA2 are capable of promoting neurosphere formation in 827 cells. (D-G) Overexpression of WT- but not S897A-EphA2 increases Sox expression levels in 827 (D,E) and 1228 cells (F,G). Whole cell lysates were prepared from cells cultured on laminin or in suspension and analyzed by immunoblot with the indicated antibodies (D, F). Relative Sox2 levels were determined by normalizing the signal intensity to that of GAPDH. Values represent mean value ± s.d. from three independent experiments (E,G).

Similar articles

Cited by

References

    1. Furnari FB, Fenton T, Bachoo RM, Mukasa A, Stommel JM, Stegh A, et al. Malignant astrocytic glioma: genetics, biology, and paths to treatment. Genes Dev. 2007 Nov 1;21(21):2683–710. - PubMed
    1. Stupp R, Hegi ME, Mason WP, van den Bent MJ, Taphoorn MJ, Janzer RC, et al. Effects of radiotherapy with concomitant and adjuvant temozolomide versus radiotherapy alone on survival in glioblastoma in a randomised phase III study: 5-year analysis of the EORTC-NCIC trial. Lancet Oncol. 2009 May;10(5):459–66. - PubMed
    1. Chakravarti A, Palanichamy K. Overcoming therapeutic resistance in malignant gliomas: current practices and future directions. Cancer Treat Res. 2008;139:173–89. - PubMed
    1. Dunn GP, Rinne ML, Wykosky J, Genovese G, Quayle SN, Dunn IF, et al. Emerging insights into the molecular and cellular basis of glioblastoma. Genes Dev. 2012 Apr 15;26(8):756–84. - PMC - PubMed
    1. Li J, Yen C, Liaw D, Podsypanina K, Bose S, Wang SI, et al. PTEN, a putative protein tyrosine phosphatase gene mutated in human brain, breast, and prostate cancer [see comments]. Science. 1997;275(5308):1943–7. - PubMed

Publication types