Comparative Study
. 2014:5:3231.
doi: 10.1038/ncomms4231.

Gene co-expression network analysis reveals common system-level properties of prognostic genes across cancer types

Affiliations
Comparative Study

Gene co-expression network analysis reveals common system-level properties of prognostic genes across cancer types

Yang Yang et al. Nat Commun. 2014.

Abstract

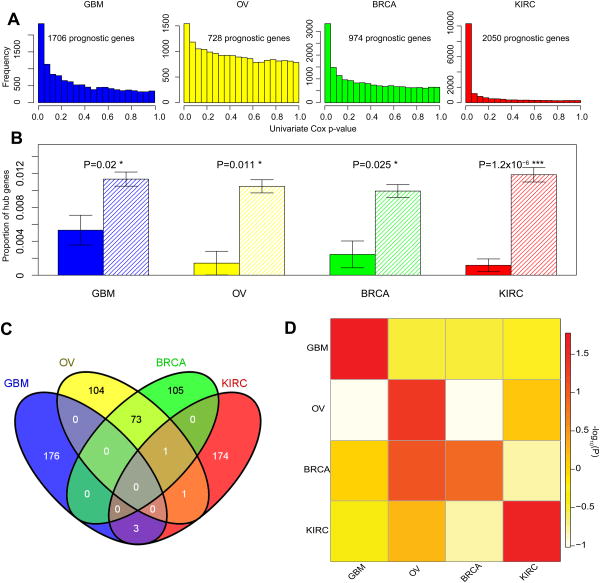
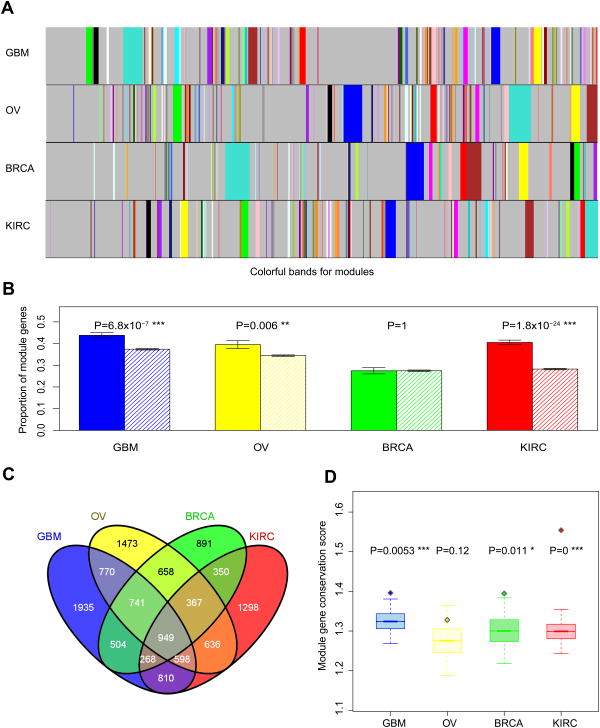
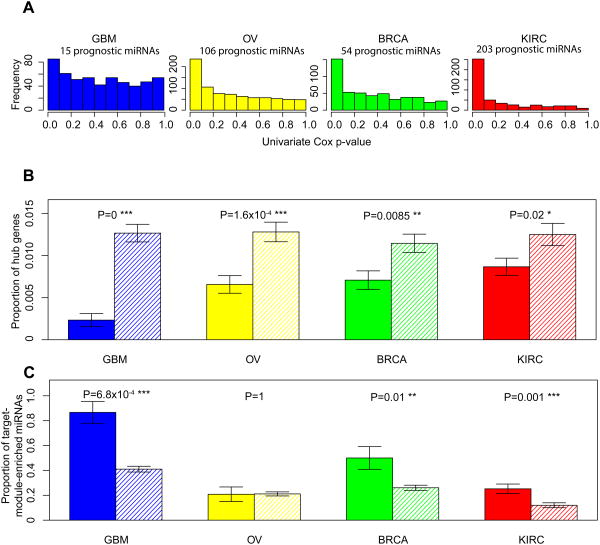
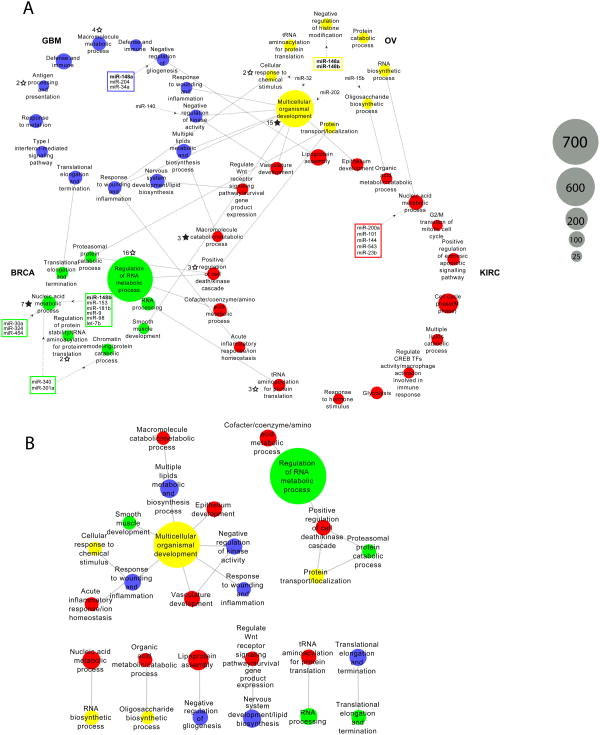
Prognostic genes are key molecules informative for cancer prognosis and treatment. Previous studies have focused on the properties of individual prognostic genes, but have lacked a global view of their system-level properties. Here we examined their properties in gene co-expression networks for four cancer types using data from 'The Cancer Genome Atlas'. We found that prognostic mRNA genes tend not to be hub genes (genes with an extremely high connectivity), and this pattern is unique to the corresponding cancer-type-specific network. In contrast, the prognostic genes are enriched in modules (a group of highly interconnected genes), especially in module genes conserved across different cancer co-expression networks. The target genes of prognostic miRNA genes show similar patterns. We identified the modules enriched in various prognostic genes, some of which show cross-tumour conservation. Given the cancer types surveyed, our study presents a view of emergent properties of prognostic genes.


Conflict of interest statement

Conflict of interest: The authors declare that they have no conflict of interest.

Figures

Figure 1
Figure 1. The depletion of prognostic mRNA genes in hubs
(A) The P-value distributions of the correlations of mRNA expression with overall survival based on the univariate Cox model in the four cancer types. Based on the signal-to-noise ratio, prognostic mRNA genes were identified. (B) Prognostic mRNA genes are depleted in the hubs. Solid bars represent the proportions of hub genes among prognostic mRNA genes; striped bars represent the proportions of hub genes among non-prognostic mRNA genes. Error bars indicate ± 1 s.e.m., and P-values were calculated based on Fisher's exact tests. (C) The Venn diagram of hub genes across the four cancer types. (D) The heatmap showing the cancer-type–specific pattern of hub depletion. The color of each cell represents the depletion score of prognostic mRNA genes of a cancer type (column) in hub genes of another cancer type (row); row-wise scaled –log10(P-value) is plotted with red indicating significant, white indicating not significant. P-values were calculated based on Fisher's exact tests.
Figure 2
Figure 2. The enrichment of prognostic mRNA genes in modules
(A) Modules defined from the weighted gene co-expression networks. Colorful bands represent modules in the network, with the biggest module in turquoise, second largest in blue, then brown, green, yellow and so on. (B) Prognostic genes are enriched in the modules. Solid bars represent the proportions of module genes among prognostic mRNA genes; striped bars represent the proportions of module genes among non-prognostic mRNA genes. Error bars indicate ± 1 s.e.m., and P-values were calculated based on Fisher's exact tests. (C) The Venn diagram of module genes across the four cancer types. (D) Boxplots (median ± 1 quartile) showing that prognostic genes tend to be more conserved module genes. Y-axis represents the module-gene conservation score, which ranges from 0 to 4, with 0 indicating not a module gene in any of the four cancer types and 4 indicating a module gene in all four cancer types. Each boxplot represents the mean-conservation-score distribution of 20,000 randomly sampled same-size gene sets; the diamond dot represents the mean conservation score of prognostic genes. P-values were calculated based on Wilcoxon rank sum tests.
Figure 3
Figure 3. Target genes of prognostic miRNA genes show the same patterns
(A) The P-value distributions of the correlations of miRNA expression with overall survival based on the univariate Cox model in the four cancer types. Based on the signal-to-noise ratio, prognostic miRNA genes were identified. (B) Target genes of prognostic miRNA genes are depleted in the hubs. Solid bars represent the proportions of hub genes among target genes of prognostic miRNAs; striped bars represent the proportions of hub genes among non-target genes of prognostic miRNAs. (C) Target genes of prognostic miRNAs are enriched in the modules. Solid bars represent the proportions of target-module–enriched miRNAs among prognostic miRNAs; striped bars represent the proportions of target-module–enriched miRNAs among non-prognostic miRNAs. Error bars indicate ± 1 s.e.m., and P-values were calculated based on Fisher's exact tests.
Figure 4
Figure 4. Integrative analysis of prognostic modules
(A) The 47 prognostic modules are plotted in 4 circles, each representing one cancer type. Grey solid lines represent the conservation correspondence between two modules from two different cancer types. Dashed grey lines with black arrow represent the connections of miRNAs whose target genes are enriched in the module. Two or more miRNAs targeting the same module(s) are enclosed within a rectangle; miRNAs as module regulators in more than one cancer type are shown in boldface. Solid black stars mark the modules enriched with significantly mutated pan-cancer genes, and the associated number indicates the number of mutated genes; unfilled black stars mark enrichment that is significant only before multiple testing correction. (B) Plot showing a zoomed-in view of the 22 modules with cross-tumor conservation correspondence in (A).

References

    1. Sotiriou C, et al. Gene expression profiling in breast cancer: understanding the molecular basis of histologic grade to improve prognosis. J Natl Cancer Inst. 2006;98:262–72. - PubMed
    1. Bullinger L, et al. Use of gene-expression profiling to identify prognostic subclasses in adult acute myeloid leukemia. New England Journal of Medicine. 2004;350:1605–1616. - PubMed
    1. Spentzos D, et al. Gene expression signature with independent prognostic significance in epithelial ovarian cancer. J Clin Oncol. 2004;22:4700–10. - PubMed
    1. Zhao H, et al. Gene expression profiling predicts survival in conventional renal cell carcinoma. PLoS Med. 2006;3:e13. - PMC - PubMed
    1. Adler AS, Chang HY. From description to causality: mechanisms of gene expression signatures in cancer. Cell Cycle. 2006;5:1148–51. - PubMed

Publication types