. 2014 Jun;21(6):876-87.
doi: 10.1038/cdd.2014.7. Epub 2014 Jan 31.

The granzyme B-Serpinb9 axis controls the fate of lymphocytes after lysosomal stress

Affiliations

The granzyme B-Serpinb9 axis controls the fate of lymphocytes after lysosomal stress

C H Bird et al. Cell Death Differ. 2014 Jun.

Abstract

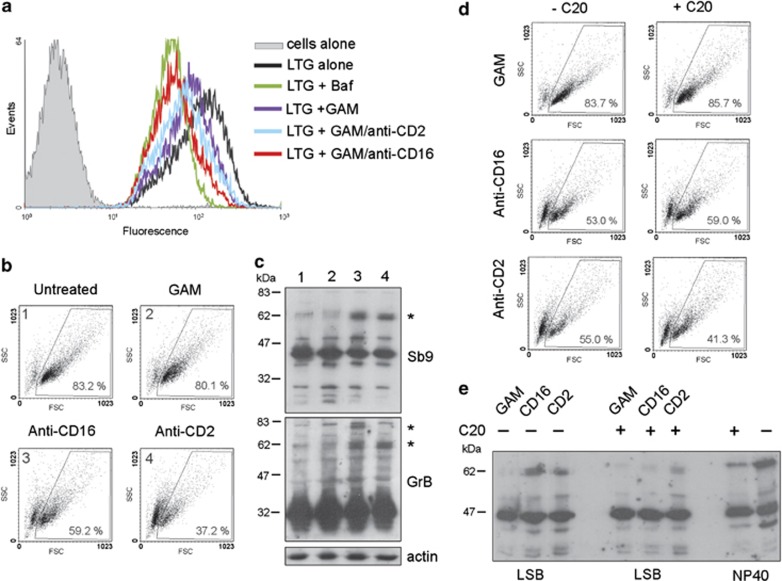
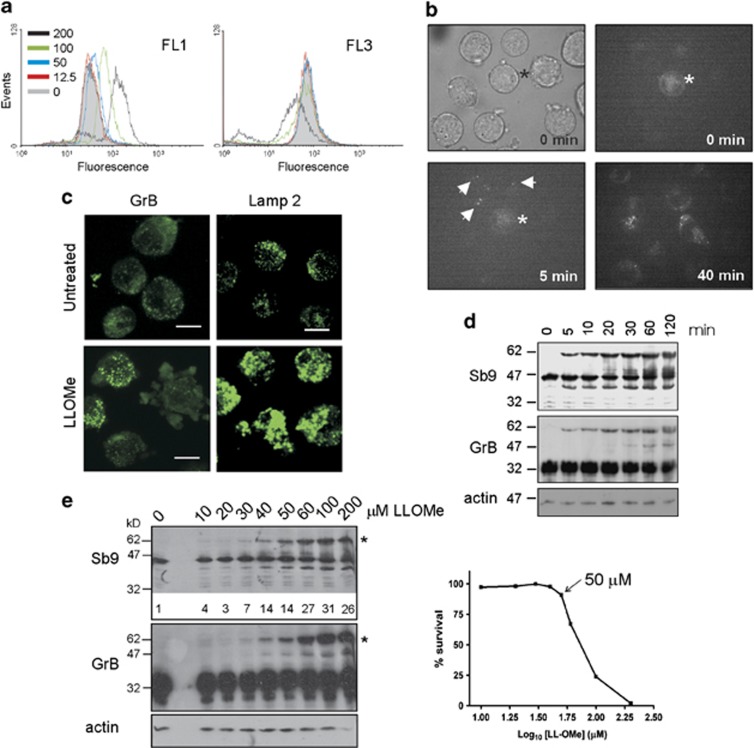
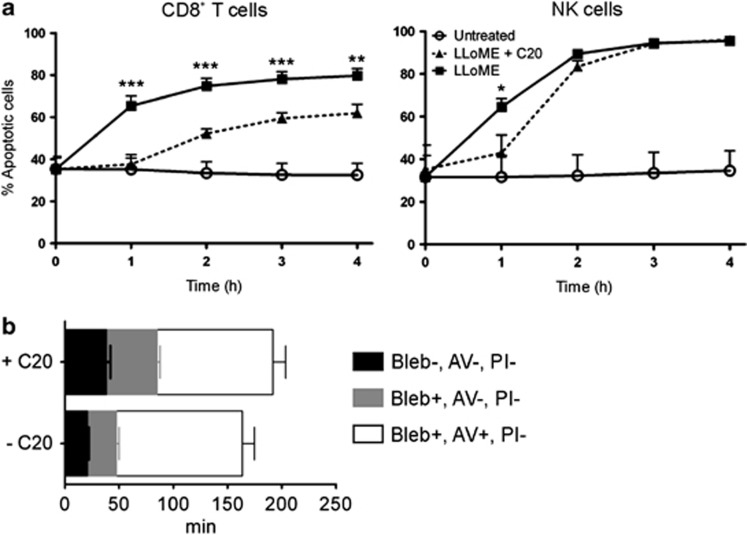
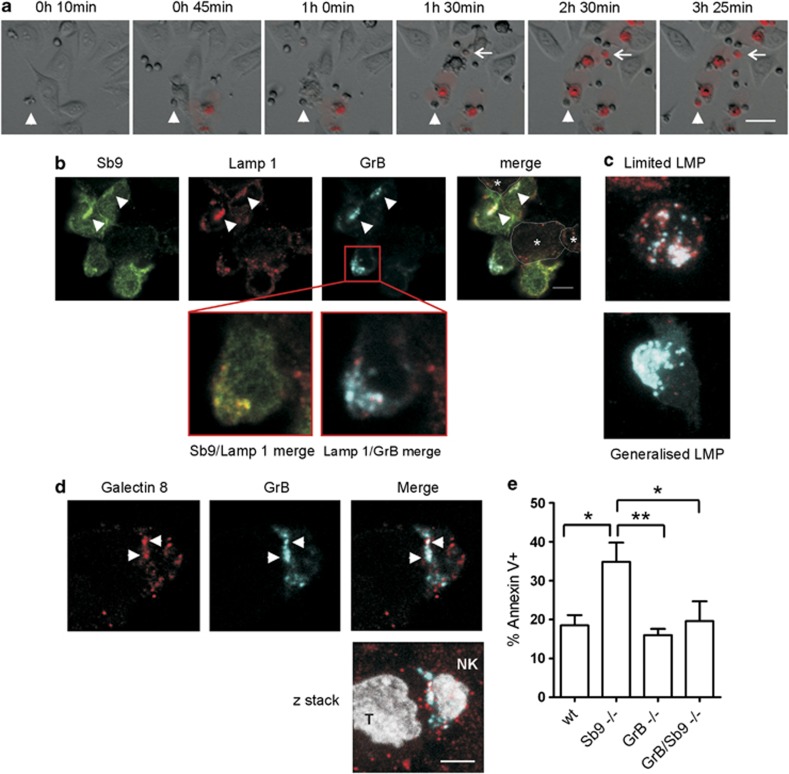
Cytotoxic lymphocytes (CLs) contain lysosome-related organelles (LROs) that perform the normal degradative functions of the lysosome, in addition to storage and release of powerful cytotoxins employed to kill virally infected or abnormal cells. Among these cytotoxins is granzyme B (GrB), a protease that has also been implicated in activation (restimulation)-induced cell death of natural killer (NK) and T cells, but the underlying mechanism and its regulation are unclear. Here we show that restimulation of previously activated human or mouse lymphocytes induces lysosomal membrane permeabilisation (LMP), followed by GrB release from LROs into the CL cytosol. The model lysosomal stressors sphingosine and Leu-Leu-methyl-ester, and CLs from gene-targeted mice were used to show that LMP releases GrB in both a time- and concentration-dependent manner, and that the liberated GrB is responsible for cell death. The endogenous GrB inhibitor Serpinb9 (Sb9) protects CLs against LMP-induced death but is decreasingly effective as the extent of LMP increases. We also used these model stressors to show that GrB is the major effector of LMP-mediated death in T cells, but that in NK cells additional effectors are released, making GrB redundant. We found that limited LMP and GrB release occurs constitutively in proliferating lymphocytes and in NK cells engaged with targets in vitro. In Ectromelia virus-infected lymph nodes, working NK cells lacking Sb9 are more susceptible to GrB-mediated death. Taken together, these data show that a basal level of LMP occurs in proliferating and activated lymphocytes, and is increased on restimulation. LMP releases GrB from LROs into the lymphocyte cytoplasm and its ensuing interaction with Sb9 dictates whether or not the cell survives. The GrB-Sb9 nexus may therefore represent an additional mechanism of limiting lymphocyte lifespan and populations.


Figures

Figure 1
Figure 1
Restimulation induced cell death in human CD8+ T cells involves GrB. (a) CTLs were activated with 5 μg/ml con-A and IL-2. Cells were lysed in LSB and GrB, Sb9 and actin levels determined by sequential probing of an immunoblot. GrB expression on day 3 was also determined by FACS analysis. Cells were fixed with paraformaldehyde, permeabilised with 0.1% saponin in Hank's balanced salt solution (HBSS), then stained with either isotype control (MOPC31) or GB11 followed by anti-mouse Ig conjugated to Alexa Fluor 568. (b) Activated cells were ‘rested' for 3 days in medium with IL-2 alone. Cells were pretreated, or not, with 100 μM C20 for 3 h then restimulated with 5 μg/ml con-A/IL-2. Survival was determined after 4 h by FACS analysis. PI exclusion confirmed that only the gated cells were viable (not shown). (c) Activated cells were ‘rested' then restimulated for 4 h with con-A/IL-2 in the presence of nocodazole. Lamp 1 was detected with a sheep polyclonal antibody, and GrB with GB11. Images were collected using constant instrument settings optimised for ‘treated' samples. Some untreated cells showed minor LMP and GrB release (−con-A, zoom 1, arrow heads). Zoom 2 indicates a treated cell with cytosolic and nuclear GrB (*nucleus is circled). Zoom 3 shows reduced coincidence of GrB and Lamp staining. Shown are deconvolved image stacks. Bar=10 μm. (d) Colocalisation analysis was performed and the Manders' coefficient indicating the extent of GrB overlap with Lamp is shown graphically. Each point represents one cell (n=95 for 0 con-A; n=56 for each 5 and 10 μg/ml con-A) and the bars are mean±S.D.
Figure 2
Figure 2
Restimulation of mouse T cells induces LMP and GrB-mediated death, and Sb9 enhances cell survival. (ac) Splenocytes activated with anti-CD3/anti-CD28 and IL-2/IL-7 were cultured in fresh medium containing IL-2 alone for 24–48 h. (a) Splenocytes were restimulated with con-A for up to 72 h. Viability was determined using AO/ethidium bromide staining. Data shown are pooled from four to six independent experiments. Inset is a graph showing the % survival at 24 h. (b) Splenocytes were restimulated on immobilised anti-CD3 for 36 h and cell survival assessed by FACS analysis. Shown are pooled data from at least three independent experiments. Each point represents cells isolated from one mouse and the bar indicates the mean % survival. (c) Celltracker orange dilution was used to measure cell division. Activated cells were loaded with the dye following the manufacturer's instructions, then restimulated with immobilised anti-CD3 for 36 h. The mean fluorescence intensity before and after restimulation was measured by FACS analysis. (d) Splenocytes from Jinx mice (which inefficiently degranulate) were restimulated with con-A for 4.5 h, then fixed for immunocytochemistry. GrB was detected with GB11 and Lamp 1 with 1D4B. All images were collected using the same instrument settings optimised for ‘treated' samples. A cell in the untreated population has LROs undergoing LMP and GrB release (arrow heads). Shown are deconvolved image stacks. Bar=10 μm. (e) Colocalisation analysis was performed as in Figure 1d (n=50 for con-A and 78 for+con-A)
Figure 3
Figure 3
AICD follows receptor-mediated LMP and GrB release in human NK cells. (a) IL-2-activated NK cells were loaded with Lysotracker Green (LTG), then incubated with either anti-CD2 or anti-CD16 mAbs cross-linked using goat anti-mouse antibody (GAM), or GAM alone, or bafilomycin A1. (b and c) Activated cells were either untreated, exposed to anti-CD2 or anti-CD16 together with GAM antibody, or exposed to GAM antibody alone for 2 h at 37 °C. Cells from the same experiment were analysed by FACS analysis for cell survival (b) or lysed in LSB for immunoblotting (c). The numbered lanes correspond to the indicated FACS plots. *Sb9/GrB complexes. A single membrane was probed sequentially for Sb9 (R11), GrB (R041) and actin proteins. (d and e) The experiment described above was repeated, but NK cells were first incubated with and without C20, then exposed to antibodies in the presence of C20. Cells were analysed by FACS analysis for cell survival (d) or by immunoblotting for complexes formed before lysis (e; LSB). NK cells pretreated with C20 but not exposed to mAbs were lysed in NP40 to ascertain the efficiency of GrB inhibition by C20, as indicated by a reduction of Sb9/GrB complex formation post lysis (e; NP40). The immunoblot was probed with anti-Sb9 (R11)
Figure 4
Figure 4
LMP, release of GrB and cell death increases with rising doses of lysosomal stressors. Human NK-like cells,YT, were treated with the lysosomal disruptor LLOMe and LRO damage monitored. (a) Cells were loaded with AO and exposed to the indicated concentrations (μM) of LLOMe for 30 min. AO redistribution was determined by FACS analysis. Minor LMP and release of AO is indicated by increased FL1 but unaltered FL3 fluorescence; significant LMP/granule damage results in increased FL1 and decreased FL3 fluorescence. (b) YT cells expressing GrB-eGFP were exposed to 250 μM LLOMe. GFP fluorescence was monitored over 2 h. Shown are single optical sections and a bright-field image at t=0 min. *A cell which is GFP+ before addition of LLOMe. Arrows indicate individual LROs that have become fluorescent after 5 min. (c) Cells were exposed to 250 μM LLOMe for 20 min. Changes in GrB and Lamp 2 distribution were monitored by indirect immunofluorescence using GB11 or H4B4 antibodies. Shown are representative images. Bar=10 μm. (d) Cells were exposed to 200 μM LLOMe for the indicated times (min), lysed in LSB and extracts analysed by immunoblotting. (e) Individual aliquots of YT cells were exposed to increasing concentrations of LLOMe for 30 min. Each aliquot was divided in two to assess cell survival (right panel) and the amount of preformed complex formation (left panel). The membrane was probed sequentially for GrB, Sb9 (R11) and actin proteins. *Sb9/GrB complexes. The amount of preformed complex (*) detected by the Sb9 antibody was estimated by densitometric analysis using the image processing software Image J. The boxed values below the Sb9 immunoblot indicate the intensity of bands relative to the same band in the untreated lane
Figure 5
Figure 5
LLOMe-induced apoptosis is primarily GrB-mediated in human CTL but not in human NK cells. Activated CTLs (a) and NK cells (a and b) were pretreated, or not, with C20 then exposed to 250 μM LLOMe, AV and PI. (a) % Apoptosis was determined at hourly intervals by FACS analysis. Data are pooled from at least eight independent experiments for CTLs and five independent experiments for NK cells. LLOMe-treated cells showed significantly less death if pretreated with C20 (*P<0.05; **P<0.01; ***P<0.001). (b) NK cell death was monitored at 3 min intervals for 6 h by time-lapse microscopy. The duration from addition of LLOMe to appearance of membrane blebbing, AV binding and PI uptake was recorded for 30–50 individual cells (data are pooled from two separate experiments). Black bars indicate time during which cells showed normal morphology, grey bars indicate time when cells showed membrane blebbing but were not AV or PI positive, and white bars show time when cells showed both membrane blebbing and AV staining but were not PI positive. Cells were positive for PI staining at times later than that indicated by the white bars
Figure 6
Figure 6
GrB is the key initiator of death in response to LRO damage in activated mouse splenic T cells but not in NK cells. (a and b) Con-A activated splenocytes were exposed to two-fold serial dilutions of LLOMe and survival assessed 18 h later by MTT assay. Shown are survival curves from representative experiments. Data are mean and S.D. of triplicates. (b, left panel) Survival curves were generated for each of the indicated genotypes in at least 5 separate experiments (one representative data set is shown). The % survival of splenocytes in 1 mM LLOMe was determined from the curves and pooled data presented as a vertical scatter plot (b, right panel) where each point represents cells isolated from one mouse and the bar indicates the mean % survival. (c) Activated splenic NK cells were exposed to two-fold serial dilutions of LLOMe and survival assessed 18 h later using CellTiter Glo. Survival curves were generated for each genotype in at least three separate experiments: a representative data set is shown. Data are mean and S.D. of triplicates. (d) NK cells were cultured with PI, FITC–AV and 250 μM LLOMe, and monitored by time-lapse microscopy. Images were captured at 2 min intervals over 5 h. (d, left panel) The time at which individual cells began to show membrane blebbing, became AV+ or became PI+ was determined and the means±S.E.M. shown graphically. (d, right panel) The type of death (necrotic or apoptotic) and proportion of cells, which did not die during the experiment is also shown
Figure 7
Figure 7
Sb9 protects NK cells from low-level LMP and release of GrB. (a) Time-lapse microscopy of purified human NK cells on HeLa target cells. Two NK cells (arrow and arrow head) become PI+ following target cell engagement. Bar=20 μm. (b) MM-170 target cells were co-cultured with purified, activated human NK cells for 1 h, then fixed, permeabilised and stained with antibodies to Sb9 (7D8), Lamp 1 and GrB. Shown are single optical slices. *Target cells. White arrows indicate colocalisation of all three proteins. Bar=5 μm. The boxed cell is enlarged and a merge of Sb9 and Lamp 1 (left panel), and Lamp 1 and GrB (right panel) are shown. (c) Examples from the above experiment of cells showing limited and generalised LMP. Shown are three-dimensional reconstructions of merged Lamp 1 (red) and GrB (cyan) staining. (d) MM170 cells were cultured with NK cells for 1 h then fixed and permeabilised with SDS. Cells were stained with DAPI and antibodies to galectin 8 and GrB. The lower panel is a merged z-stack and shows that the NK cell is attached to a target cell (T). Galectin 8 and GrB staining in a single optical slice are shown; the arrows indicate areas of colocalisation. Bar=5 μm. (e) Mice were infected with Ectromelia virus-Moscow strain and poplitial lymph nodes taken 2 days post infection. Cells were stained with Aqau ALIVE/DEAD stain, followed by antibodies to NK1.1 and CD3. Finally, cells were stained with AV, fixed and analysed by FACS analysis. The % AV+/alive NK1.1+/CD3 cells is shown. Data are means and S.E.M. of pooled results from four independent experiments with a total of at least eight mice per genotype. Differences were considered statistically significant if the P value was 0.05 or less (*P<0.05; **P<0.01)

Similar articles

Cited by

References

    1. Snow AL, Pandiyan P, Zheng L, Krummey SM, Lenardo MJ. The power and the promise of restimulation-induced cell death in human immune diseases. Immunol Rev. 2010;236:68–82. - PMC - PubMed
    1. Strasser A, Jost PJ, Nagata S. The many roles of FAS receptor signaling in the immune system. Immunity. 2009;30:180–192. - PMC - PubMed
    1. Brenner D, Golks A, Becker M, Muller W, Frey CR, Novak R, et al. Caspase-cleaved HPK1 induces CD95L-independent activation-induced cell death in T and B lymphocytes. Blood. 2007;110:3968–3977. - PubMed
    1. Chhabra A, Mehrotra S, Chakraborty NG, Dorsky DI, Mukherji B. Activation-induced cell death of human melanoma specific cytotoxic T lymphocytes is mediated by apoptosis-inducing factor. Eur J Immunol. 2006;36:3167–3174. - PubMed
    1. Ida H, Robertson MJ, Voss S, Ritz J, Anderson P. CD94 ligation induces apoptosis in a subset of IL-2-stimulated NK cells. J Immunol. 1997;159:2154–2160. - PubMed

Publication types