

A comparison of spectral quality in magnetic resonance spectroscopy data acquired with and without a novel EPI-navigated PRESS sequence in school-aged children with fetal alcohol spectrum disorders
- PMID: 24488204
- PMCID: PMC4024336
- DOI: 10.1007/s11011-014-9487-6
A comparison of spectral quality in magnetic resonance spectroscopy data acquired with and without a novel EPI-navigated PRESS sequence in school-aged children with fetal alcohol spectrum disorders
Abstract
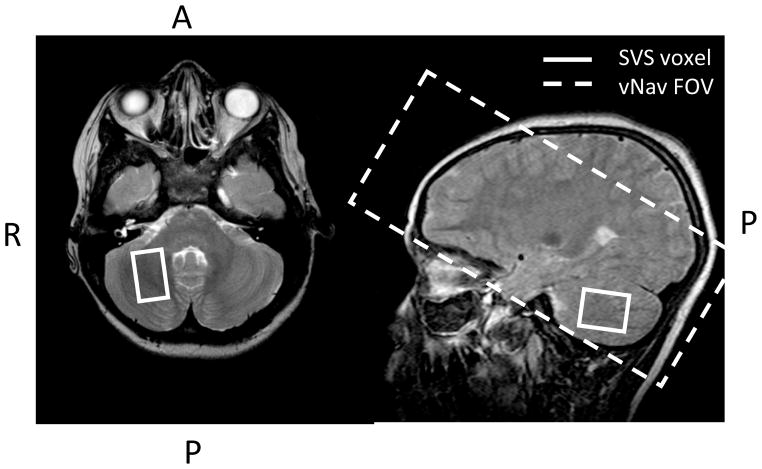
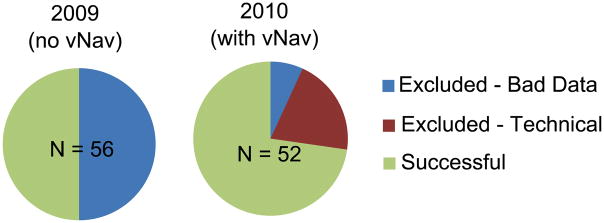
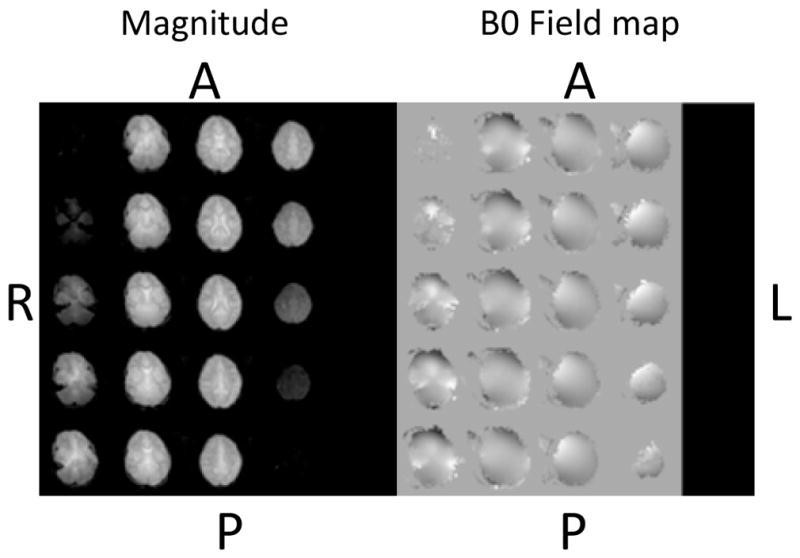
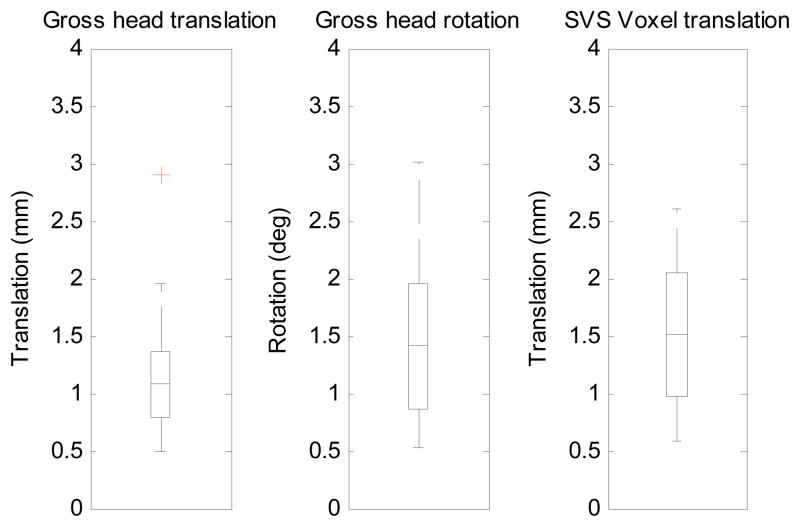
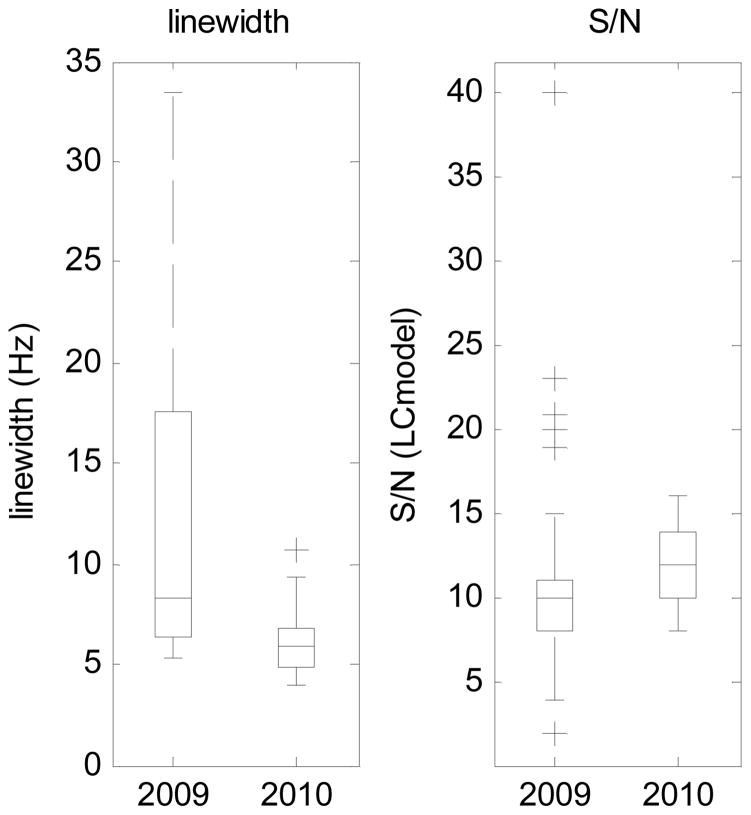
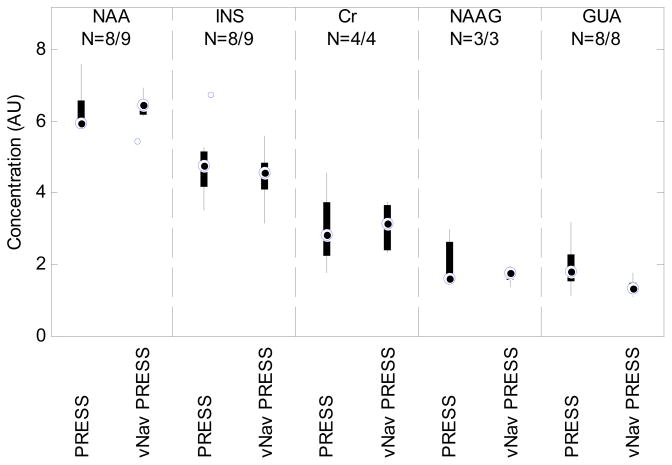
Single voxel spectroscopy (SVS) can generate useful information regarding metabolite concentrations provided that the MR signal can be averaged over several minutes during which the subject remains stationary. This requirement can be particularly challenging for children who cannot otherwise be scanned without sedation. To address this problem we developed an EPI volume navigated (vNav) SVS PRESS sequence, which applies real-time head pose (location and orientation), frequency, and first-order B0 shim adjustments. A water-independent preprocessing algorithm removes residual frequency and phase shifts resulting from within-TR movements. We compare results and performance of the standard and vNav PRESS sequences in a sample of 9- to 10-year-olds from a South African cohort of children with fetal alcohol spectrum disorders (FASD) and healthy controls. Magnetic resonance spectroscopy (MRS) data in the deep cerebellar nuclei were initially acquired with the standard PRESS sequence. The children were re-scanned 1 year later with the vNav PRESS sequence. Good quality data were acquired in 73% using the vNav PRESS sequence, compared to only 50% for the standard PRESS sequence. Additionally, tighter linewidths and smaller variances in the measured concentrations were observed. These findings confirm previous reports demonstrating the efficacy of our innovative vNav sequence with healthy volunteers and young children with HIV and expand its application to a school-aged population with FASD-disorders often associated with attention problems and hyperactivity. This study provides the most direct evidence to date regarding degree to which these new methods can improve data quality in research studies employing MRS.
Conflict of interest statement
The authors declare no competing financial interests.
Figures
Similar articles
-
Magnetic resonance spectroscopy outcomes from a comprehensive magnetic resonance study of children with fetal alcohol spectrum disorders.Magn Reson Imaging. 2009 Jul;27(6):760-78. doi: 10.1016/j.mri.2009.01.003. Epub 2009 Apr 2. Magn Reson Imaging. 2009. PMID: 19342189 Free PMC article.
-
Neuropyschological and behavioral outcomes from a comprehensive magnetic resonance study of children with fetal alcohol spectrum disorders.Can J Clin Pharmacol. 2009 Winter;16(1):e178-201. Epub 2009 Mar 27. Can J Clin Pharmacol. 2009. PMID: 19329824 Free PMC article. Clinical Trial.
-
Magnetic resonance imaging outcomes from a comprehensive magnetic resonance study of children with fetal alcohol spectrum disorders.Alcohol Clin Exp Res. 2009 Oct;33(10):1671-89. doi: 10.1111/j.1530-0277.2009.01004.x. Epub 2009 Jul 1. Alcohol Clin Exp Res. 2009. PMID: 19572986 Free PMC article.
-
Fetal Alcohol Spectrum Disorders: Characteristics, Complications, and Treatment.Community Ment Health J. 2017 Aug;53(6):711-718. doi: 10.1007/s10597-017-0104-0. Epub 2017 Feb 6. Community Ment Health J. 2017. PMID: 28168434 Review.
-
Folic acid supplementation and malaria susceptibility and severity among people taking antifolate antimalarial drugs in endemic areas.Cochrane Database Syst Rev. 2022 Feb 1;2(2022):CD014217. doi: 10.1002/14651858.CD014217. Cochrane Database Syst Rev. 2022. PMID: 36321557 Free PMC article.
Cited by
-
Preprocessing, analysis and quantification in single-voxel magnetic resonance spectroscopy: experts' consensus recommendations.NMR Biomed. 2021 May;34(5):e4257. doi: 10.1002/nbm.4257. Epub 2020 Feb 21. NMR Biomed. 2021. PMID: 32084297 Free PMC article.
-
Motion correction in magnetic resonance spectroscopy.Magn Reson Med. 2020 Nov;84(5):2312-2326. doi: 10.1002/mrm.28287. Epub 2020 Apr 17. Magn Reson Med. 2020. PMID: 32301174 Free PMC article. Review.
-
Prospective frequency correction using outer volume suppression-localized navigator for MR spectroscopy and spectroscopic imaging.Magn Reson Med. 2018 Dec;80(6):2366-2373. doi: 10.1002/mrm.27340. Epub 2018 May 13. Magn Reson Med. 2018. PMID: 29756324 Free PMC article.
-
Multivariate approach for longitudinal analysis of brain metabolite levels from ages 5-11 years in children with perinatal HIV infection.Neuroimage. 2021 Aug 15;237:118101. doi: 10.1016/j.neuroimage.2021.118101. Epub 2021 May 4. Neuroimage. 2021. PMID: 33961998 Free PMC article.
-
Motion correction methods for MRS: experts' consensus recommendations.NMR Biomed. 2021 May;34(5):e4364. doi: 10.1002/nbm.4364. Epub 2020 Jul 20. NMR Biomed. 2021. PMID: 33089547 Free PMC article.
References
-
- Carter RC, Jacobson SW, Molteno CD, Chiodo LM, Viljoen D, Jacobson JL. Effects of prenatal alcohol exposure on infant visual acuity. J Pediatr. 2005;147:473–479. - PubMed
-
- Coles CD, Platzman KA, Raskind-Hood CL, Brown RT, Falek A, Smith IE. A comparison of children affected by prenatal alcohol exposure and attention deficit, hyperactivity disorder. Alcohol Clin Exp Res. 1997;21:150–161. - PubMed
-
- Croxford J, Viljoen D. Alcohol consumption by pregnancy women in the Western Cape. South Afr Med J. 1999;89:962–965. - PubMed
Publication types
MeSH terms
Grants and funding
LinkOut - more resources
Full Text Sources
Other Literature Sources
Medical
