. 2014 Jan;26(1):497-515.
doi: 10.1105/tpc.113.119255. Epub 2014 Jan 31.

The rice TAL effector-dependent resistance protein XA10 triggers cell death and calcium depletion in the endoplasmic reticulum

Affiliations

The rice TAL effector-dependent resistance protein XA10 triggers cell death and calcium depletion in the endoplasmic reticulum

Dongsheng Tian et al. Plant Cell. 2014 Jan.

Abstract

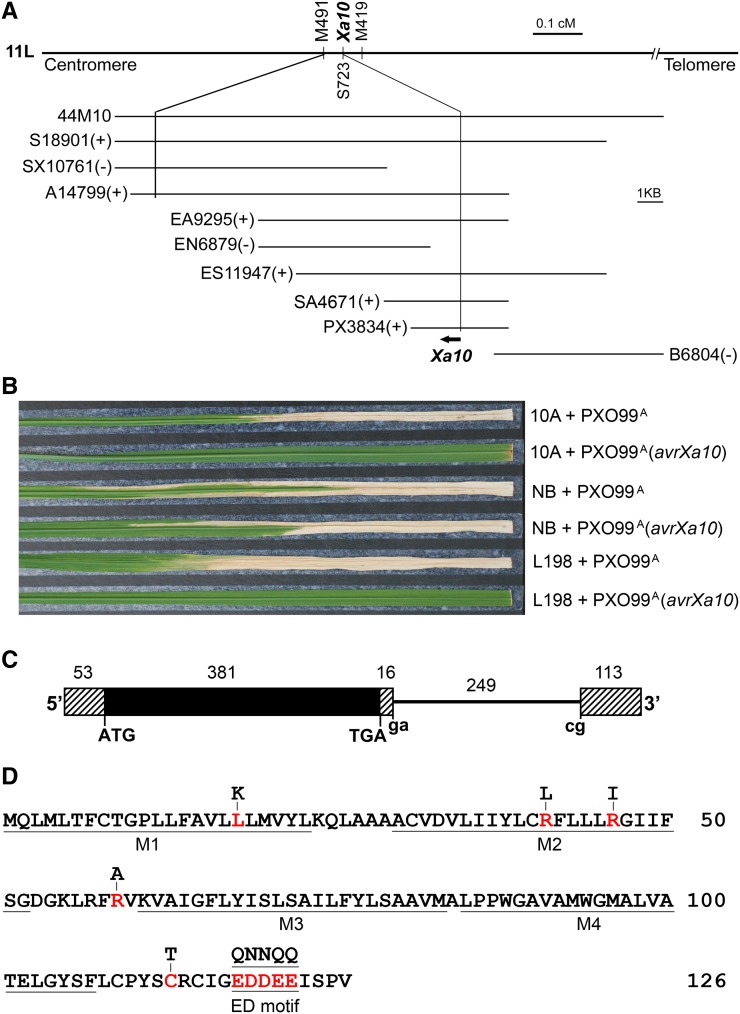
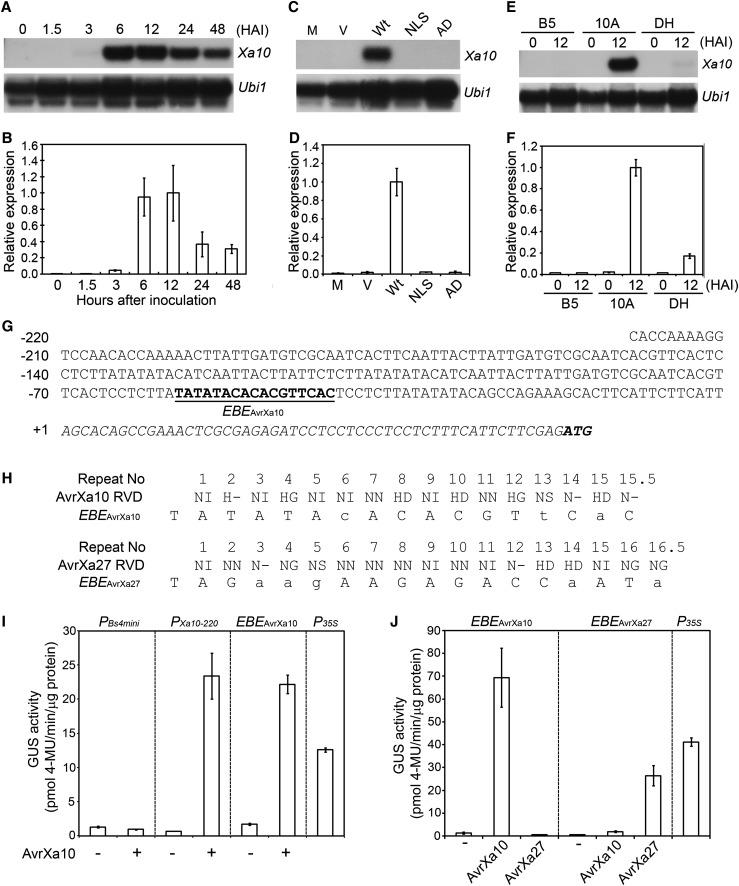
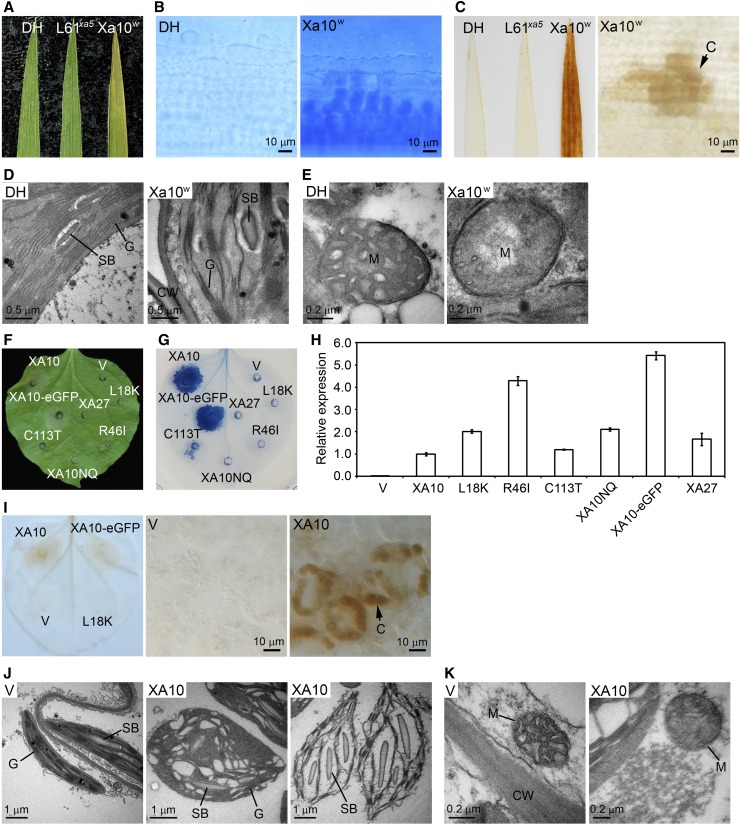
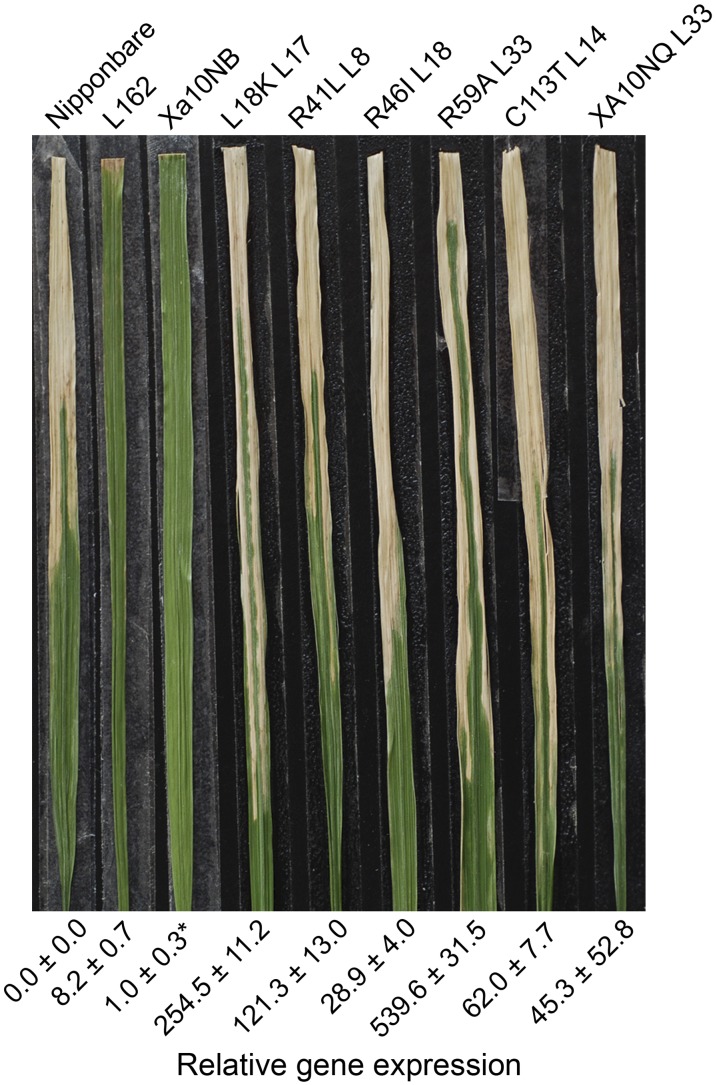
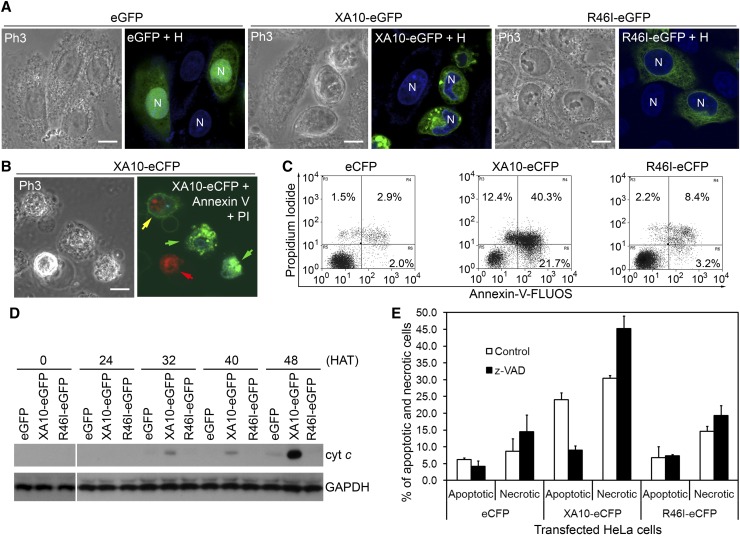
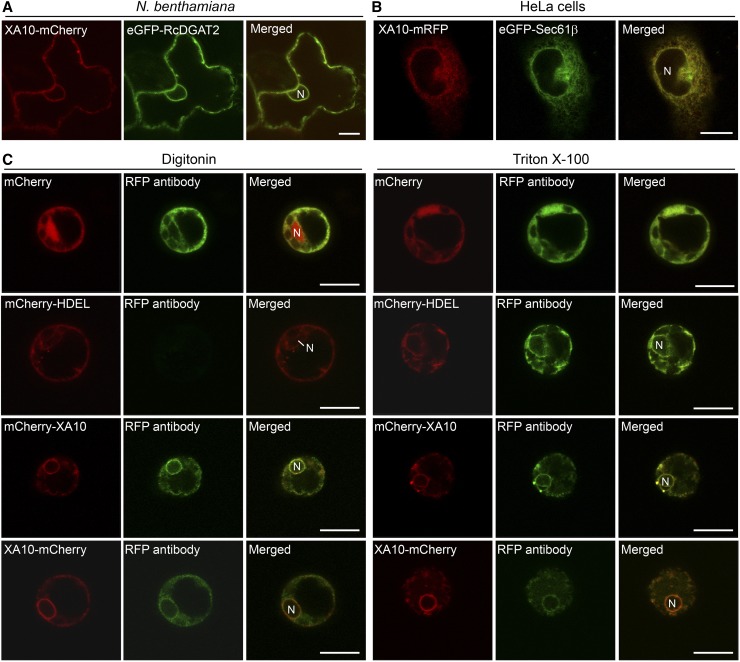
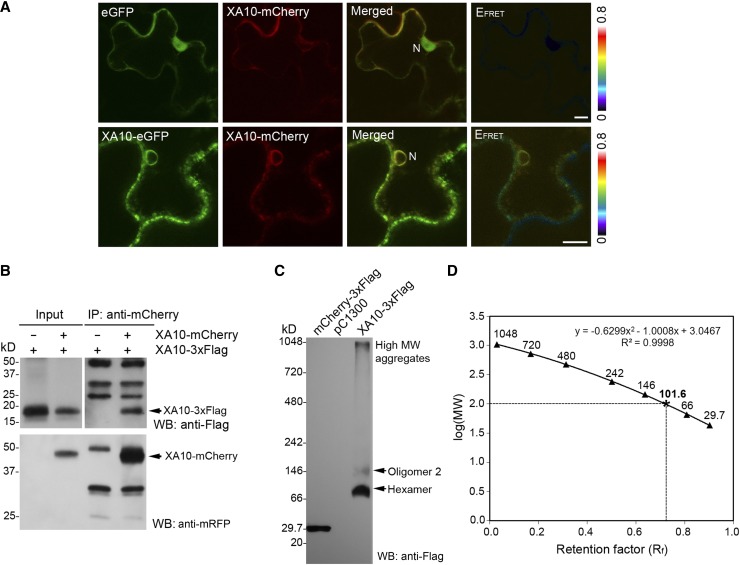
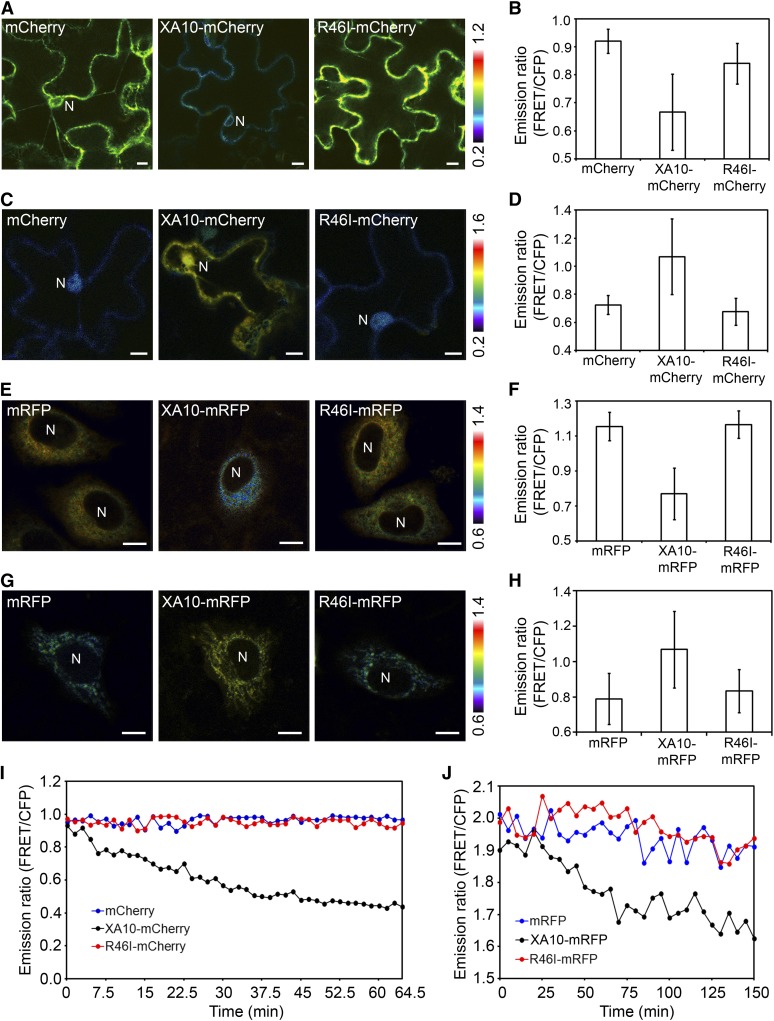
The recognition between disease resistance (R) genes in plants and their cognate avirulence (Avr) genes in pathogens can produce a hypersensitive response of localized programmed cell death. However, our knowledge of the early signaling events of the R gene-mediated hypersensitive response in plants remains limited. Here, we report the cloning and characterization of Xa10, a transcription activator-like (TAL) effector-dependent R gene for resistance to bacterial blight in rice (Oryza sativa). Xa10 contains a binding element for the TAL effector AvrXa10 (EBEAvrXa10) in its promoter, and AvrXa10 specifically induces Xa10 expression. Expression of Xa10 induces programmed cell death in rice, Nicotiana benthamiana, and mammalian HeLa cells. The Xa10 gene product XA10 localizes as hexamers in the endoplasmic reticulum (ER) and is associated with ER Ca(2+) depletion in plant and HeLa cells. XA10 variants that abolish programmed cell death and ER Ca(2+) depletion in N. benthamiana and HeLa cells also abolish disease resistance in rice. We propose that XA10 is an inducible, intrinsic terminator protein that triggers programmed cell death by a conserved mechanism involving disruption of the ER and cellular Ca(2+) homeostasis.


Figures

Figure 1.
Figure 1.
Map-Based Cloning of the Xa10 Gene. (A) Genetic and physical maps of the Xa10 locus. The Xa10 locus is flanked by molecular markers M491 and M419 and cosegregated with S723 (Gu et al., 2008). BAC clone 44M10 was identified by markers M491 and S723. The 44M10 subclones that produced bacterial blight–resistant transgenic plants are marked with “+;” otherwise, they are marked with “−.” Vertical lines link the genetic locations of M491 and the Xa10 locus to their positions on the physical map. The position of the Xa10 gene is indicated with short bold line with arrowhead pointing to the direction of transcription. cM, centimorgans. (B) Disease phenotype of rice lines 2 weeks after inoculation with X. oryzae pv oryzae strains PXO99A or PXO99A(avrXa10). 10A, IRBB10A; NB, Nipponbare; L198, Xa10 transgenic line L198 carrying the Xa10 genomic clone SA4671. (C) Gene structure of Xa10. The schematic map shows the coding region (closed box), the 5′ and 3′ untranslated regions (hatched boxes), and the intron in the 3′ untranslated region of the Xa10 gene (line). The 5′ and 3′ splice junctions (ga and cg) of the intron are indicated. The numbers indicate the size of each substructure. (D) The deduced amino acid sequence of XA10. The transmembrane helices (M1 to M4) and the acidic ED motif in the C-terminal region of XA10 are underlined. Amino acid residues and the ED motif which were used to generate XA10 variants are displayed in red letters. Mutated amino acid residues are shown above the corresponding amino acid residue positions. Transmembrane helices were predicted using the SOSUI program (http://bp.nuap.nagoya-u.ac.jp/sosui/sosui_submit.html).
Figure 2.
Figure 2.
Specific Induction of Xa10 by AvrXa10. (A) and (B) The expression of Xa10 in IRBB10A at different time points after inoculation with X. oryzae pv oryzae strain PXO99A(avrXa10). Xa10 transcripts were detected by RNA gel blot analysis (A) and qRT-PCR (B). The expression of rice ubiquitin gene 1 (Ubi1) served as control. For qRT-PCR, the average expression level of Xa10 in IRBB10A at 12 HAI with PXO99A(avrXa10) was set as “1.” The qRT-PCR experiments were performed in triplicate, and the data are presented as means ± sd. (C) and (D) The expression of Xa10 in IRBB10A at 12 HAI with water (M) or PXO99A strains harboring pHM1 (V), pHM1avrXa10 (Wt), pHM1avrXa10NLS (NLS), or pHM1avrXa10AD (AD). RNA gel blot analysis (C) and real-time RT-PCR (D) were performed similarly as described above. (E) and (F) The expression of Xa10 in IRBB5(B5), IRBB10A(10A), and Xa10 and xa5 DH plants at 0 and 12 HAI with PXO99A(avrXa10). RNA gel blot analysis (E) and qRT-PCR (F) were performed similarly as described above. (G) Nucleotide sequence of Xa10 promoter and EBEAvrXa10. The transcriptional initiation site is marked as “+1.” Only a short functional region of Xa10 promoter (−220 to −1), the 5′ untranslated region (in italics), and start codon (in bold italics) are listed. EBEAvrXa10 is referenced. (H) Association between the repeat variable diresidues (RVDs) of AvrXa10 and the nucleotides of EBEAvrXa10. The association was predicted based on the codes published previously (Boch et al., 2009; Moscou and Bogdanove, 2009). Perfect matches are shown in capital letters, and the second most common matches are displayed in lowercase letters. The “–” indicates that amino acid 13 is missing in this repeat. The association between the RVDs of AvrXa27 and the nucleotides of EBEAvrXa27 is also displayed. (I) Identification of EBEAvrXa10 in Xa10 promoter. GUS reporter constructs containing the Xa10 promoter (−220 to −1) (PXa10-220) or EBEAvrXa10 were codelivered via Agrobacterium into N. benthamiana with 35S-driven avrXa10 and empty T-DNA (-), respectively. The AvrXa10-activated promoter activity was measured as the GUS activity. The GUS reporter constructs containing minimal tomato Bs4 promoter (PBs4mini) only (Boch et al., 2009) and the cauliflower mosaic virus 35S promoter (P35S) served as controls. 4-MU, 4-methyl-umbelliferone. The experiments were performed in triplicate and the data are presented as means ± sd. (J) Specific recognition between EBEAvrXa10 and AvrXa10 and between EBEAvrXa27 and AvrXa27. The AvrXa10- or AvrXa27-activated promoter activity was measured as the GUS activity as described in (I). EBEAvrXa10 and EBEAvrXa27 are GUS reporter constructs containing EBEAvrXa10 and EBEAvrXa27, respectively.
Figure 3.
Figure 3.
XA10 Induces HR in Rice and N. benthamiana. (A) Phenotypes of rice lines DH(xa5xa5, Xa10Xa10), L61xa5(PPR1:avrXa10:TNos, xa5xa5), and Xa10w(PPR1:avrXa10:TNos, xa5xa5, Xa10xa10) plants at 2 weeks after germination. (B) Trypan blue staining of leaf tissues of DH and Xa10w plants. (C) DAB staining of leaf tissues of DH, L61xa5, and Xa10w plants. The high magnification of leaf cells of Xa10w is shown in the right panel. C, chloroplast. (D) and (E) Transmission electron microscopy images of chloroplasts (D) and mitochondria (E) in leaf cells of DH and Xa10w plants. (F) Phenotype of N. benthamiana leaf at 24 HAI with A. tumefaciens harboring Xa10 or derivatives. V, pC1300; XA10, PPR1:Xa10:TNos; L18K, PPR1:Xa10L18K:TNos; R46I, PPR1:Xa10R46I:TNos; C113T, PPR1:Xa10C113T:TNos; XA10NQ, PPR1:Xa10NQ:TNos; XA10-eGFP, PPR1:Xa10-eGFP:TNos; XA27, PPR1:Xa27:TNos. (G) Trypan blue staining of leaf tissue of N. benthamiana in (F). (H) Relative expression of transgenes in leaf tissues of N. benthamiana at 20 HAI. Gene transcripts were detected by qRT-PCR. The average expression of PPR1:Xa10:TNos (XA10) was set as “1.” The qRT-PCR experiments were performed in triplicate, and the data are presented as means ± sd. (I) DAB staining of N. benthamiana leaf at 14 HAI with A. tumefaciens harboring Xa10 or derivatives. (J) and (K) Transmission electron microscopy images of chloroplasts (J) and mitochondria (K) in leaf cells of N. benthamiana at 14 HAI with A. tumefaciens harboring Xa10 construct or pC1300. CW, cell wall; G, grana; M, mitochondrion; SB, starch body. Gene abbreviations in (G) to (K) are the same as in (F). Bars are indicated.
Figure 4.
Figure 4.
Disease Phenotypes and Gene Expression of Transgenic Lines Carrying Xa10 Variant Genes. Disease phenotypes of transgenic T1 plants and control varieties were recorded at 14 d after inoculation with PXO99A(avrXa10). Relative expression of Xa10 and variants in rice plants was determined by qRT-PCR using total RNA isolated from leaves infiltrated with PXO99A(avrXa10). The expression of rice Ubi1 gene served as control. The average expression level of Xa10 in Xa10NB at 24 HAI was set as “1” (indicated with an asterisk). The experiments were performed in triplicate, and the data are presented as means ± sd. Experiments were repeated three times with T0, T1, and T2 plants of transgenic lines with similar results, and only the data from the T1 generation are presented. NB, Nipponbare; L162, T1 plant of line 162 of PPR1:Xa10:TNos; Xa10NB, Xa10 in Nipponbare genetic background; L18K L17, T1 plant of line 17 of PPR1:Xa10L18K:TNos; R41L L8, T1 plant of line 8 of PPR1:Xa10R41L:TNos; R46I L18, T1 plant of line 18 of PPR1:Xa10R46I:TNos; R59A L33, T1 plant of line 33 of PPR1:Xa10R59A:TNos; C113T L14, T1 plant of line 14 of PPR1:Xa10C113T:TNos; Xa10NQ L33, T1 plant of line 33 of PPR1:Xa10NQ:TNos.
Figure 5.
Figure 5.
XA10 Induces Cell Death in HeLa Cells. (A) Phenotypes of HeLa cells expressing eGFP, XA10-eGFP, or XA10R46I-eGFP (R46I-eGFP). Images were taken at 24 HAT. The nuclei of HeLa cells were stained with Hoechst 33258 (H). The bright-field images (Ph3) were taken simultaneously using Phase Contrast 3 optics. N, nucleus. Bars = 10 μm. (B) Double staining of HeLa cells expressing XA10-eCFP with Annexin V and PI. The apoptotic cells (indicated with green arrows) were stained with Annexin V (green channel), whereas the necrotic cells derived from postapoptotic cell death were stained with both Annexin V and PI (red channel) (indicated with yellow arrow) or PI alone (indicated with red arrow). Images were taken at 24 HAT. Bar = 10 μm. (C) Flow cytometry analysis of HeLa cells expressing eCFP, XA10-eCFP, or XA10R46I-eCFP (R46I-eCFP) at 48 HAT. (D) Measurement of cytochrome c in cytosol of HeLa cells at different time points after transfection. Cytosolic proteins were separated by SDS-PAGE. Cytochrome c (cyt c) was detected by anti-cytochrome c antibody. GAPDH was detected by anti-GAPDH antibody and served as protein loading control. (E) Percentage of apoptotic and necrotic cells counted by flow cytometry analysis at 24 HAT in the presence of 20 μM z-VAD. The experiments were repeated three times with similar results, and the representative images or results are presented.
Figure 6.
Figure 6.
XA10 Is Localized to the ER Membrane. (A) Subcellular localization of XA10-mCherry and eGFP-RcDGAT2 in leaf cells of N. benthamiana. Images were taken at 24 HAI. N, nucleus. Bar = 10 μm. (B) Subcellular localization of XA10-mRFP and eGFP-Sec61β in HeLa cells. Images were taken at 18 HAT. Bar = 10 μm. (C) Topography study of XA10 on the ER membrane in rice protoplasts. Protoplasts of rice leaf sheath cells expressing mCherry, mCherry-HDEL, mCherry-XA10, and XA10-mCherry were fixed at 5 HAT and permeabilized using either digitonin (left panel) or Triton X-100 (right panel) before immunofluorescence labeling with anti-RFP monoclonal antibody. Bars = 10 μm. The experiments were repeated at least three times with similar results, and the representative results are shown here.
Figure 7.
Figure 7.
XA10 Forms Oligomers on the ER Membrane. (A) FRET analysis for interaction between XA10-eGFP and XA10-mCherry coexpressed in N. benthamiana leaf cells. Pseudocolored bar of FRET is indicated. N, nucleus. Bars = 10 μm. (B) Co-IP analysis for protein interaction between XA10-mCherry and XA10-3xFlag coexpressed in rice protoplasts. XA10-mCherry was detected with anti-mRFP antibody while XA10-3xFlag was probed with anti-Flag antibody. (C) Detection of XA10-3xFlag oligomers using BN-PAGE. 3xFlag-tagged proteins were detected with anti-Flag antibody. XA10-3xFlag oligomers are indicated with arrows. MW, molecular mass; pC1300, control empty vector. (D) Measurement of molecular size of XA10-3xFlag oligomers. The second-order polynomial best fit was used to plot the retention factor (Rf) values versus log molecular mass. The asterisk denotes the position of XA10-3xFlag hexamer on the curve. Experiments were repeated at least three times. The data shown here are the representative results of one typical experiment.
Figure 8.
Figure 8.
XA10 Induces Calcium Depletion from the ER. (A) and (B) Pseudocolor ratio (FRET/CFP) images (A) and average emission ratios (FRET/CFP) (B) of YC4.60ER in the ER of N. benthamiana leaf cells coexpressing YC4.60ER with mCherry, XA10-mCherry, or R46I-mCherry (XA10R46I-mCherry). Original images were taken at 24 HAI. Cell numbers measured in (B): mCherry, n = 39; XA10-mCherry, n = 32; R46I-mCherry, n = 45. N, nucleus. Bars = 10 μm. (C) and (D) Pseudocolor ratio (FRET/CFP) images (C) and average emission ratios (FRET/CFP) (D) of YC3.60 in cytosol of N. benthamiana leaf cells coexpressing YC3.60 with mCherry, XA10-mCherry, or XA10R46I-mCherry (R46I-mCherry). Original images were taken at 24 HAI. Cell numbers measured in (D): mCherry, n = 36; XA10-mCherry, n = 50; R46I-mCherry, n = 42. Bars = 10 μm. (E) and (F) Pseudocolor ratio (FRET/CFP) images (E) and average emission ratios (FRET/CFP) (F) of D1ER in the ER of HeLa cells coexpressing D1ER with mRFP, XA10-mRFP, or R46I-mRFP (XA10R46I-mRFP). Original images were taken at 14 HAT. Cell numbers measured in (F): mRFP, n = 64; XA10-mRFP, n = 65; R46I-mRFP, n = 85. Bars = 10 μm. (G) and (H) Pseudocolor ratio (FRET/CFP) images (G) and average emission ratios (FRET/CFP) (H) of 4mtD3cpv in mitochondria of HeLa cells coexpressing 4mtD3cpv with mRFP, XA10-mRFP, or R46I-mRFP. Calcium concentration was measured with Ca2+ indicator 4mtD3cpv. Original images were taken at 14 HAT. Cell numbers measured in (H): mRFP, n = 55; XA10-mRFP, n = 66; R46I-mRFP, n = 59. Bars = 10 μm. (I) Change of average emission ratios (FRET/CFP) of YC4.60ER in the ER of N. benthamiana cells coexpressing YC4.60ER with mCherry, XA10-mCherry, or XA10R46I-mCherry for over 64.5 min. Original images were traced at ∼24 to 27 HAI. (J) Change of average emission ratios (FRET/CFP) of D1ER in the ER of HeLa cells coexpressing D1ER with mRFP, XA10-mRFP, or XA10R46I-mRFP for over 150 min. Original images were traced at ∼14 to 18 HAT. The experiments were repeated at least three times, and the representative results are presented here. Pseudocolor scale bars indicate the FRET:CFP ratio.

Similar articles

Cited by

References

    1. Abas L., Luschnig C. (2010). Maximum yields of microsomal-type membranes from small amounts of plant material without requiring ultracentrifugation. Anal. Biochem. 401: 217–227 - PMC - PubMed
    1. Ali R., Ma W., Lemtiri-Chlieh F., Tsaltas D., Leng Q., von Bodman S., Berkowitz G.A. (2007). Death don’t have no mercy and neither does calcium: Arabidopsis CYCLIC NUCLEOTIDE GATED CHANNEL2 and innate immunity. Plant Cell 19: 1081–1095 - PMC - PubMed
    1. Antonsson B., et al. (1997). Inhibition of Bax channel-forming activity by Bcl-2. Science 277: 370–372 - PubMed
    1. Antony G., Zhou J., Huang S., Li T., Liu B., White F., Yang B. (2010). Rice xa13 recessive resistance to bacterial blight is defeated by induction of the disease susceptibility gene Os-11N3. Plant Cell 22: 3864–3876 - PMC - PubMed
    1. Arabidopsis Genome Initiative (2000). Analysis of the genome sequence of the flowering plant Arabidopsis thaliana. Nature 408: 796–815 - PubMed

Publication types

Associated data

LinkOut - more resources