. 2014 Mar;164(3):1350-64.
doi: 10.1104/pp.113.233312. Epub 2014 Jan 31.

Differential methylation during maize leaf growth targets developmentally regulated genes

Affiliations

Differential methylation during maize leaf growth targets developmentally regulated genes

Jasper Candaele et al. Plant Physiol. 2014 Mar.

Abstract

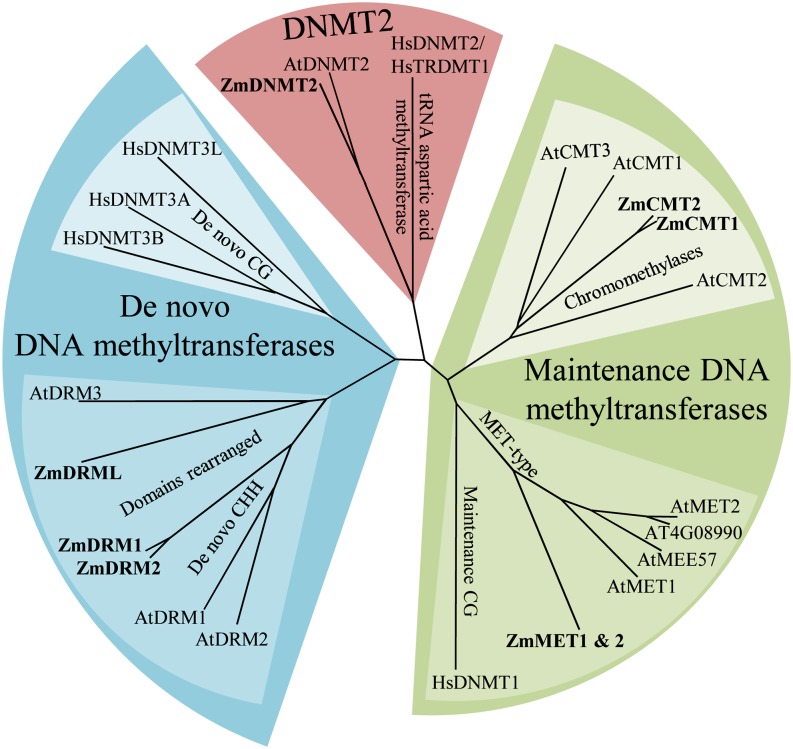
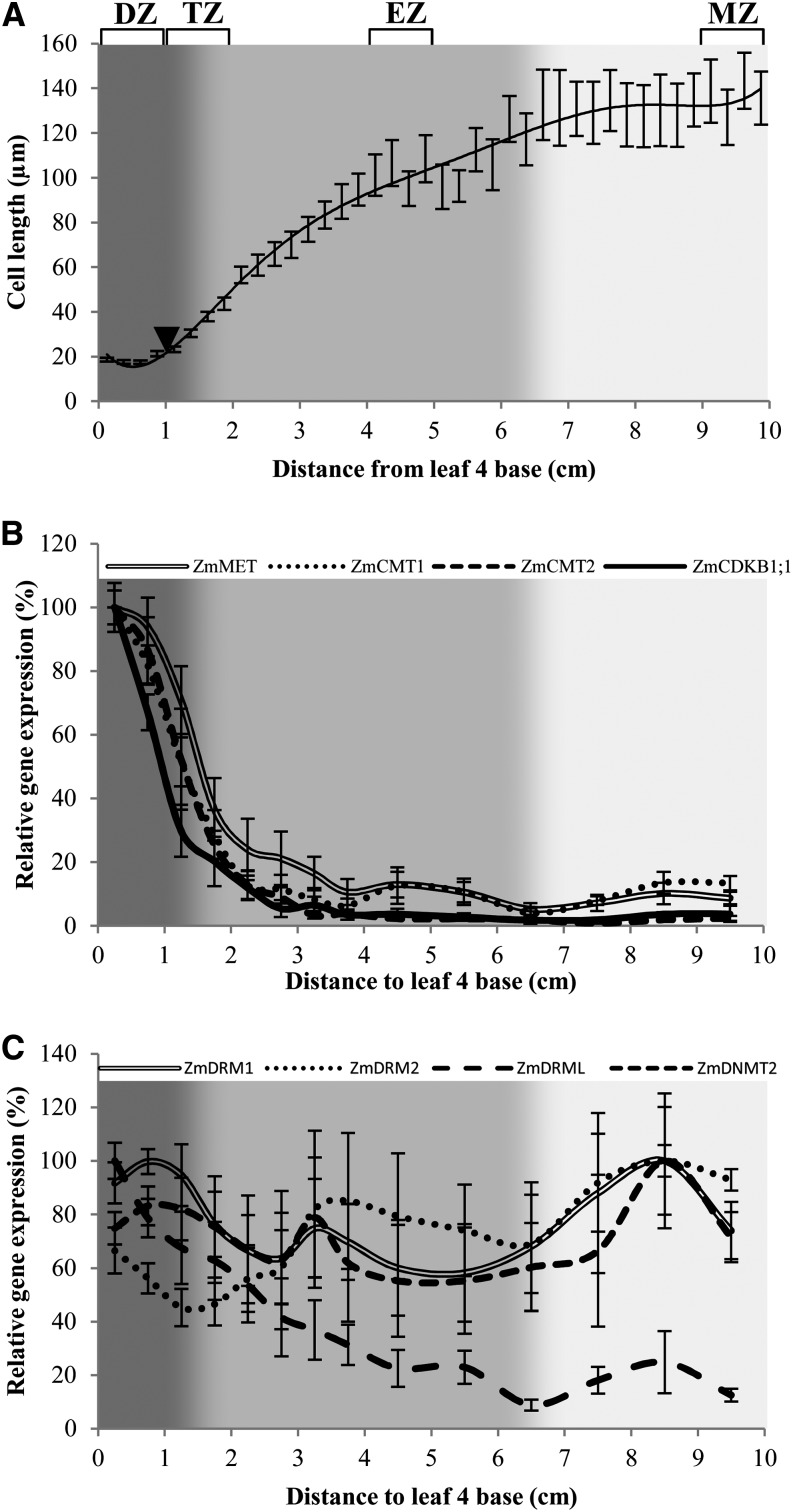
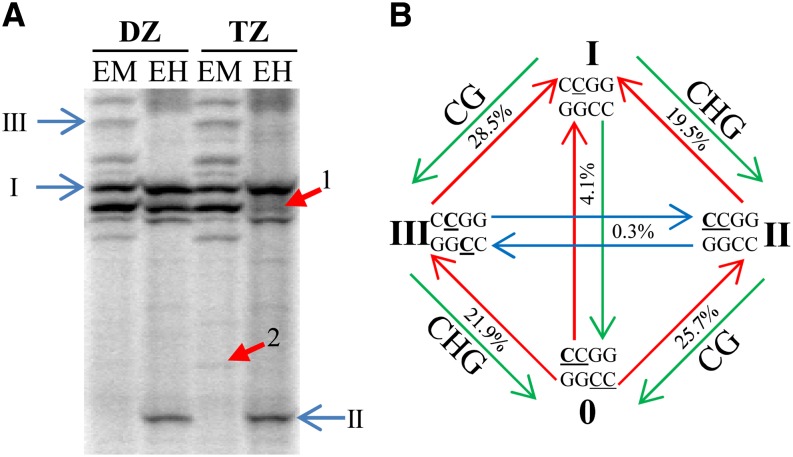
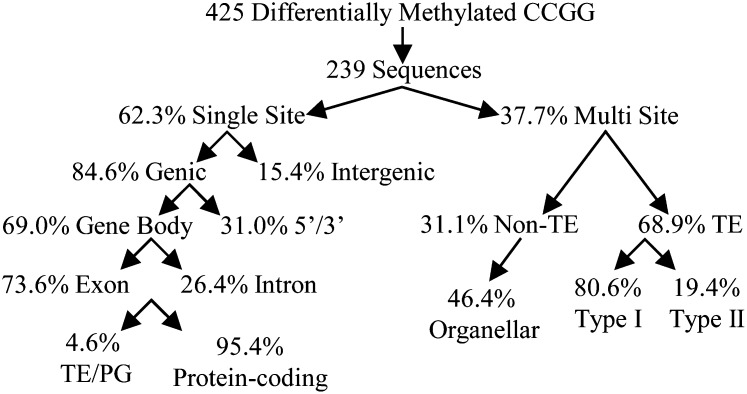
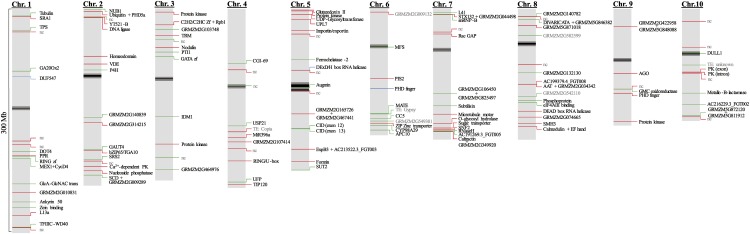
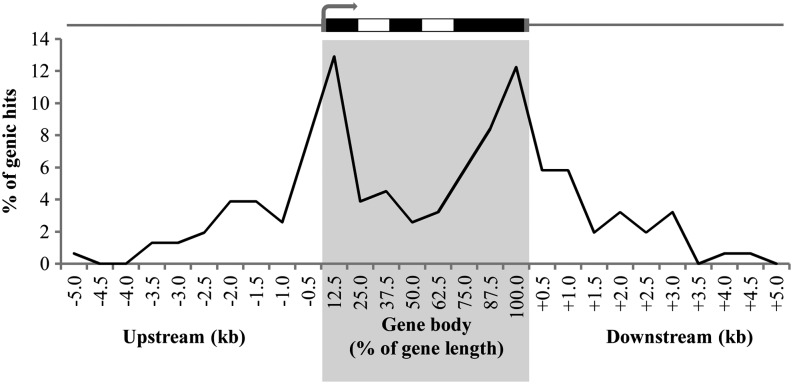
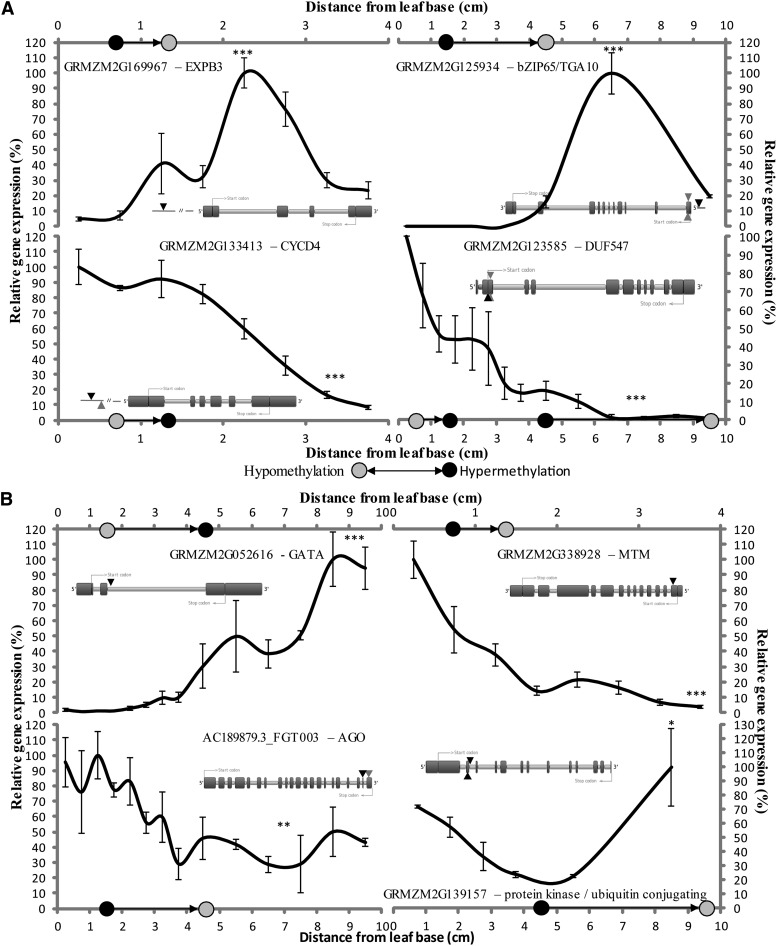
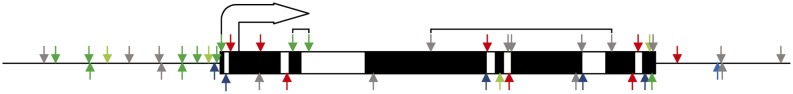
DNA methylation is an important and widespread epigenetic modification in plant genomes, mediated by DNA methyltransferases (DMTs). DNA methylation is known to play a role in genome protection, regulation of gene expression, and splicing and was previously associated with major developmental reprogramming in plants, such as vernalization and transition to flowering. Here, we show that DNA methylation also controls the growth processes of cell division and cell expansion within a growing organ. The maize (Zea mays) leaf offers a great tool to study growth processes, as the cells progressively move through the spatial gradient encompassing the division zone, transition zone, elongation zone, and mature zone. Opposite to de novo DMTs, the maintenance DMTs were transcriptionally regulated throughout the growth zone of the maize leaf, concomitant with differential CCGG methylation levels in the four zones. Surprisingly, the majority of differentially methylated sequences mapped on or close to gene bodies and not to repeat-rich loci. Moreover, especially the 5' and 3' regions of genes, which show overall low methylation levels, underwent differential methylation in a developmental context. Genes involved in processes such as chromatin remodeling, cell cycle progression, and growth regulation, were differentially methylated. The presence of differential methylation located upstream of the gene anticorrelated with transcript expression, while gene body differential methylation was unrelated to the expression level. These data indicate that DNA methylation is correlated with the decision to exit mitotic cell division and to enter cell expansion, which adds a new epigenetic level to the regulation of growth processes.


Figures

Figure 1.
Figure 1.
Phylogeny of the DMT domain enzymes of maize (Zm), Arabidopsis (At), and humans (Hs). Three types of methyltransferase enzymes can be distinguished: maintenance (green), de novo (blue), and DNMT2-like (red). The maize proteins are indicated in boldface. Maintenance methyltransferase enzymes fall into two categories: the DMTs that methylate the CG motif (dark green) and are conserved between animals (DNMT1) and plants (MET), and the plant-specific DMTs that methylate the CHG motif (CMTs; light green). ZmMET1 and ZmMET2 are 99.4% identical and, therefore, are indicated as one branch. Animal and plant de novo methyltransferases differ in the arrangement of the methylase domains, causing a difference in target motifs: CG in animals (DNMT3; light blue) and CHH in plants (DRM; dark blue). The DNMT2 lineage encodes a DMT domain, but they are most likely RNA methyltransferase enzymes, as animal DNMT2 was found to methylate Asp tRNA, and was renamed tRNA ASPARTIC ACID METHYLTRANSFERASE1. [See online article for color version of this figure.]
Figure 2.
Figure 2.
Cellular profile and DMT expression along the maize leaf. A, Cellular behavior throughout the first 10 cm of maize leaf 4, 2 d after its emergence, with the first 1 cm consisting of small, dividing cells (DZ), followed by a transition (TZ) toward elongating tissue (EZ), and finally matured cells (MZ). The samples for MSAP representing these tissues are indicated on top (braces), as is the end of the DZ (arrowhead). DMT expression was checked across the whole maize leaf. B and C, Maize maintenance methyltransferase (ZmMET, ZmCMT1, and ZmCMT2) expression (B) is highest in the dividing cells at the base of the maize leaf. The expression sharply decreases until reaching minimal levels 3 to 4 cm from the leaf base. A very analogous expression pattern is found for CDKB1;1, the expression of which is highly correlated with cell division activity (Rymen et al., 2007; Nelissen et al., 2012). The de novo methyltransferases (C) ZmDRM1 and ZmDRM2 are expressed steadily across the zones, as is ZmDNMT2. ZmDRML, on the other hand, has an expression profile similar to the maintenance DMTs.
Figure 3.
Figure 3.
Example and explanation of the MSAP gel-banding pattern. A, MSAP gel comparing pools of DZ and TZ samples. Each sample is restricted by EcoRI + MspI (EM) and EcoRI + HpaII (EH). Both stably (I, II, and III) and differentially (1, I→III; 2, 0→III) methylated sites are represented, for which the explanation is provided in B. B, I, Nonmethylated CCGG; II, CHG methylation, where H = C; III, CG methylation; 0, heavy CCGG methylation. For additional information, see Supplemental Table S2. Briefly, CCGG means either methylation of both cytosines (CCGG) or only the outer cytosine (CCGG). Differential methylation is indicated by arrows: hypomethylation (red), hypermethylation (green), and both hypomethylation and hypermethylation (blue). A change from 0 to any other MSAP pattern from one zone to the next means hypomethylation. Similarly, a change from I to any other MSAP pattern signifies hypermethylation. Only a change from II to III and III to II can be interpreted as both hypomethylation and hypermethylation of the locus. The overall occurrence of each transition (sum of both hypomethylation and hypermethylation percentages) is represented. The sequence context affected, being either CG or CHG, is indicated at the edges. [See online article for color version of this figure.]
Figure 4.
Figure 4.
Identification of differentially methylated sequences. Differentially methylated bands were amplified and sequenced. Successful sequences were BLASTed against the maize cv B73 genome (version 5b.60). Sequences mapping to a single location (single site) either map in or in close proximity to a gene (genic) or not (intergenic). Genic sequences map either to a transcript-coding region (gene body) or upstream/downstream from it (5′/3′). Most gene body methylation was found in exons of protein-coding genes. Sequences mapping to multiple sites in the maize genome were either TEs, mapping to numerous sites in the maize genome, or mapped to a limited number of sites in the genome (non-TE). Most TEs are type I (retro)transposons, and about half of the oligomapping sequences had at least one copy on the plastid of the mitochondrial genome (organellar).
Figure 5.
Figure 5.
Mapping of differentially methylated single-locus sequences. All single-locus differentially methylated sequences that mapped to the 10 maize chromosomes are represented. Hypermethylated sequences are indicated in green, hypomethylated sequences are indicated in red, and sequences that undergo both hypomethylation and hypermethylation are indicated in blue. Hits that are not in the vicinity of coding regions are indicated as noncoding (nc) in gray. Pseudogenes and TEs are also indicated in gray. Genes that have a known function, homology, or discernible domain are indicated as such, and the other genes are indicated by their gene code. If the differentially methylated locus lies in the vicinity of two protein-coding genes, both are mentioned. Centromeres and pericentromeric regions are indicated in black and dark gray, respectively.
Figure 6.
Figure 6.
Locations of genic hits with respect to the gene body. The positions of all genic hits were plotted up to 5 kb upstream and downstream of the gene. To adjust for different gene lengths and the presence of introns, the genic position is expressed as a percentage of the gene body length, with 0% and 100% representing the start and end of the transcript, respectively. A canonical gene model is represented above the graph, with exons, introns, and untranslated regions indicated in black, white, and dark gray, respectively.
Figure 7.
Figure 7.
Expression of genes undergoing differential methylation in the 5′ region (A) and in the remainder of the gene body (B). A, Relative expression of genes undergoing differential methylation in the promoter or 5′ region of the gene body. The CCGG sites of EXPB3, TGA10, and CYCD4 are found in the promoter, whereas for DUF547 it is located immediately downstream of the start codon (ATGGCCGG). B, Relative expression of genes undergoing differential methylation in the remainder of the gene body. The CCGG sites of MTM (for microtubule motor family protein, or kinesin) and AGO are found in an exon and that of GATA is found in an intron. The PK/UbiC-encoding gene has two differentially methylated CCGG sites, found in an exon and the following intron. Zones between which methylation changes take place (DZ-TZ, TZ-EZ, and EZ-MZ) are indicated by black arrows. The location of differential methylation with respect to the gene is represented by a black arrowhead on the gene model. If other possible differential methylation CCGG sites are present, they are indicated by gray arrowheads. *P = 0.01–0.05, **P = 0.001–0.01, ***P ≤ 0.001.
Figure 8.
Figure 8.
Summary of quantitative PCR expression data in relation to differential methylation. Correlation between differential methylation and expression is indicated as colored arrows. A green arrow indicates that a methylation change at this site led to up-regulation or down-regulation of a profiled gene, after it was hypomethylated or hypermethylated, respectively. A light green arrow means the differential expression was not found to be significant at the 5% level. A red arrow indicates an opposing effect: hypomethylation leading to down-regulation or hypermethylation leading to up-regulation. A blue arrow means that the gene was not found to be differentially expressed, and a gray arrow indicates a gene for which no expression in the sampled zones of the maize leaf could be found. Arrows that are linked represent methylation changes within the same gene. The gene is represented, from start codon to stop codon, as a rectangle, with exons in black and introns in white. The site of the start codon is indicated as an arrow.

Similar articles

Cited by

References

    1. Andriankaja M, Dhondt S, De Bodt S, Vanhaeren H, Coppens F, De Milde L, Mühlenbock P, Skirycz A, Gonzalez N, Beemster GTS, et al. (2012) Exit from proliferation during leaf development in Arabidopsis thaliana: a not-so-gradual process. Dev Cell 22: 64–78 - PubMed
    1. Ayliffe MA, Scott NS, Timmis JN. (1998) Analysis of plastid DNA-like sequences within the nuclear genomes of higher plants. Mol Biol Evol 15: 738–745 - PubMed
    1. Baucom RS, Estill JC, Chaparro C, Upshaw N, Jogi A, Deragon JM, Westerman RP, Sanmiguel PJ, Bennetzen JL. (2009) Exceptional diversity, non-random distribution, and rapid evolution of retroelements in the B73 maize genome. PLoS Genet 5: e1000732. - PMC - PubMed
    1. Cao X, Springer NM, Muszynski MG, Phillips RL, Kaeppler S, Jacobsen SE. (2000) Conserved plant genes with similarity to mammalian de novo DNA methyltransferases. Proc Natl Acad Sci USA 97: 4979–4984 - PMC - PubMed
    1. Cervera MT, Ruiz-García L, Martínez-Zapater JM. (2002) Analysis of DNA methylation in Arabidopsis thaliana based on methylation-sensitive AFLP markers. Mol Genet Genomics 268: 543–552 - PubMed

Publication types

MeSH terms

Substances

LinkOut - more resources