. 2014 Mar;113(4):643-52.
doi: 10.1093/aob/mct298. Epub 2014 Jan 31.

GPT2: a glucose 6-phosphate/phosphate translocator with a novel role in the regulation of sugar signalling during seedling development

Affiliations

GPT2: a glucose 6-phosphate/phosphate translocator with a novel role in the regulation of sugar signalling during seedling development

Beth C Dyson et al. Ann Bot. 2014 Mar.

Abstract

Background and aims: GPT2, a glucose 6-phosphate/phosphate translocator, plays an important role in environmental sensing in mature leaves of Arabidopsis thaliana. Its expression has also been detected in arabidopsis seeds and seedlings. In order to examine the role of this protein early in development, germination and seedling growth were studied.

Methods: Germination, greening and establishment of seedlings were monitored in both wild-type Arabidopsis thaliana and in a gpt2 T-DNA insertion knockout line. Seeds were sown on agar plates in the presence or absence of glucose and abscisic acid. Relative expression of GPT2 in seedlings was measured using quantitative PCR.

Key results: Plants lacking GPT2 expression were delayed (25-40 %) in seedling establishment, specifically in the process of cotyledon greening (rather than germination). This phenotype could not be rescued by glucose in the growth medium, with greening being hypersensitive to glucose. Germination itself was, however, hyposensitive to glucose in the gpt2 mutant.

Conclusions: The expression of GPT2 modulates seedling development and plays a crucial role in determining the response of seedlings to exogenous sugars during their establishment. This allows us to conclude that endogenous sugar signals function in controlling germination and the transition from heterotrophic to autotrophic growth, and that the partitioning of glucose 6-phosphate, or related metabolites, between the cytosol and the plastid modulates these developmental responses.

Keywords: Arabidopsis thaliana; GPT2; Germination; glucose; greening; seedling development; sugar signalling.


Figures
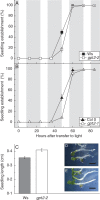
Fig. 1.
Fig. 1.
Seedling establishment in wild-type and gpt2 plants. Seeds of wild-type Arabidopsis thaliana Ws-2 and Col 0 and their respective T-DNA insertion knockouts of GPT2 (gpt2-2 and gpt2-1) were sown on half-strength MS, 1·5 % agar plates after surface sterilization with 10 % bleach. After a 3-day stratification in the dark at 4 °C, plates were moved to 100 μmol m2 s−1 light on an 8-h photoperiod (shaded areas represent dark periods and unshaded areas represent photoperiods). (A, B) Seedling establishment was scored every 12 h as the presence of fully open green cotyledons. Between 50 and 150 seeds were sown on each plate, and each data point represents the mean of three to five plates. Error bars represent ±1 s.e. (C) Seedling lengths were measured in Ws-2 wild-type and gpt2-2 plants after three full photoperiods in the light by photographing the plates under a dissection microscope and analysing with ImageJ (National Institutes of Health, USA). Error bars represent ±1 s.e. Significance was determined using two-way ANOVA with a post hoc test, Tukey's B test (SPSS). (D) Representative wild-type seedlings. (E) Representative gpt2 seedlings. Scale bars = 8 mm.
Fig. 2.
Fig. 2.
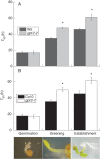
Mean time taken for 50 % (T50) of seeds/seedlings to achieve germination, greening and establishment (illustrated at bottom) in wild-type and gpt2 plants on MS. Seeds of Ws-2, Col 0, gpt2-2 and gpt2-1 lines were sown, stratified and transferred to light as for seedling development assays. Germination was scored as the emergence of the radicle from the seed coat, greening as the presence of green cotyledons and establishment as the presence of fully open green cotyledons. Seeds of Ws-2 and gpt2-2 (A) and Col 0 and gpt2-1 (B) were examined every 12 h, and percentages of germination, greening and establishment were calculated for each plate on the basis of the number of seeds sown. These data were graphed and sigmoidal curves based on growth parameters were fitted (see Supplementary Data Figs 1 and 2). The mean time taken for 50 % (T50) of seeds/seedlings to achieve germination, greening and establishment was extrapolated from these graphs. Each data point is the mean of three to five replicate plates. Pictures show a representative example of the relevant developmental stage. Error bars represent ±1 s.e. ANOVAs were carried out separately on germination, greening and establishment data, and asterisks show significant differences (P ≤ 0·05) between lines at a particular developmental stage.
Fig. 3.
Fig. 3.
Germination and greening profiles of wild-type and gpt2 seedlings on different concentrations of glucose. Seeds of Ws-2, Col 0, gpt2-2 and gpt2-1 lines were sterilized and sown on plates containing half-strength MS, 1·5 % agar and various concentrations of glucose. Seeds were scored every 12 h for germination or the presence of green cotyledons. Percentage greening was calculated for each plate on the basis of the number of seeds sown and each data point is the mean of three to five replicate plates. Error bars represent ±1 s.e. (A, E) Germination and greening in Ws-2 wild-type plants. (B, F) Germination and greening in gpt2-2 plants. (C, G) Germination and greening in Col 0 wild-type plants. (D, H) Germination and greening in gpt2-1 plants.
Fig. 4.
Fig. 4.
Mean time taken for 50 % (T50) of seeds/seedlings to achieve germination and greening on different growth media. Seeds of wild-type Ws-2 and gpt2-2 plants were grown on half-strength MS, 4 % glucose or equivalent osmotic potential 4 % PEG-8000 half-strength MS plates. Seeds were sterilized and sown as for seedling development assays. After a 2- to 3-day stratification at 4 °C in the dark, plates were transferred to 100 μmol m2 s−1 light (8 h day/16 h night) and germination (A) and greening (B) were scored every 12 h as the emergence of the radicle and presence of green cotyledons, respectively. Percentage germination/greening over time was also graphed (see Supplementary Data Figs 3 and 4) and curves were fitted to extrapolate the average time for 50 % (T50) of seeds/seedlings to germinate/green. Wild-type and gpt2 plants are as indicated in the key. Bars represent the mean of at least three replicate plates (150–300 seedlings). Error bars represent ±1 s.e.
Fig. 5.
Fig. 5.
Development of wild-type and gpt2 plants on media containing ABA. Seeds were sterilized as for seedling development assays and sown into half-strength MS or half-strength MS medium with 1–10 μm ABA. After a 2-day stratification at 4 °C in the dark, plants were transferred to 8 h day/16 h night at an irradiance of 100 μmol m−2 s−1 white fluorescent light for 7 days. Germination was scored as the emergence of the radicle (and subsequent growth). (A–D) Representative plates showing wild-type on half-strength MS (A), gpt2 on half-strength MS (B), wild-type on half-strength MS with 10 μm ABA (C) and gpt2 on half-strength MS with 10 μm ABA (D). Inset figures show five representative seeds/seedlings for each line/treatment. Black scale bars = 20 mm, white scale bars = 5 mm. (E) Mean percentage germination for each line/treatment on different concentrations of ABA. Each measurement represents the mean of at least three replicate plates, each plate containing at least 150 seeds. Error bars represent ±1 s.e.
Fig. 6.
Fig. 6.
Expression of GPT2 during early seedling development on glucose. Seeds were sterilized, stratified, sown and transferred to light as for seedling development assays, with the inclusion of 4 % glucose or PEG-8000 of the equivalent osmotic potential to the medium. GPT2 expression was examined in seedlings after transfer to light, with samples of 200–250 seedlings flash-frozen in liquid nitrogen at the end of each photoperiod. Frozen seedlings were stored at −80 °C. Fold changes shown were calculated relative to levels of ACT2 expression and are displayed relative to the expression level on half-strength MS at each time point. Shaded areas represent dark periods and unshaded areas represent photoperiods. Data expressed relative to UBC are qualitatively identical. Error bars represent ±1 s.e. Plants grown on half-strength MS only, grown on half-strength MS with PEG-8000 with an equivalent osmotic potential to 4 % glucose, and grown on half-strength MS with 4 % glucose are as indicated in the key.

References

    1. Albrecht V, Ingenfeld A, Apel K. Characterization of the snowy cotyledon 1 mutant of Arabidopsis thaliana: the impact of chloroplast elongation factor G on chloroplast development and plant vitality. Plant Molecular Biology. 2006;60:507–518. - PubMed
    1. Athanasiou K, Dyson BC, Webster RE, Johnson GN. Dynamic acclimation of photosynthesis increases plant fitness in changing environments. Plant Physiology. 2010;152:366–373. - PMC - PubMed
    1. Baker A, Graham IA, Holdsworth M, Smith SM, Theodoulou FL. Chewing the fat: β-oxidation in signalling and development. Trends in Plant Science. 2006;11:124–132. - PubMed
    1. Baskin JM, Baskin CC. A classification system for seed dormancy. Seed Science Research. 2004;14:1–16.
    1. Bentsink L, Hanson J, Hanhart CJ, et al. Natural variation for seed dormancy in Arabidopsis is regulated by additive genetic and molecular pathways. Proceedings of the National Academy of Sciences of the USA. 2010;107:4264–4269. - PMC - PubMed

Publication types

MeSH terms