

Acetylation dynamics and stoichiometry in Saccharomyces cerevisiae
- PMID: 24489116
- PMCID: PMC4023402
- DOI: 10.1002/msb.134766
Acetylation dynamics and stoichiometry in Saccharomyces cerevisiae
Erratum in
-
Acetylation dynamics and stoichiometry in Saccharomyces cerevisiae.Mol Syst Biol. 2015 Oct 26;11(10):833. doi: 10.15252/msb.156513. Mol Syst Biol. 2015. PMID: 26502892 Free PMC article. No abstract available.
Abstract
Lysine acetylation is a frequently occurring posttranslational modification; however, little is known about the origin and regulation of most sites. Here we used quantitative mass spectrometry to analyze acetylation dynamics and stoichiometry in Saccharomyces cerevisiae. We found that acetylation accumulated in growth-arrested cells in a manner that depended on acetyl-CoA generation in distinct subcellular compartments. Mitochondrial acetylation levels correlated with acetyl-CoA concentration in vivo and acetyl-CoA acetylated lysine residues nonenzymatically in vitro. We developed a method to estimate acetylation stoichiometry and found that the vast majority of mitochondrial and cytoplasmic acetylation had a very low stoichiometry. However, mitochondrial acetylation occurred at a significantly higher basal level than cytoplasmic acetylation, consistent with the distinct acetylation dynamics and higher acetyl-CoA concentration in mitochondria. High stoichiometry acetylation occurred mostly on histones, proteins present in histone acetyltransferase and deacetylase complexes, and on transcription factors. These data show that a majority of acetylation occurs at very low levels in exponentially growing yeast and is uniformly affected by exposure to acetyl-CoA.
Figures
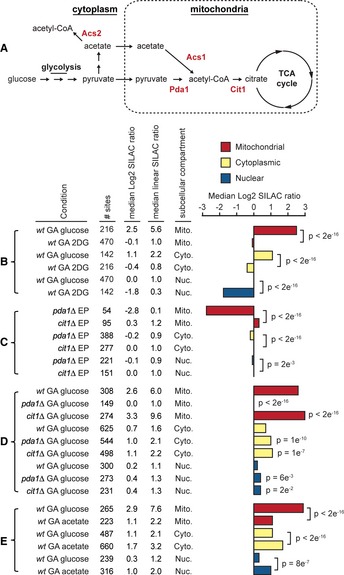
- A
Model showing the formation of acetyl‐
C oA from glucose and acetate, key enzymes are shown in red type. - B–E
The figure shows the conditions analyzed in each experiment, the cell type (wild‐type (wt) or indicated mutant strains), the growth state [exponential phase (
EP ) or growth‐arrested (GA )], the number of acetylation sites analyzed (# sites), the medianL og2 and linearSILAC ratios comparing the indicated condition to wild‐typeEP cells, and the subcellular localization of the analyzed acetylation sites on proteins localized to mitochondria (M ito.), the cytoplasm (C yto.), or the nucleus (N uc.). Cells were growth‐arrested by transferring an exponential phase culture into media lacking lysine and containing the indicated carbon sources, glucose, acetate, or 2‐deoxy‐d ‐glucose (2DG ). The bar chart shows the medianL og2SILAC ratios comparing the indicated condition to wild‐typeEP cells, statistical significance was calculated byW ilcoxon test. Increased acetylation requires glycolysis (B). Data is from two biological replicates. Mitochondrial acetylation in exponentially growing cells requiresP da1 (C). Increased mitochondrial acetylation in growth‐arrested cells is suppressed by loss ofP da1 and enhanced by loss ofC it1 (D). Data from two biological replicates is shown, significant differences are relative to wild‐type cells. Acetate promotes cytoplasmic and nuclear acetylation (E). Data is from two biological replicates.
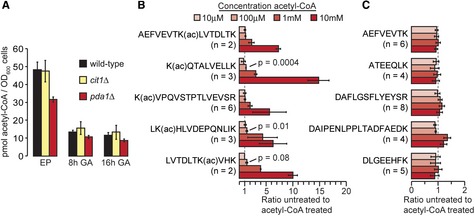
Acetyl‐
C oA concentration was determined in the indicated cell types during exponential phase (EP ) growth or after the indicated time of growth‐arrest (GA ) in the presence of glucose. Data are from two independent biological replicates.The bar graph shows the abundance of the indicated, acetylated (ac) peptides relative to an untreated control sample. Error bars indicate standard deviation of the indicated number (n) of independently quantified peptides. The significance (P) of increased acetylation at 100 μM acetyl‐
C oA was calculated by two‐tailed t‐test assuming equal variance.The column graph shows the relative abundance of non‐acetylated peptides. Error bars indicate standard deviation of the indicated number (n) of independently quantified peptides.
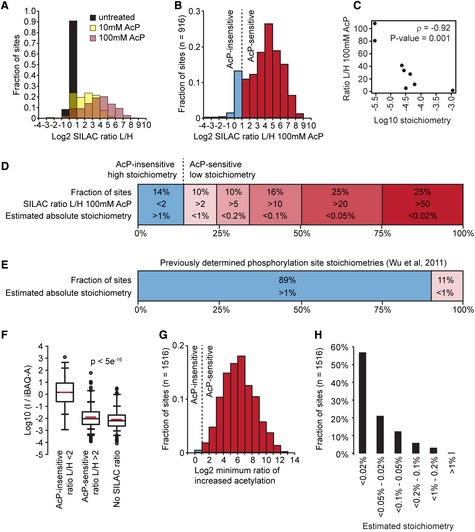
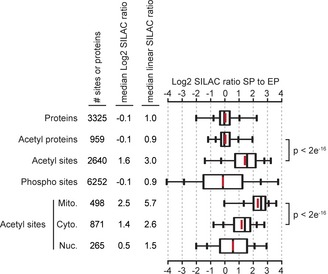
The majority of yeast acetylation sites are highly sensitive to partial chemical acetylation by
A cP . The histogram shows the distribution ofSILAC L /H ratios for the indicated samples.Ac
P caused substantially increased acetylation at a majority of sites. The histogram shows acetylation changes induced by 100 mMA cP in two experimental replicates, only sites that were independently identified in cells withoutA cP treatment are shown.Acetylation stoichiometry is inversely proportional to
A cP ‐sensitivity. The scatterplot shows the relationship betweenA cP ‐sensitivity (SILAC ratioL /H 100 mMA cP ) and acetylation stoichiometry (L og10 stoichiometry) as determined byAQUA analysis (Table 1). The Spearman's correlation (ρ) and the significance by two‐tailed test (P‐value) are shown.Most acetylation occurs with a low stoichiometry. Absolute acetylation site stoichiometries were estimated based on relative abundance changes (
SILAC ratioL /H ) after treatment with 100 mMA cP and using an estimate thatA cP treatment caused < 1% chemical acetylation.For comparison, previously determined phosphorylation site stoichiometries are shown (Wu et al, 2011).
iBAQ ‐based abundance corrected acetylated peptide intensity (I /iBAQ ‐A ) is proportional toA cP sensitivity. The box plots show the distributions ofI /iBAQ ‐A values for the indicated classes of acetylation sites. AcP ‐insensitive sites had a significantly (p) higher distribution ofI /iBAQ ‐A values compared to eitherA cP ‐sensitive sites or sites withoutSILAC ratios. Significance was calculated byW ilcoxen test.Sites without
SILAC ratios are highly sensitive toA cP . The minimum ratio of increased acetylation was determined by calculating the increased intensity ofA cP ‐treated “light” peptides relative to an empirically determined detection limit for “heavy”SILAC peptides (see Materials and Methods).Absolute acetylation stoichiometry of sites without
SILAC ratios was estimated to be very low. Stoichiometry was estimated by the same method used to estimate stoichiometry of sites withSILAC ratios in (D) using the minimum ratios of increased acetylation shown in (G).
Ac
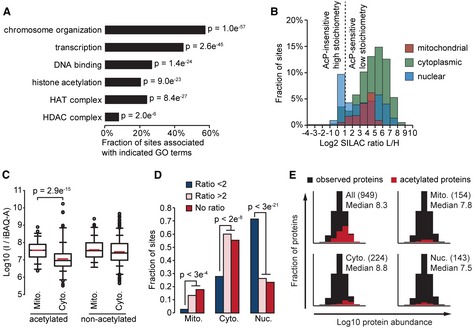
P ‐insensitive acetylation sites occur on proteins associated with nuclear processes. Gene Ontology (GO ) term enrichment was performed by comparing proteins withA cP ‐insensitive acetylation sites (ratioL /H < 2) to all acetylated proteins. The bar graph shows the percentage ofA cP ‐insensitive sites occurring on proteins associated with the indicatedGO terms. P‐values (P) indicate the statistical significance ofGO term enrichment by Fisher's exact test.Ac
P ‐insensitive acetylation sites occur on nuclear proteins. The histogram shows the distribution ofSILAC L /H ratios occurring on proteins localized to the indicated subcellular compartments.Acetylated peptides from mitochondrial proteins have a significantly higher median
I /iBAQ ‐A value compared to acetylated peptides from cytoplasmic proteins. The box plots show theI /iBAQ ‐A distributions for the indicated classes of peptides occurring on mitochondrial (M ito.) or cytoplasmic (C yto.) proteins. Signficance (p) was determined byW ilcoxon test.Ac
P ‐insensitive sites (SILAC Ratio < 2) have a significantly different subcellular distribution. Sites withoutSILAC ratios (No ratio) have a similar subcellular distribution toA cP ‐sensitive sites (SILAC Ratio > 2). The bar graph shows the fraction of sites localized to the indicated subcellular compartments; mitochondria (M ito.), cytoplasm (C yto.), or nucleus (N uc.). Significance (P) was calculated by Fisher exact test.Detection of acetylation sites is biased to occur on abundant proteins and this bias is more pronounced for sites with the lowest estimated stoichiometries. The histograms show the distributions of
iBAQ protein abundances for observed proteins (n = 3,104). The distributions of the indicated classes of acetylated proteins occurring exclusively in the indicated subcellular compartments is shown in red. The numbers of acetylated proteins are shown in parenthesis and the medianL og10iBAQ abundance for these acetylated proteins is shown.
References
-
- Abad MF, Di Benedetto G, Magalhaes PJ, Filippin L, Pozzan T (2004) Mitochondrial pH monitored by a new engineered green fluorescent protein mutant. J Biol Chem 279: 11521–11529 - PubMed
Publication types
MeSH terms
Substances
LinkOut - more resources
Full Text Sources
Other Literature Sources
Molecular Biology Databases
