

Data-driven modeling reconciles kinetics of ERK phosphorylation, localization, and activity states
- PMID: 24489118
- PMCID: PMC4023404
- DOI: 10.1002/msb.134708
Data-driven modeling reconciles kinetics of ERK phosphorylation, localization, and activity states
Abstract
The extracellular signal-regulated kinase (ERK) signaling pathway controls cell proliferation and differentiation in metazoans. Two hallmarks of its dynamics are adaptation of ERK phosphorylation, which has been linked to negative feedback, and nucleocytoplasmic shuttling, which allows active ERK to phosphorylate protein substrates in the nucleus and cytosol. To integrate these complex features, we acquired quantitative biochemical and live-cell microscopy data to reconcile phosphorylation, localization, and activity states of ERK. While maximal growth factor stimulation elicits transient ERK phosphorylation and nuclear translocation responses, ERK activities available to phosphorylate substrates in the cytosol and nuclei show relatively little or no adaptation. Free ERK activity in the nucleus temporally lags the peak in nuclear translocation, indicating a slow process. Additional experiments, guided by kinetic modeling, show that this process is consistent with ERK's modification of and release from nuclear substrate anchors. Thus, adaptation of whole-cell ERK phosphorylation is a by-product of transient protection from phosphatases. Consistent with this interpretation, predictions concerning the dose-dependence of the pathway response and its interruption by inhibition of MEK were experimentally confirmed.
Figures
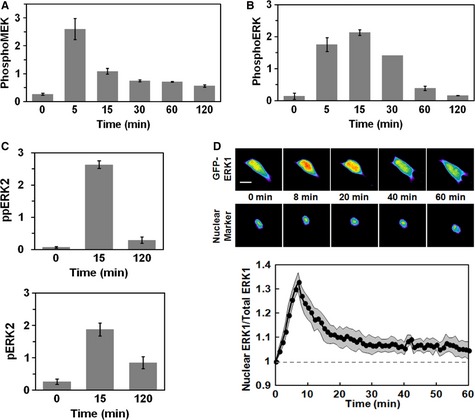
- A, B
NIH 3T3 cells were stimulated with 1 nM PDGF, and phosphorylation of MEK1/2 [(A); adapted from (Cirit et al, 2010)] and ERK1/2 (B) were assessed by quantitative immunoblotting along with total ERK1/2 as a loading control. Values are reported as mean ± s.e.m. in arbitrary units (n ≥ 3). - C
Label‐free quantitative mass spectrometry results show relative amounts of diphosphorylated ERK2 (pTEpY, top) and mono‐phosphorylated ERK2 (pTEY, bottom) in NIH 3T3 cells stimulated maximally with PDGF for the indicated times. Values are reported as mean ± s.e.m. (n = 3).
- D
NIH 3T3 cells expressing GFP‐ERK1 were monitored by epifluorescence microscopy during maximal PDGF stimulation. The pseudocolor montage shows redistribution of fluorescence in a representative cell (scale bar, 20 μm). Nuclei were labeled using a genetically encoded nuclear marker. Mean nuclear localization of ERK1, normalized by its initial value, is plotted as a function of time (solid line; n = 10); the gray region reports the 95% confidence interval.
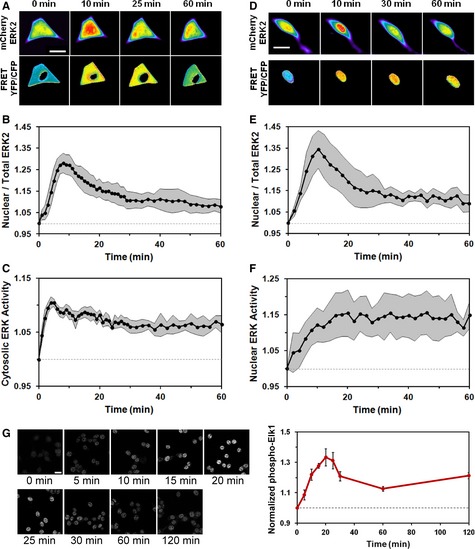
- A–C
NIH 3T3 cells co‐expressing mCherry‐ERK2 and cytosolic ERK kinase activity reporter (EKAR) were observed by epifluorescence microscopy during maximal PDGF stimulation. The pseudocolor montage (A) shows representative image data for this experiment (scale bar = 20 μm). Mean time courses of ERK2 nuclear localization (B) and cytosolic ERK activity (C) were measured in tandem (mean ± 95% confidence interval, n = 8).
- D–F
NIH 3T3 cells co‐expressing mCherry‐ERK2 and nuclear EKAR were observed by epifluorescence microscopy during maximal PDGF stimulation. The pseudocolor montage (D) shows representative image data for this experiment (scale bar = 20 μm). Time courses of nuclear localization (E) and nuclear ERK activity (F) were measured in tandem (mean ± 95% confidence interval, n = 6).
- G
Montage of a representative cell shows immunofluorescence staining of phosphorylated Elk‐1, an endogenous substrate of ERK in the nucleus, upon maximal PDGF stimulation (scale bar = 20 m). The plot shows the time course of phosphorylated, nuclear Elk‐1 (note that the time axis is expanded relative to E&F). Values were normalized by the initial value and are reported as mean ± s.e.m. (n = 3).
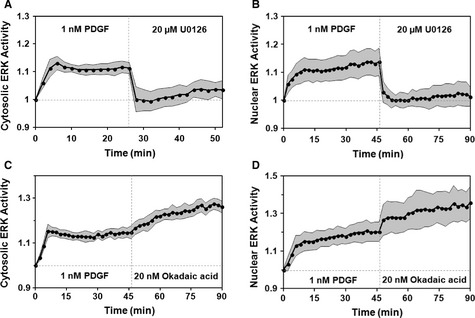
- A, B
Mean time courses of cytosolic [(A), n = 10] and nuclear [(B), n = 9]
ERK activities show responses to maximal PDGF treatment followed by addition of the MEK inhibitor, U0126. - C, D
Mean time courses of cytosolic [(C), n = 9] and nuclear [(D), n = 9] ERK activity in response to maximal PDGF stimulation followed by addition of the phosphatase inhibitor, okadaic acid. In all of the plots, the gray regions report 95% confidence intervals.
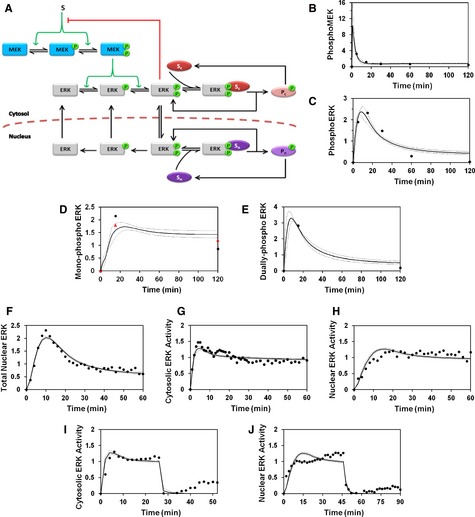
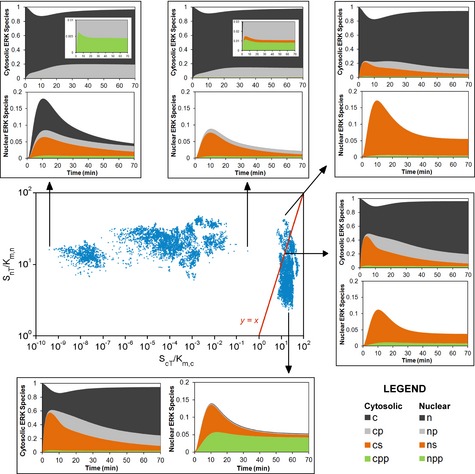
- A
Schematic of a simple kinetic model including cytosolic and nuclear substrates that bind to and are phosphorylated by active ERK.
- B–J
Means of calculated time courses (solid lines), representing a global ensemble fit to the data, are plotted along with the means of the corresponding experimental measurements (black circles). Broken lines report mean ± s.d. of the model output for all parameter sets in the ensemble (n = 10 000). The data fit for maximal PDGF stimulation conditions comprises MEK (B) and ERK (C) phosphorylation measured by immunoblotting, mono‐phosphorylated ERK2 [pTEY, (D)] and diphosphorylated ERK2 (E) measured by mass spectrometry, nuclear localization of ERK (F), and cytosolic (G) and nuclear (H) ERK activities. Also fit were the experiments in which cytosolic (I) and nuclear (J) ERK activities were monitored in cells maximally stimulated with PDGF followed by MEK inhibition.
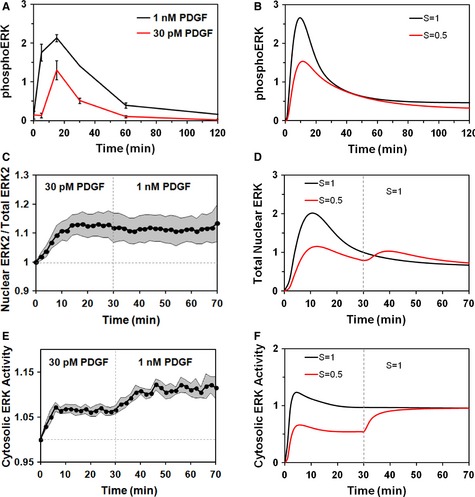
ERK phosphorylation was assessed by quantitative immunoblotting (mean ± s.e.m., n = 3).
Predicted ERK phosphorylation.
Nuclear localization of mCherry ERK2 was stimulated by 30 pM PDGF followed by 1 nM PDGF (mean ± 95% confidence interval, n = 8).
Predicted nuclear translocation of ERK.
Cytosolic ERK activity was measured for the same stimulation protocol as in (C) (mean ± 95% confidence interval, n = 11).
Prediction of free, active ERK in the cytosol.
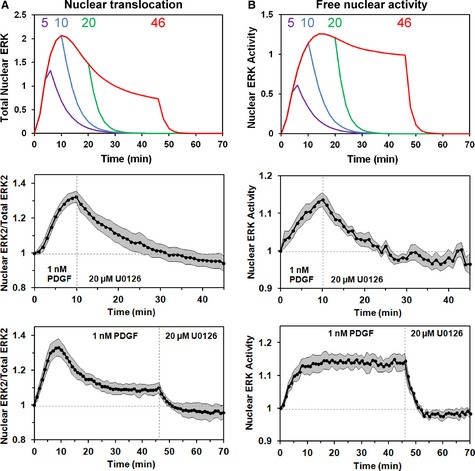
- A, B
Nuclear translocation of ERK (A) and free, active ERK in the nucleus (B) were predicted (mean of ensemble predictions) for maximal PDGF stimulation followed by MEK inhibition imposed at different time points (5, 10, 20, and 46 min after PDGF stimulation, as indicated) (top panels). NIH 3T3 cells co‐expressing mCherry‐ERK2 and nuclear EKAR biosensor were treated with 1 nM PDGF followed by U0126 MEK inhibitor to test the predictions. The data are presented as mean ± 95% confidence interval. Middle panels: kinetics of nuclear localization [(A), n = 10] and nuclear ERK activity [(B), n = 7; of the 10 cells in (A), these had suitable EKAR expression] for MEK inhibition imposed 10 min after PDGF stimulation. Bottom panels: kinetics of nuclear localization [(A), n = 9] and nuclear ERK activity [(B), n = 9] for MEK inhibition imposed 46 min after PDGF stimulation.
References
-
- Anderson NG, Maller JL, Tonks NK, Sturgill TW (1990) Requirement for integration of signals from two distinct phosphorylation pathways for activation of MAP kinase. Nature 343: 651–653 - PubMed
-
- Bhalla US, Ram PT, Iyengar R (2002) MAP kinase phosphatase as a locus of flexibility in a mitogen‐activated protein kinase signaling network. Science 297: 1018–1023 - PubMed
Publication types
MeSH terms
Substances
Grants and funding
LinkOut - more resources
Full Text Sources
Other Literature Sources
Miscellaneous
