. 2013:2013:824919.
doi: 10.1155/2013/824919. Epub 2013 Dec 30.

CD14 mediates binding of high doses of LPS but is dispensable for TNF-α production

Affiliations

CD14 mediates binding of high doses of LPS but is dispensable for TNF-α production

Kinga Borzęcka et al. Mediators Inflamm. 2013.

Abstract

Activation of macrophages with lipopolysaccharide (LPS) involves a sequential engagement of serum LPS-binding protein (LBP), plasma membrane CD14, and TLR4/MD-2 signaling complex. We analyzed participation of CD14 in TNF-α production stimulated with 1-1000 ng/mL of smooth or rough LPS (sLPS or rLPS) and in sLPS binding to RAW264 and J744 cells. CD14 was indispensable for TNF-α generation induced by a low concentration, 1 ng/mL, of sLPS and rLPS. At higher doses of both LPS forms (100-1000 ng/mL), TNF-α release required CD14 to much lower extent. Among the two forms of LPS, rLPS-induced TNF-α production was less CD14-dependent and could proceed in the absence of serum as an LBP source. On the other hand, the involvement of CD14 was crucial for the binding of 1000 ng/mL of sLPS judging from an inhibitory effect of the anti-CD14 antibody. The binding of sLPS was also strongly inhibited by dextran sulfate, a competitive ligand of scavenger receptors (SR). In the presence of dextran sulfate, sLPS-induced production of TNF-α was upregulated about 1.6-fold. The data indicate that CD14 together with SR participates in the binding of high doses of sLPS. However, CD14 contribution to TNF α production induced by high concentrations of sLPS and rLPS can be limited.


Figures

Figure 1
Figure 1
Interference with LPS/CD14 interaction moderately affects TNF-α production induced by high concentrations of sLPS or rLPS. RAW264 cells were pretreated with 10 μg/mL of the anti-CD14 antibody, clone 4C1, or isotype-matched control rat IgG2b (30 min, 37°C) and subsequently stimulated with 1–1000 ng/mL sLPS (a, b) or 1–1000 ng/mL rLPS (c, d) in the presence or absence of 10% FBS, as indicated. Concentrations of TNF-α (a, c) and RANTES (b, d) were measured by ELISA tests in supernatants of the cells. Data shown are mean ± SEM form three or four experiments each run in triplicate. *Significantly different from cells stimulated with a corresponding LPS concentration in the presence of control IgG and FBS.
Figure 2
Figure 2
Silencing of TLR4 gene expression significantly downregulates production of TNF-α and RANTES in cells stimulated with sLPS or rLPS. RAW264 cells were transfected with TLR4-specific siRNA or scrambled siRNA and, after 50 h, stimulated with 10–1000 ng/mL sLPS (a, b) or 10–1000 ng/mL rLPS (c, d). Production of TNF-α (a, c) and RANTES (b, d) by the cells was estimated by ELISA tests. Data shown are mean ± SEM from three experiments each run in triplicate. *Significantly different from cells treated with scrambled siRNA and stimulated with a corresponding LPS concentration. (e) Immunoblotting analysis of TLR4 protein level versus actin level in cells transfected with TLR4-specific or scrambled (sc) siRNA. nt: not transfected cells. On the left, a molecular weight marker (prestained phosphorylase b, 101 kDa) is indicated. Data from two independent experiments are shown.
Figure 3
Figure 3
Effect of neutralizing CD14 on cytokine production during activation of TLR2/TLR6, TLR2/TLR1, and TLR3. RAW264 cells were pretreated with 10 μg/mL of the anti-CD14 antibody or isotype-matched control rat IgG2b (30 min, 37°C) and exposed to indicated concentrations of Pam2CSK4 (a) or Pam3CSK4 (b) or poly(I:C) (c) in the presence of 10% FBS. Amounts of TNF-α (a, b) and RANTES (c) were measured by ELISA tests in supernatants of the cells. Data shown are mean ± SEM form two or three experiments each run in triplicate. *Significantly different from cells stimulated with a corresponding ligand concentration in the presence of control IgG.
Figure 4
Figure 4
Binding of high doses of sLPS to the surface of RAW264 cells is mediated by CD14 and SR. (a, b) Binding of sLPS-biotin to the surface of RAW264 cells. Cells were preincubated with 0.05% NaN3 (30 min, 37°C) and either left untreated (ns) or exposed to 5 or 10 μg/mL of the anti-CD14 antibody or 10 μg/mL isotype-matched control IgG (cIgG) or 50 μg/mL dextran sulfate (DS), or 50 μg/mL chondroitin sulfate (CS), or the mixture of 5 μg/mL anti-CD14 antibody and 50 μg/mL dextran sulfate. After 30 min (37°C), cells were stimulated with 1 μg/mL sLPS-biotin (1 h, 37°C) in the constant presence of 0.05% NaN3. The amount of sLPS-biotin bound to the cell surface was assessed by dot-blot analysis of cell homogenates using streptavidin-peroxidase (a). (c, d) Internalization of sLPS-biotin. Cells were preincubated with 10 μg/mL anti-CD14 antibody or 10 μg/mL isotype-matched control IgG or 50 μg/mL dextran sulfate or 50 μg/mL chondroitin sulfate or a mixture of the anti-CD14 and dextran sulfate for 30 min at 37°C. Subsequently, the samples were supplemented with 1 μg/mL of sLPS-biotin for 1 h and washed and incubated for another 1 h at 37°C prior to homogenization and dot-blot analysis (c). (b, d) Quantification of cell surface-bound (b) and internalized (d) sLPS-biotin based on densitometric analysis of dot-blots. Data are mean ± SEM from three experiments. *Significantly different from cells exposed to control IgG.
Figure 5
Figure 5
Disparate requirements for CD14 participation in the binding of high doses of LPS and production of TNF-α in J774 cells.(a, b) Binding of sLPS-biotin to the surface J774 cells. Cells were preincubated with 0.05% NaN3 (30 min, 37°C) and either left untreated (ns) or supplemented with 5, 10, or 15 μg/mL of the anti-CD14 antibody or 10 μg/mL isotype matched control IgG (cIgG) or 50 μg/mL dextran sulfate (DS) or 50 μg/mL chondroitin sulfate (CS) or a mixture of 5 μg/mL anti-CD14 antibody and 50 μg/mL dextran sulfate for 30 min (37°C). Subsequently, 1 μg/mL of sLPS-biotin was added to the cultures for 1 h in the presence of 0.05% NaN3. (a) Dot-blot analysis of sLPS-biotin in cell homogenates. (b) Densitometric analysis of dot-blots exemplified in (a). Data are mean ± SEM from three experiments. (c) LigandTracer real-time analysis of the binding and internalization of sLPS-AF488. Cells were preincubated for 15 min at 37°C with a mixture of 10 μg/mL anti-CD14 antibody and 50 μg/mL dextran sulfate (DS) or with 50 μg/mL chondroitin sulfate (CS) and transferred into the LigandTracer. After 30 min of the baseline setting (37°C), cells were exposed to 3 μg/mL of sLPS-AF488 for 1 h (association phase), washed to remove the unbound LPS, and monitored for another 1 h to measure retention of sLPS-AF488 in cells. Traces with open symbols and closed symbols reflect sLPS-AF488 binding and internalization in CS-treated and anti-CD14/DS-treated cells, respectively. Concanavalin A-FITC (100 μg/mL; ConA) was added to the anti-CD14/DS-treated culture for 40 min to ensure that the cells were still adherent. (d, e) Production of TNF-α (d) and RANTES (e) in cells pretreated with 10 μg/mL of the anti-CD14 antibody or isotype-matched control rat IgG2b and stimulated with 10–1000 ng/mL of sLPS. Data are mean ± SEM from three experiments. *Significantly different from cells exposed to control IgG.
Figure 6
Figure 6
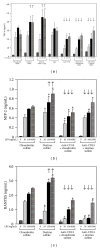
Occupation of SR by dextran sulfate upregulates sLPS-induced TNF-α production with CD14 participation. RAW264 cells were pretreated with 50 μg/mL dextran sulfate or 50 μg/mL chondroitin sulfate or 10 μg/mL anti-CD14 or 10 μg/mL isotype-matched rat IgG2b (cIgG) or combination of the agents, as indicated, and subsequently were exposed to 10–1000 ng/mL of sLPS (37°C). Generation of TNF-α (a), MIP-2 (b), and RANTES (c) was estimated in culture supernatants by ELISA tests. Arrows directed upwards point to the enhancement of cytokine production stimulated by 100 or 1000 ng/mL of sLPS in the presence of dextran sulfate while arrows directed downwards indicate the inhibition of cytokine generation by the anti-CD14 in comparison to cells exposed to sLPS accompanied by dextran sulfate. Data shown are mean ± SEM from three or four experiments each run in triplicates. *Significantly different from cells exposed to chondroitin sulfate and sLPS; #significantly different from cells exposed to dextran sulfate and sLPS.

References

    1. Kumar H, Kawai T, Akira S. Pathogen recognition by the innate immune system. International Reviews of Immunology. 2011;30(1):16–34. - PubMed
    1. Poltorak A, He X, Smirnova I, et al. Defective LPS signaling in C3H/HeJ and C57BL/10ScCr mice: mutations in Tlr4 gene. Science. 1998;282(5396):2085–2088. - PubMed
    1. Björkbacka H, Fitzgerald KA, Huet F, et al. The induction of macrophage gene expression by LPS predominantly utilizes Myd88-independent signaling cascades. Physiological Genomics. 2004;19(3):319–330. - PubMed
    1. Opal SM, Scannon PJ, Vincent J-L, et al. Relationship between plasma levels of lipopolysaccharide (LPS) and LPS-binding protein in patients with severe sepsis and septic shock. The Journal of Infectious Diseases. 1999;180(5):1584–1589. - PubMed
    1. Salomao R, Brunialti MK, Rapozo MM, Baggio-Zappia GL, Galanos C, Freudenberg M. Bacterial sensing, cell signaling, and modulation of the immune response during sepsis. Shock. 2012;38(3):227–242. - PubMed

Publication types

MeSH terms

LinkOut - more resources