

Deconvolution of serum cortisol levels by using compressed sensing
- PMID: 24489656
- PMCID: PMC3904842
- DOI: 10.1371/journal.pone.0085204
Deconvolution of serum cortisol levels by using compressed sensing
Abstract
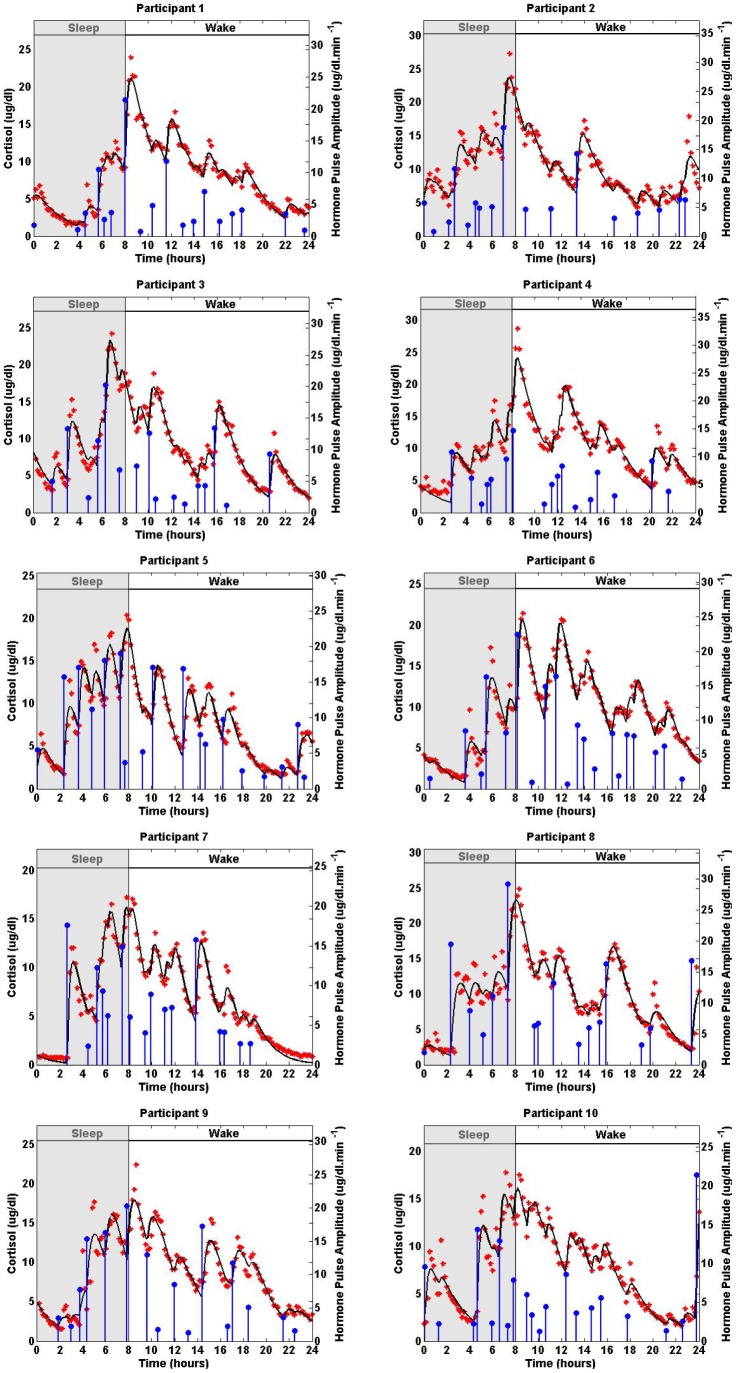
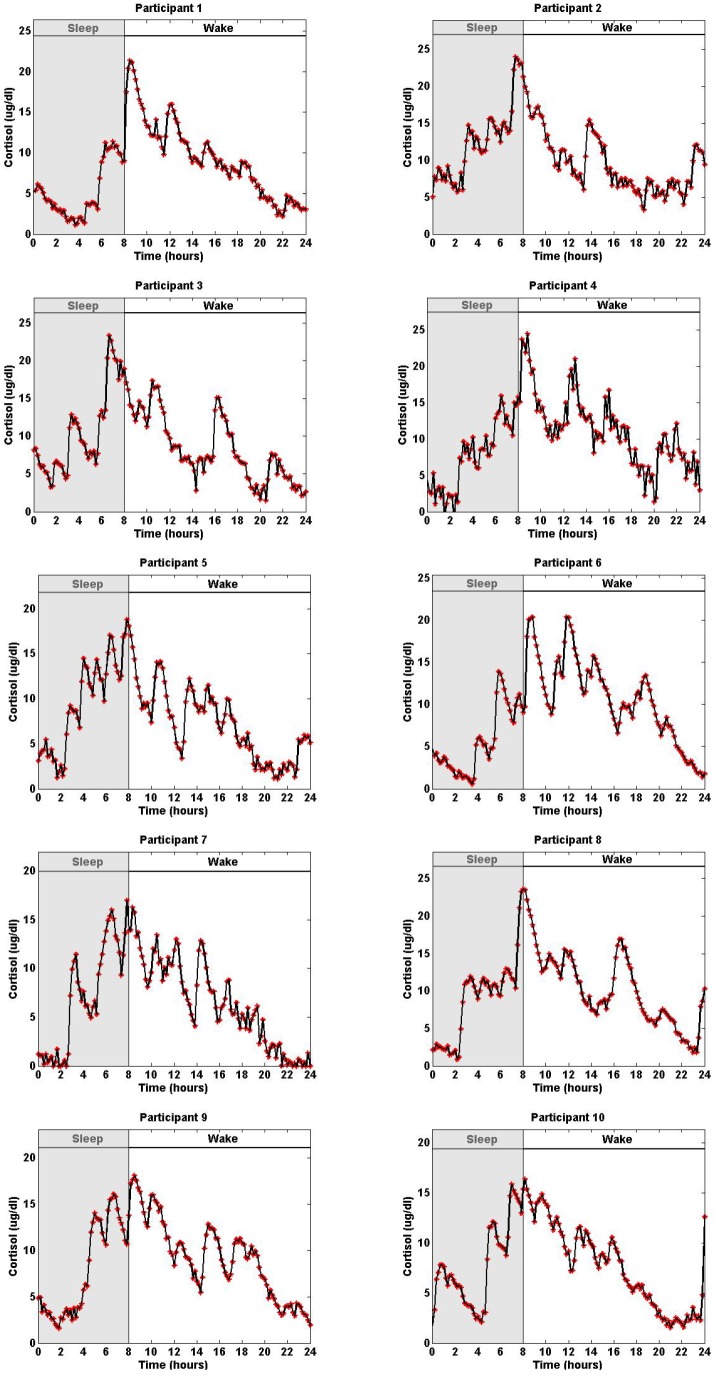
The pulsatile release of cortisol from the adrenal glands is controlled by a hierarchical system that involves corticotropin releasing hormone (CRH) from the hypothalamus, adrenocorticotropin hormone (ACTH) from the pituitary, and cortisol from the adrenal glands. Determining the number, timing, and amplitude of the cortisol secretory events and recovering the infusion and clearance rates from serial measurements of serum cortisol levels is a challenging problem. Despite many years of work on this problem, a complete satisfactory solution has been elusive. We formulate this question as a non-convex optimization problem, and solve it using a coordinate descent algorithm that has a principled combination of (i) compressed sensing for recovering the amplitude and timing of the secretory events, and (ii) generalized cross validation for choosing the regularization parameter. Using only the observed serum cortisol levels, we model cortisol secretion from the adrenal glands using a second-order linear differential equation with pulsatile inputs that represent cortisol pulses released in response to pulses of ACTH. Using our algorithm and the assumption that the number of pulses is between 15 to 22 pulses over 24 hours, we successfully deconvolve both simulated datasets and actual 24-hr serum cortisol datasets sampled every 10 minutes from 10 healthy women. Assuming a one-minute resolution for the secretory events, we obtain physiologically plausible timings and amplitudes of each cortisol secretory event with R (2) above 0.92. Identification of the amplitude and timing of pulsatile hormone release allows (i) quantifying of normal and abnormal secretion patterns towards the goal of understanding pathological neuroendocrine states, and (ii) potentially designing optimal approaches for treating hormonal disorders.
Conflict of interest statement
Figures
 and
and  in Table 2 in one of the 10 participants, assuming a zero mean Gaussian measurement error with standard deviation
  in Table 3. In all simulations the initial conditions are
  ,
,  equals the initial cortisol level of the corresponding participant, and the cortisol levels are recorded every 10 minutes.
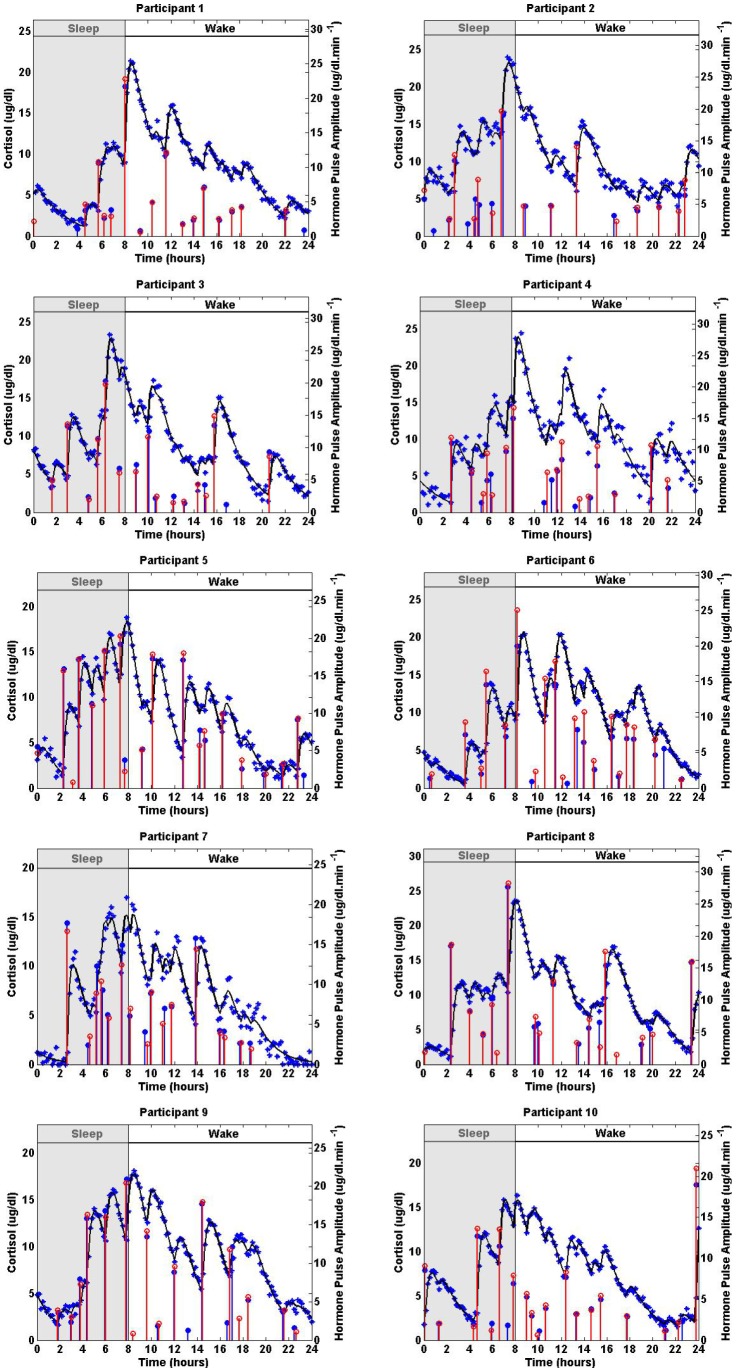
References
-
- Vis DJ, Westerhuis JA, Hoefsloot HCJ, Pijl H, Roelfsema F, et al. (2010) Endocrine pulse identification using penalized methods and a minimum set of assumptions. American Journal of Physiology - Endocrinology And Metabolism 298: E146–E155. - PubMed
-
- Kettyle WM, Arky RA (1998) Endocrine Pathophysiology. Philadelphia: Lippincott-Raven.
-
- Johnson TD (2003) Bayesian deconvolution analysis of pulsatile hormone concentration profiles. Biometrics 59: 650–660. - PubMed
Publication types
MeSH terms
Substances
Grants and funding
- DP1 OD003646/OD/NIH HHS/United States
- RC2-HL101340/HL/NHLBI NIH HHS/United States
- K24 HL105664/HL/NHLBI NIH HHS/United States
- R01-HL-11408/HL/NHLBI NIH HHS/United States
- RC2 HL101340/HL/NHLBI NIH HHS/United States
- Z01 AG000661/ImNIH/Intramural NIH HHS/United States
- M01 RR002635/RR/NCRR NIH HHS/United States
- K24 HL103845/HL/NHLBI NIH HHS/United States
- K01AG00661/AG/NIA NIH HHS/United States
- R01 HL114088/HL/NHLBI NIH HHS/United States
- P01 AG009975/AG/NIA NIH HHS/United States
- L30 RR020635/RR/NCRR NIH HHS/United States
- UL1 RR025758/RR/NCRR NIH HHS/United States
- NIH R01AR43130/AR/NIAMS NIH HHS/United States
- NIH K24 HL103845/HL/NHLBI NIH HHS/United States
- R01GM 53559/GM/NIGMS NIH HHS/United States
- NIH DP1 OD003646/OD/NIH HHS/United States
- NIH P01-AG09975/AG/NIA NIH HHS/United States
- K24-HL105664/HL/NHLBI NIH HHS/United States
- M01RR20635/RR/NCRR NIH HHS/United States
LinkOut - more resources
Full Text Sources
Other Literature Sources
