

Accurate data processing improves the reliability of Affymetrix gene expression profiles from FFPE samples
- PMID: 24489733
- PMCID: PMC3906036
- DOI: 10.1371/journal.pone.0086511
Accurate data processing improves the reliability of Affymetrix gene expression profiles from FFPE samples
Erratum in
- PLoS One. 2014;9(4):e95814
Abstract
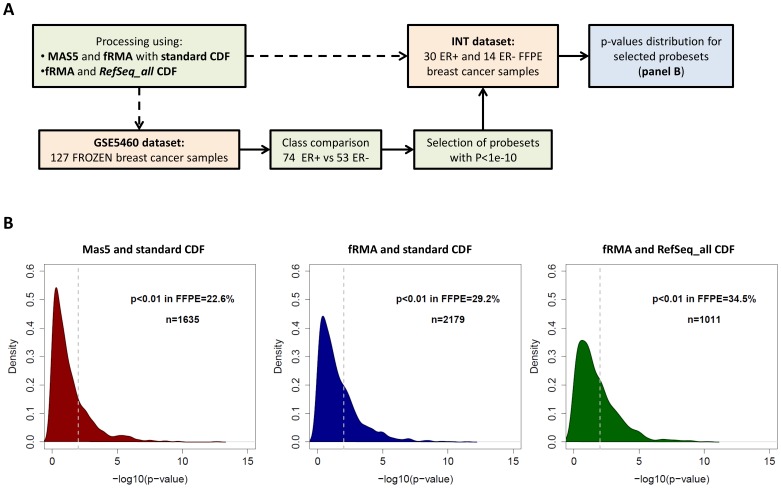
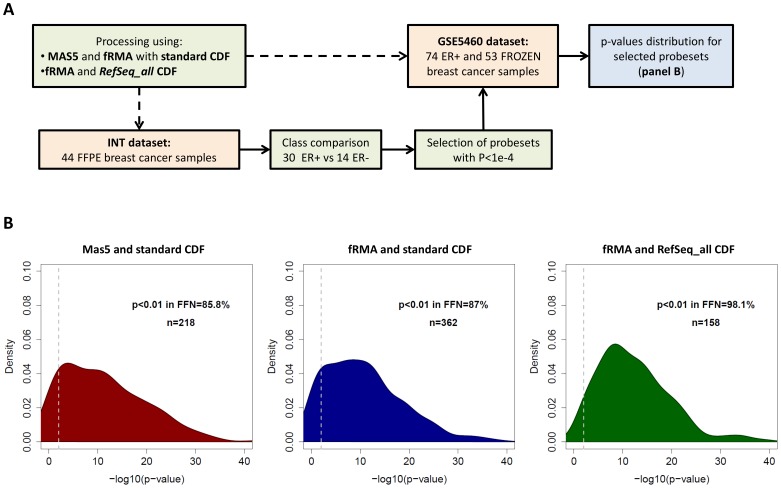
Formalin fixed paraffin-embedded (FFPE) tumor specimens are the conventionally archived material in clinical practice, representing an invaluable tissue source for biomarkers development, validation and routine implementation. For many prospective clinical trials, this material has been collected allowing for a prospective-retrospective study design which represents a successful strategy to define clinical utility for candidate markers. Gene expression data can be obtained even from FFPE specimens with the broadly used Affymetrix HG-U133 Plus 2.0 microarray platform. Nevertheless, important major discrepancies remain in expression data obtained from FFPE compared to fresh-frozen samples, prompting the need for appropriate data processing which could help to obtain more consistent results in downstream analyses. In a publicly available dataset of matched frozen and FFPE expression data, the performances of different normalization methods and specifically designed Chip Description Files (CDFs) were compared. The use of an alternative CDFs together with fRMA normalization significantly improved frozen-FFPE sample correlations, frozen-FFPE probeset correlations and agreement of differential analysis between different tumor subtypes. The relevance of our optimized data processing was assessed and validated using two independent datasets. In this study we demonstrated that an appropriate data processing can significantly improve the reliability of gene expression data derived from FFPE tissues using the standard Affymetrix platform. Tools for the implementation of our data processing algorithm are made publicly available at http://www.biocut.unito.it/cdf-ffpe/.
Conflict of interest statement
Figures


References
-
- Reis-Filho JS, Pusztai L (2011) Gene expression profiling in breast cancer: classification, prognostication, and prediction. Lancet 378: 1812–23. - PubMed
-
- Perou CM, Sorlie T, Eisen MB, van de Rijn M, Jeffrey SS, et al. (2000) Molecular portraits of human breast tumours. Nature 406: 747–52. - PubMed
-
- van't Veer LJ, Dai H, van de Vijver MJ, He YD, Hart AA, et al. (2002) Gene expression profiling predicts clinical outcome of breast cancer. Nature 415: 530–6. - PubMed
-
- Simon R (2005) Roadmap for developing and validating therapeutically relevant genomic classifiers. J Clin Oncol 23: 7332–41. - PubMed
Publication types
MeSH terms
Substances
LinkOut - more resources
Full Text Sources
Other Literature Sources
Medical
Molecular Biology Databases
