Clinical Trial
. 2014 Jan 29;9(1):e86708.
doi: 10.1371/journal.pone.0086708. eCollection 2014.

The personal human oral microbiome obscures the effects of treatment on periodontal disease

Affiliations
Clinical Trial

The personal human oral microbiome obscures the effects of treatment on periodontal disease

Karen Schwarzberg et al. PLoS One. .

Abstract

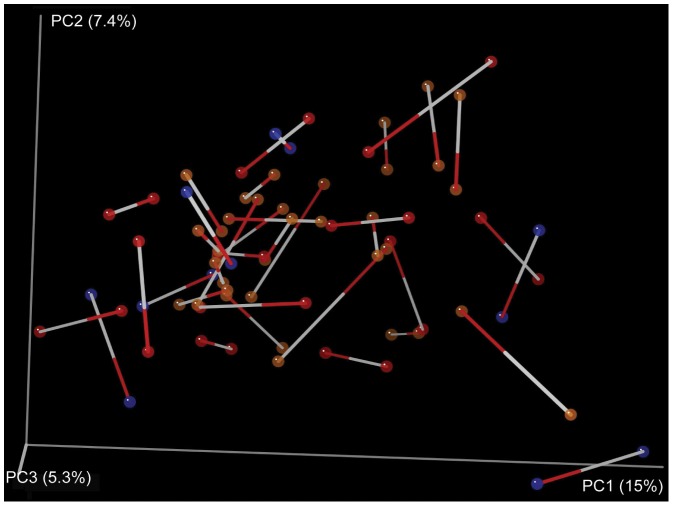
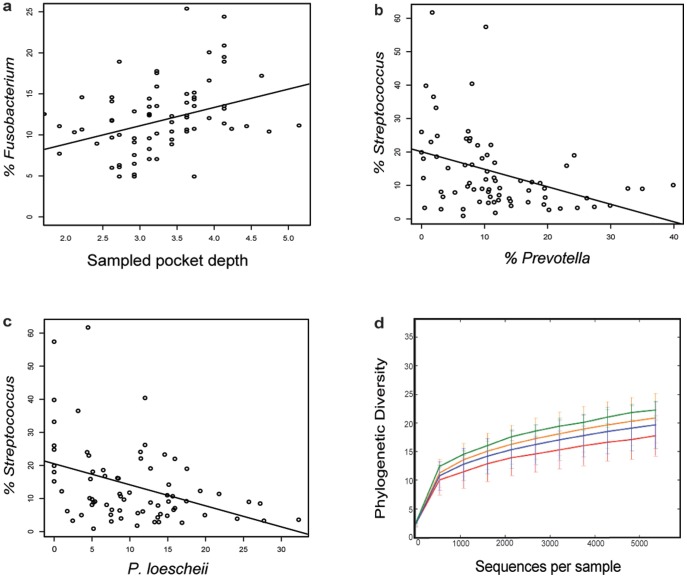
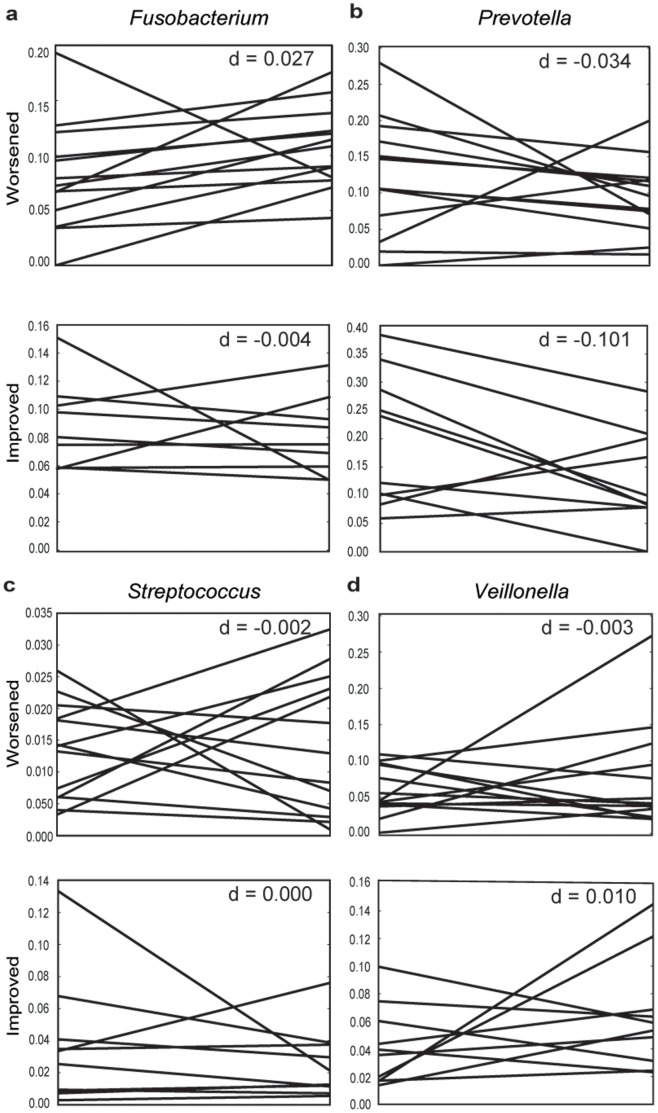
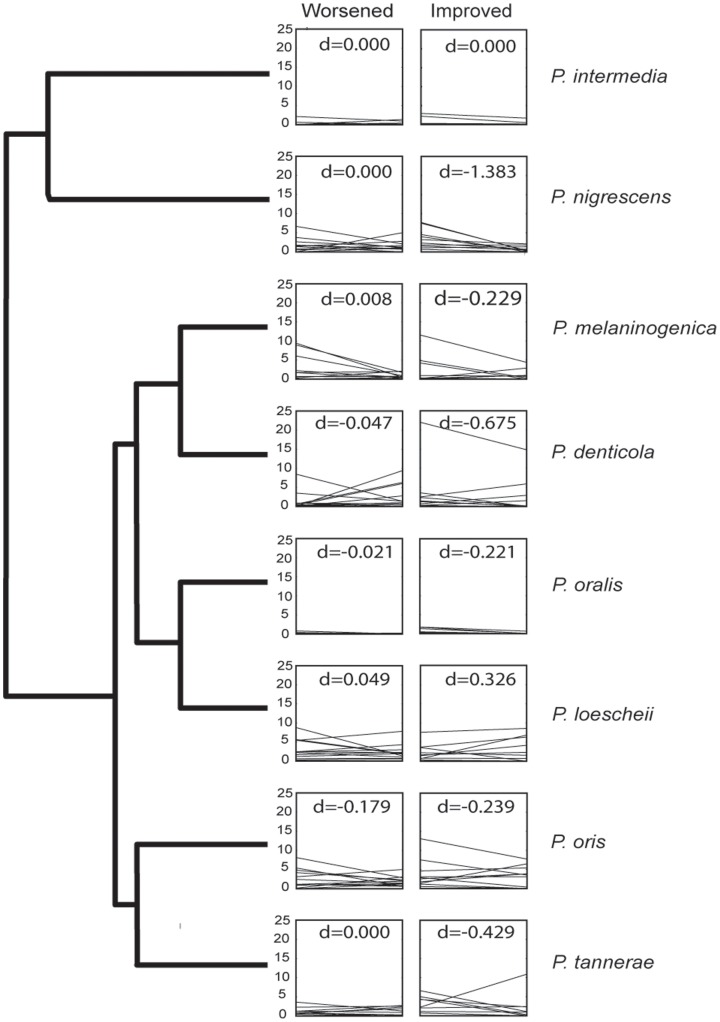
Periodontitis is a progressive disease of the periodontium with a complex, polymicrobial etiology. Recent Next-Generation Sequencing (NGS) studies of the microbial diversity associated with periodontitis have revealed strong, community-level differences in bacterial assemblages associated with healthy or diseased periodontal sites. In this study, we used NGS approaches to characterize changes in periodontal pocket bacterial diversity after standard periodontal treatment. Despite consistent changes in the abundance of certain taxa in individuals whose condition improved with treatment, post-treatment samples retained the highest similarity to pre-treatment samples from the same individual. Deeper phylogenetic analysis of periodontal pathogen-containing genera Prevotella and Fusobacterium found both unexpected diversity and differential treatment response among species. Our results highlight how understanding interpersonal variability among microbiomes is necessary for determining how polymicrobial diseases respond to treatment and disturbance.


Conflict of interest statement

Competing Interests: The authors have declared that no competing interests exist.

Figures

Figure 1
Figure 1. Procrustes analysis of samples before and after periodontal treatment, Procrustes M2 value = 0.420 (dissimilarity of the two datasets), P-value = 0.00 based on 1000 Monte Carlo iterations.
This analysis is a visualization of a principal coordinates analysis (PCoA) of the Unifrac distances between samples, showing the best superimposition of one Unifrac plot on the other. Samples collected from the same patient before and after treatment are connected by a line, the white end indicating the before-treatment sample red end indicating the after-treatment sample. Patients were classified as improved (red circles), worsened (brown circles) or no change (blue circles). Determination of patient improvement or decline was based on changes in observed pocket depth, a standard approach used in periodontal research , .
Figure 2
Figure 2. Statistical trends and alpha diversity of samples.
a Percent of Fusobacterium relative to pocket depth of sampled teeth (r = 0.2413, P = 0.0411). b Percent of Streptococcus relative to Prevotella (r = −0.3846, P = 0.0008). c Percent of Streptococcus relative to single Prevotella species, P. loescheii (r = −0.3055, P = 0.0090). d Rarefaction trends: distribution of number of sequences per sample. Samples were classified as Healthy Controls (red line), gingivitis (blue line), mild/moderate periodontitis (orange line) and severe periodontitis (green line).
Figure 3
Figure 3. Trends of bacterial genera associated with health or disease, separated by whether individuals improved or worsened after treatment.
An analysis of average periodontal pocket depth before and after treatment showed that less than half (N = 12) the treated individuals improved post-treatment, while the rest stayed the same (N = 6) or worsened (N = 18). Lines indicate the proportion for a particular individual. The d-scores indicate the median line slope. a Fusobacterium, b Prevotella, c Streptococcus, d Veillonella. Note that the scale of the y-axis differs to highlight difference in individual responses to treatment.
Figure 4
Figure 4. Representative cladogram of Prevotella species determined in this study (based on phylogenetic analysis shown in Figure S2) with plots of relative abundance of specific species divided into patients that improved and patients that worsened.
The d-scores indicate the median line slope. In many cases, changes in relative proportions before and after treatment appeared to be species dependent.
Figure 5
Figure 5. Cladogram of 73 different Fusobacterium-species (OTUs clustered at 97%) sequences along with a histogram showing the log OTU-count abundance of these same species.
Most OTUs were sparse and the overall diversity within and among pockets was considerable.

References

    1. Dentino A, Lee S, Mailhot J, Hefti AF (2013) Principles of periodontology. Periodontology 2000 61: 16–53. - PubMed
    1. Teles R, Teles F, Frias-Lopez J, Paster B, Haffajee A (2013) Lessons learned and unlearned in periodontal microbiology. Periodontology 2000 62: 95–162. - PMC - PubMed
    1. Genco RJ, Borgnakke WS (2013) Risk factors for periodontal disease. Periodontology 2000 62: 59–94. - PubMed
    1. Cullinan MP, Seymour GJ (2013) Periodontal disease and systemic illness: will the evidence ever be enough? Periodontology 2000 62: 271–286. - PubMed
    1. Slots J (2013) Periodontology: past, present, perspectives. Periodontology 2000 62: 7–19. - PubMed

Publication types

MeSH terms

Substances