. 2014 Jan 29;9(1):e86753.
doi: 10.1371/journal.pone.0086753. eCollection 2014.

3 β-hydroxysteroid-Δ 24 reductase (DHCR24) protects neuronal cells from apoptotic cell death induced by endoplasmic reticulum (ER) stress

Affiliations

3 β-hydroxysteroid-Δ 24 reductase (DHCR24) protects neuronal cells from apoptotic cell death induced by endoplasmic reticulum (ER) stress

Xiuli Lu et al. PLoS One. .

Abstract

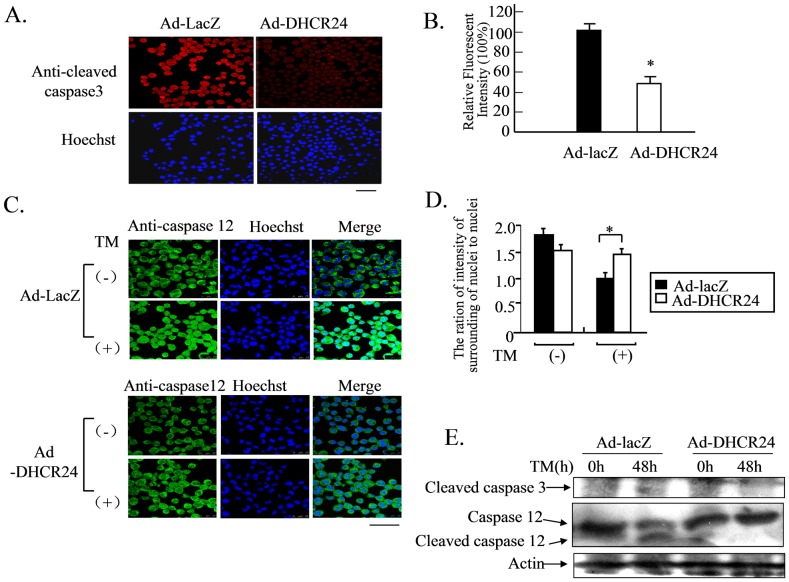
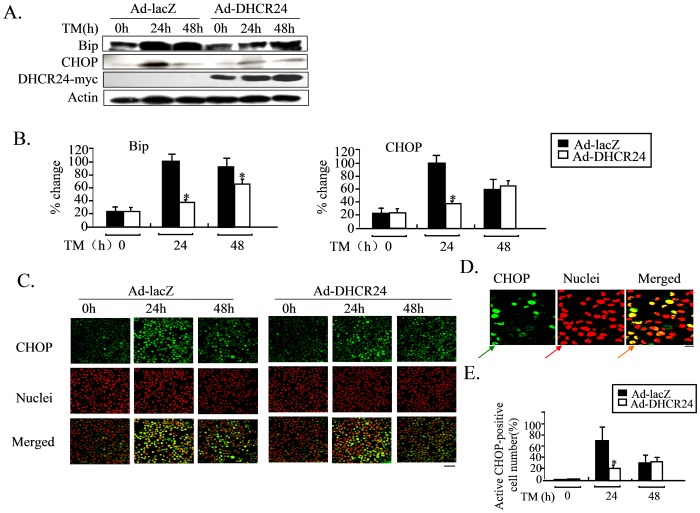
3β-Hydroxysteroid-Δ24 reductase (DHCR24) is an endoplasmic reticulum (ER)-localized multifunctional enzyme that possesses anti-apoptotic and cholesterol-synthesizing activities. Accumulating evidence suggests that ER stress is involved in the pathogenesis of neurodegenerative disease. In this study, we investigated whether DHCR24 may function as a neuroprotective protein under ER stress. Neuroblastoma N2A cells were infected with adenovirus expressing myc-tagged DHCR24 (Ad-DHCR24) or lacZ (Ad-lacZ, serving as a control) and subjected to ER-stress, induced with Tunicamycin (TM). Cells infected with Ad-DHCR24-myc were resistant to TM-induced apoptosis, and showed weaker level of caspase-12 activity. These cells also exhibited lower levels of Bip and CHOP proteins than Ad-LacZ-infected cells. Moreover, a stronger and rapid activation of PERK, and a prolonged activation of JNK and p38 were observed in Ad-LacZ-infected cells. The generation of intracellular reactive oxygen species from ER stress was also diminished by the overexpression of DHCR24. Additionally, intracellular cholesterol level was also elevated in the Ad-DHCR24-infected cells, accompanied by a well-organized formation of caveolae (cholesterol-rich microdomain) on the plasma membrane, and improved colocalization of caveolin-1 and insulin-like growth factor 1 receptor. These results demonstrated for the first time that DHCR24 could protect neuronal cells from apoptosis induced by ER stress.


Conflict of interest statement

Competing Interests: The authors have declared that no competing interests exist.

Figures

Figure 1
Figure 1. Overexpression of DHCR24 protects neuronal cells from TM-induced apoptosis.
Panel A, The overexpression of DHCR24 in N2A cells was validated by immunocytochemical analysis using an antibody against c-myc. Cells were infected with adenoviruses for 48 hours and probed with mouse anti-myc antibody, followed by anti-mouse IgG antibody conjugated to Alexa fluor-488. Images were obtained by confocal laser microscopy. Green fluorescence signal represents the expression of recombinant DHCR24-myc and red fluorescence signal represents propidium iodide (PI)-stained nuclei. Scale bar, 100 µm. Panel B, N2A cells were infected with the indicated adenoviral construct at an MOI of 50 PFU/cell for 48 hours followed by exposure to TM (1 µg/ml). Images of the cells were obtained with a phase-contrast microscope at 0, 24 and 48 hours after TM treatment. Scale bar, 100 µm. Panel C, Numbers of adherent cells from panel B at 0, 24 and 48 hours. Values are expressed as mean ± S.D. (n = 3) *p<0.05 versus Ad-LacZ. Similar results were obtained from three separate experiments. Panel D, N2A cells were infected with the indicated adenoviral construct for 48 hours and then exposed to TM for 48 hours. DNA fragmentation was analyzed by the TUNEL assay and nuclei were stained with Hoechst. Scale bar, 100 µm. Panel E, The percentages of apoptotic cell numbers to adherent cells of Panel D were determined 48 hours after TM treatment. Values are expressed as mean ± S.D. (n = 3) *p<0.05 versus Ad-LacZ. Similar results were obtained from three separate experiments.
Figure 2
Figure 2. DHCR24 suppresses caspase-mediated apoptotic signaling pathway.
Panel A, N2A cells were infected with the indicated adenoviral construct for 48 hours and then exposed to TM for 48 hours, followed by immunocytochemical analysis. The cells were probed with mouse antibodies against the cleaved form of caspase-3, followed by anti-mouse IgG antibody conjugated to Alexa fluor-568. The nuclei were stained with Hoechst. Images were obtained with a confocal laser microscope. Scale bar, 50 µm. Panel B, The relative fluorescence signal intensities of Panel A were represented as percentage of Ad-LacZ. Values are expressed as mean ± S.D. (n = 3) *p<0.05 versus Ad-LacZ. Similar results were obtained from three separate experiments. Panel C, N2A cells were infected with the indicated adenoviral construct for 48 hours and then exposed to TM for 0 [TM(−)] or 48 hours [TM(+)], followed by immunocytochemical analysis. The cells were probed with mouse anti-caspase-12 antibody, followed by an anti-mouse IgG antibody conjugated to Alexa fluor-488. Images were obtained with a confocal laser microscopy. Scale bar, 100 µm. Panel D, The ratios of fluorescence intensity outside the nuclei to that inside the nuclei in Panel C images are represented. Values are expressed as mean ± S.D. (n = 3) *p<0.05 vs. Ad-LacZ. Similar results were obtained from three separate experiments. Panel E, N2A cells were infected with the indicated adenoviruses for 48 hours and then exposed to TM for 0 or 48 hours. Whole cell lysates (50 µg protein/lane) were subjected to Western blot analysis using anti-cleaved caspase-3, anti-caspase-12 (both full-length and cleaved form), and anti-actin antibodies.
Figure 3
Figure 3. ER stress is less severe in Ad-DHCR24-infected N2A cells.
N2A cells were infected with the indicated adenoviruses for 2 days, and then exposed to TM for various lengths of time. Whole cell lysates (50 µg/lane) were subjected to western blot analysis using anti-Bip, anti-CHOP, anti-myc or anti-actin antibody. The proteins were visualized using the ECL method. Representative results are shown in panel A. The expression levels of Bip and CHOP were normalized against actin level, and are expressed as percentage of the maximal level in the cells infected with Ad-LacZ. n = 3, Mean ± S.D., *: p<0.05 versus the levels in cells infected with Ad-LacZ. Cells were cultured on cover slips and infected with adenoviruses for 2 days, and then exposed to TM for the indicated time points, followed by immunocytochemical analysis. Cells were probed with mouse anti-CHOP antibodies, followed by anti-mouse IgG antibody conjugated to Alexa fluor-488. Nuclei were stained with PI. Images were obtained by confocal laser microscopy. Scale bar, 50 µm (Panel C). Scale bar, 5 µm (Panel D). The relative fluorescence signal intensities of Panel C were represented as percentage relative to that at time 0. Values are expressed as mean ± S.D. (n = 3) *p<0.05 versus Ad-LacZ. Similar results were obtained from three separate experiments.
Figure 4
Figure 4. ER-stress-related cell signaling is suppressed in Ad-DHCR24-infected N2A cells.
N2A cells were infected with the indicated adenoviruses for 2 days, and then exposed to TM for various lengths of time. Whole cell lysates (50 µg protein/lane) were subjected to western blot analysis using anti-phospho-PERK (T981), anti-phospho-p38 (T180/Y182), anti-phospho-JNK (T183/Y185), anti-CHOP or anti-actin antibody. Positive bands were visualized using the ECL method. Representative results are shown in panel A. The phosphor-PERK, phosphor-p38 and phosphor-JNK levels were normalized to actin levels, and are expressed as percentage relative to the maximal level in the cells infected with Ad-LacZ. n = 3, Mean ± S.D., *: p<0.05 vs. the levels in cells infected with Ad-LacZ.
Figure 5
Figure 5. Overexpressed DHCR24 in N2A cells scavenges intracellular ROS under ER stress.
N2A cells were infected with the indicated adenoviral construct for 2 days, and then exposed to TM for various lengths of time. The cells were subjected were treated with 20 µM H2DCFDA at 37°C for 30 minutes, and then fixed and mounted. Cell images were obtained with a confocal laser microscope. Bar, 50 µm (Panel A). Fluorescent intensity of DCF (2′, 7′ –dichlorofluorescein) was expressed relative to that at time 0. Mean ± SD (n = 40 cells). *: p<0.05 versus the levels of time 0 in cells infected with Ad-LacZ. #: p<0.05 versus the levels in cells infected with Ad-LacZ (Panel B).
Figure 6
Figure 6. Elevated cholesterol levels induced by Ad-DHCR24 infection facilitates caveolae structural formation and coupling of IGFI-R and caveolin-1.
Panel A, N2A cells were infected with the indicated adenoviruses for 2 days and the sterol contents in the whole cell extract were then determined using an enzymatic cholesterol assay kit. n = 3, Mean ± S.D., *: p<0.05 versus the levels in cells infected with Ad-LacZ. Panel B and C, N2A cells were infected with the indicated adenoviruses for 2 days, and then subjected to immunocytochemical analysis. The cells were probed with rabbit anti-caveolin-1 and mouse anti-IGF-IR β subunit antibodies, followed by anti-mouse IgG antibody conjugated to Alexa fluor-488 and anti-rabbit IgG antibody conjugated to Alexa fluor-568. Images were obtained with a confocal laser microscope. Red and green fluorescent signals represent caveolin-1 and IGF-IR proteins, respectively. Scale bar, 10 µm (Panel B), 1 µm (Panel C). Panel D and E, N2A cells were infected with Ad-lacZ or Ad-DHCR24 for 2 days, harvested, and then subjected to Western blot analysis using the anti-p-Akt, anti-Akt and anti-actin. Phosphor-Akt levels were normalized to actin level, and expressed as percentage of the levels in the cells infected with Ad-LacZ. n = 3, Mean ± S.D., *: p<0.05 versus the levels in cells infected with Ad-LacZ. Panel F, N2A cells were infected with the indicated adenoviruses for 2 days, and then exposed to the TM without or with Akt inhibitor IV (IV) for 48 hours. After trypsinization, the viability of the cells was assessed by Trypan Blue Staining. The number of viable cells is presented as a percentage of the number of cells infected with Ad-LacZ without TM treatment (n = 3, Mean±SD). *: p<0.05 versus cells infected with Ad-lacZ and treated with TM, #: p<0.05 versus cells infected with Ad-DHCR24 treated with TM.
Figure 7
Figure 7. Ad-DHCR24-driven overexpression of DHCR24 protects neural cells from Aβ-induced apoptosis.
Panel A and B, N2A cells were infected with the indicated adenoviral construct for 2 days, and then exposed to Aβ1–42 for 2 days. Images of the cells were obtained with a phase-contrast microscope at 48 hours after the Aβ treatment. Scale bar, 50 µm (Panel A). The number of adherent cells from panel A was counted at 0, 24 and 48 hours. Values are expressed as mean ± S.D. (n = 3) *p<0.05 vs. Ad-LacZ. Similar results were obtained from three separate experiments. Panel C and D, N2A cells were infected with the indicated adenoviruses for 2 days, and then exposed to Aβ1–421for 24 hours. Whole cell lysates (50 µg protein/lane) were subjected to Western blot analysis using anti-Bip and anti-actin antibodies. The proteins were visualized using the ECL method. Representative results are shown in Panel C. Bip levels were normalized against actin level, and are expressed as percentage of the levels of maximal levels in the cells infected with Ad-LacZ. n = 3, Mean ± S.D., *: p<0.05 vs. the levels in cells infected with Ad-LacZ.

Similar articles

Cited by

References

    1. Lai E, Teodoro T, Volchuk A (2007) Endoplasmic reticulum stress: signaling the unfolded protein response. Physiology.(Bethesda.) 22, 193–201. - PubMed
    1. Hetz C (2012) The unfolded protein response: controlling cell fate decisions under ER stress and beyond. Nat.Rev.Mol.Cell Biol. 13, 89–102. - PubMed
    1. Tabas I, Ron D (2011) Integrating the mechanisms of apoptosis induced by endoplasmic reticulum stress. Nat.Cell Biol. 13, 184–190. - PMC - PubMed
    1. Szegezdi E, Logue SE, Gorman AM, Samali A (2006) Mediators of endoplasmic reticulum stress-induced apoptosis. EMBO Rep. 7, 880–885. - PMC - PubMed
    1. Yoshida H (2007) ER stress and diseases. FEBS J. 274, 630–658. - PubMed

Publication types

MeSH terms