. 2014 Jan 29;9(1):e86963.
doi: 10.1371/journal.pone.0086963. eCollection 2014.

Mathematical modeling of renal tubular glucose absorption after glucose load

Affiliations

Mathematical modeling of renal tubular glucose absorption after glucose load

Andrea De Gaetano et al. PLoS One. .

Abstract

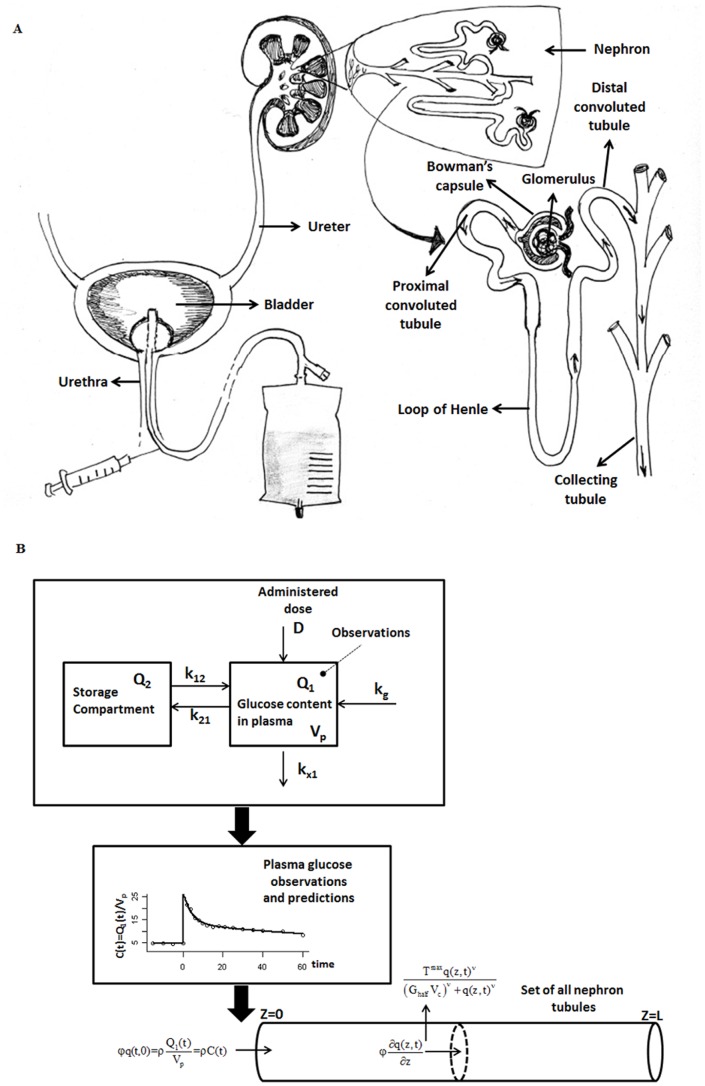
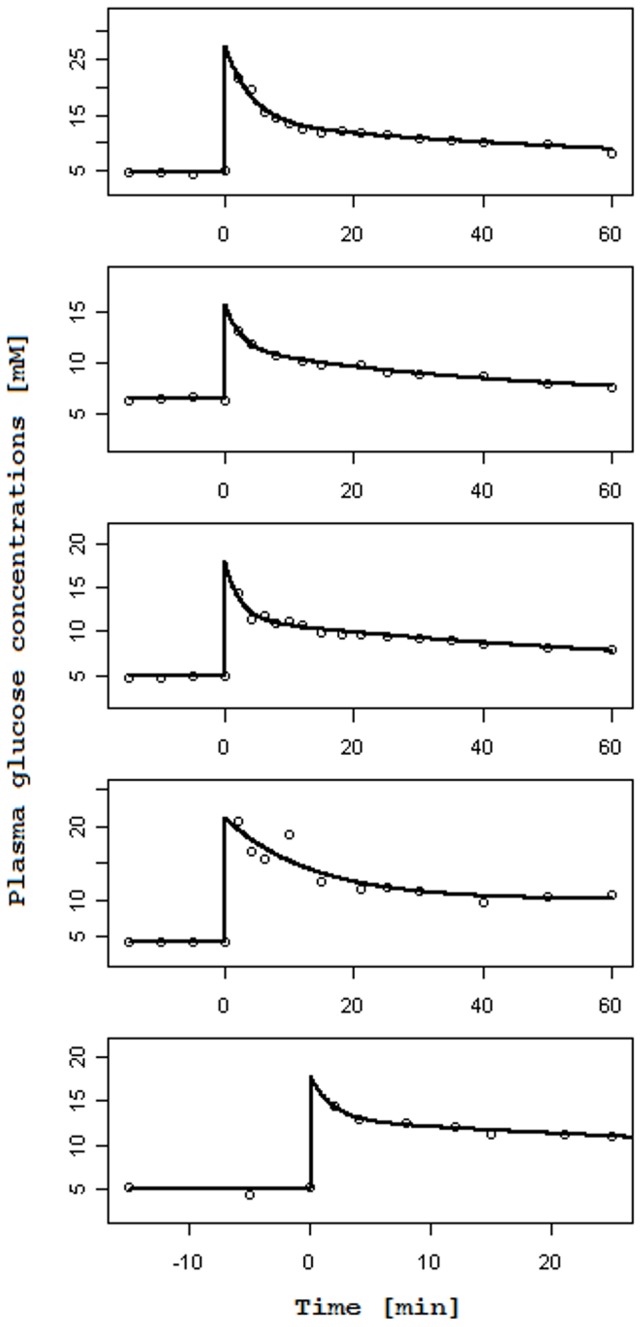
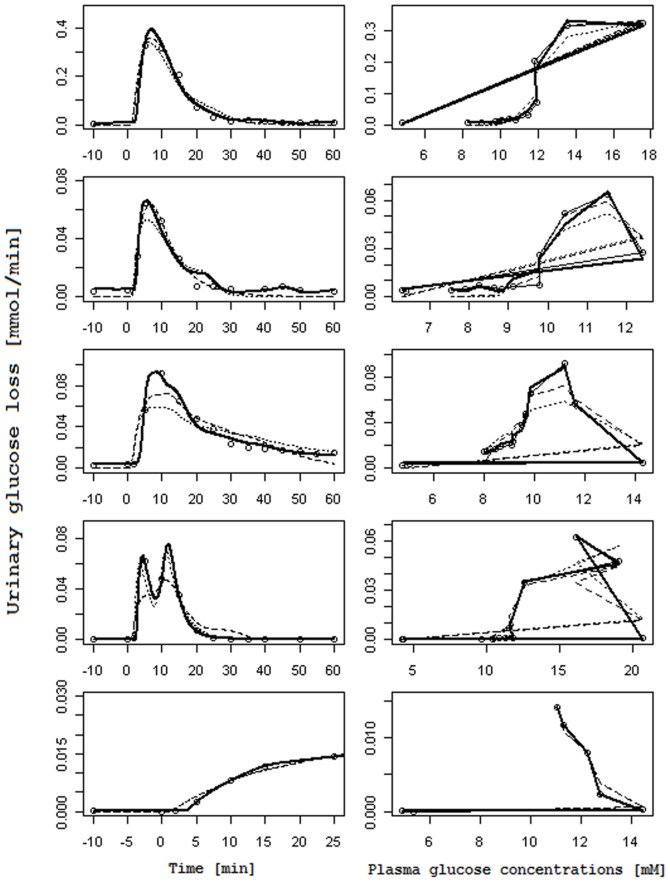
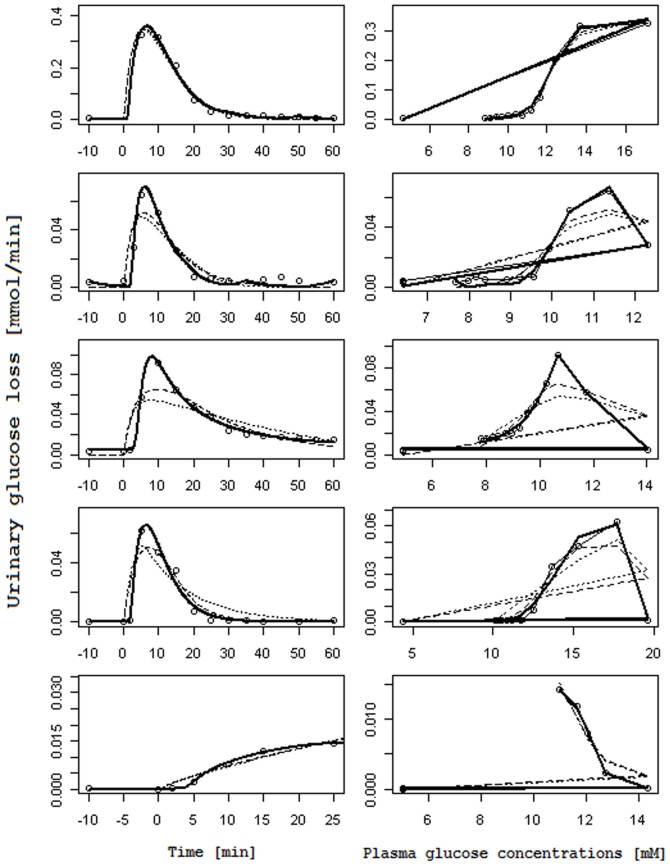
A partial differential Progressive Tubular Reabsorption (PTR) model, describing renal tubular glucose reabsorption and urinary glucose excretion following a glucose load perturbation, is proposed and fitted to experimental data from five subjects. For each subject the Glomerular Filtration Rate was estimated and both blood and urine glucose were sampled following an Intra-Venous glucose bolus. The PTR model was compared with a model representing the conventional Renal Threshold Hypothesis (RTH). A delay bladder compartment was introduced in both formulations. For the RTH model, the average threshold for glycosuria varied between 9.90 ± 4.50 mmol/L and 10.63 ± 3.64 mmol/L (mean ± Standard Deviation) under different hypotheses; the corresponding average maximal transport rates varied between 0.48 ± 0.45 mmol/min (86.29 ± 81.22 mg/min) and 0.50 ± 0.42 mmol/min (90.62 ± 76.15 mg/min). For the PTR Model, the average maximal transports rates varied between 0.61 ± 0.52 mmol/min (109.57 ± 93.77 mg/min) and 0.83 ± 0.95 mmol/min (150.13 ± 171.85 mg/min). The time spent by glucose inside the tubules before entering the bladder compartment varied between 1.66 ± 0.73 min and 2.45 ± 1.01 min. The PTR model proved much better than RTH at fitting observations, by correctly reproducing the delay of variations of glycosuria with respect to the driving glycemia, and by predicting non-zero urinary glucose elimination at low glycemias. This model is useful when studying both transients and steady-state glucose elimination as well as in assessing drug-related changes in renal glucose excretion.


Conflict of interest statement

Competing Interests: The authors declare that the affiliation of Dr. Thomas Hardy is the commercial company Eli Lilly & Co., Indianapolis IN, USA and that this does not alter their adherence to all the PLOS ONE policies on sharing data and materials.

Figures

Figure 1
Figure 1. Schematic representation of renal anatomy, experimental set-up, and modeling.
Panel A reports a schematic representation of renal anatomy and of the experimental set-up; panel B reports the schematic compartmental diagram of the Glycemia Model as well as of the Tubular System.
Figure 2
Figure 2. Observed and predicted Plasma Glucose Concentrations.
Observed and Predicted Plasma Glucose concentrations (mM) over Time (min) as derived from the two-compartment model for the five analyzed subjects.
Figure 3
Figure 3. Observed and predicted urinary glucose loss when plasma glucose concentrations are interpolated.
Columns on the left report the observed Urinary glucose loss [mmol/min] (circles) over Time [min] along with their prediction obtained with the RTH model letting the Slope vary (dashed line), with the RTH model fixing the Slope at 1 (dotted line) and with the PTR model (thick continuous line). Columns on the right report the same observed Urinary glucose loss (circles), linked with a thin continuous line, in correspondence of the interpolated observed Plasma glucose concentrations [mM], along with urinary glucose loss predictions obtained with the RTH model letting the Slope vary (dashed lines), with the RTH model fixing the Slope at 1 (dotted line) and with the PTR Model (thick continuous line).
Figure 4
Figure 4. Observed and predicted urinary glucose loss when plasma glucose concentrations are fitted with the two-compartment model.
Columns on the left report the observed Urinary glucose loss [mmol/min] (circles) over Time [min] along with their prediction obtained with the RTH model letting the Slope vary (dashed line), with the RTH model fixing the Slope at 1 (dotted line) and with the PTR model (thick continuous lines). Columns on the right report the same observed Urinary glucose loss (circles), linked with a thin continuous line, in correspondence of the predicted Plasma glucose concentrations [mM] s derived from the two-compartment model for glycemia, along with urinary glucose loss predictions obtained with the RTH model letting the Slope vary (dashed lines), with the RTH model fixing the Slope at 1 (dotted line) and with the PTR Model (thick continuous line).

References

    1. Triplitt CL (2012) Examining the mechanisms of glucose regulation. Am J Manag Care 18: S4–10 44183 [pii]. - PubMed
    1. Gerich JE (2010) Role of the kidney in normal glucose homeostasis and in the hyperglycaemia of diabetes mellitus: therapeutic implications. Diabet Med 27: 136–142 DME2894 [pii];10.1111/j.1464-5491.2009.02894.x [doi] - DOI - PMC - PubMed
    1. Defronzo RA, Davidson JA, Del PS (2012) The role of the kidneys in glucose homeostasis: a new path towards normalizing glycaemia. Diabetes Obes Metab 14: 5–14 10.1111/j.1463-1326.2011.01511.x [doi] - DOI - PubMed
    1. Kanai Y, Lee WS, You G, Brown D, Hediger MA (1994) The human kidney low affinity Na+/glucose cotransporter SGLT2. Delineation of the major renal reabsorptive mechanism for D-glucose. J Clin Invest 93: 397–404 10.1172/JCI116972 [doi] - DOI - PMC - PubMed
    1. Hummel CS, Lu C, Loo DD, Hirayama BA, Voss AA, et al. (2011) Glucose transport by human renal Na+/D-glucose cotransporters SGLT1 and SGLT2. Am J Physiol Cell Physiol 300: C14–C21 ajpcell.00388.2010 [pii];10.1152/ajpcell.00388.2010 [doi] - DOI - PMC - PubMed