

Loss of connectivity in cancer co-expression networks
- PMID: 24489837
- PMCID: PMC3904972
- DOI: 10.1371/journal.pone.0087075
Loss of connectivity in cancer co-expression networks
Abstract
Differential gene expression profiling studies have lead to the identification of several disease biomarkers. However, the oncogenic alterations in coding regions can modify the gene functions without affecting their own expression profiles. Moreover, post-translational modifications can modify the activity of the coded protein without altering the expression levels of the coding gene, but eliciting variations to the expression levels of the regulated genes. These considerations motivate the study of the rewiring of networks co-expressed genes as a consequence of the aforementioned alterations in order to complement the informative content of differential expression. We analyzed 339 mRNAomes of five distinct cancer types to find single genes that presented co-expression patterns strongly differentiated between normal and tumor phenotypes. Our analysis of differentially connected genes indicates the loss of connectivity as a common topological trait of cancer networks, and unveils novel candidate cancer genes. Moreover, our integrated approach that combines the differential expression together with the differential connectivity improves the classic enrichment pathway analysis providing novel insights on putative cancer gene biosystems not still fully investigated.
Conflict of interest statement
Figures
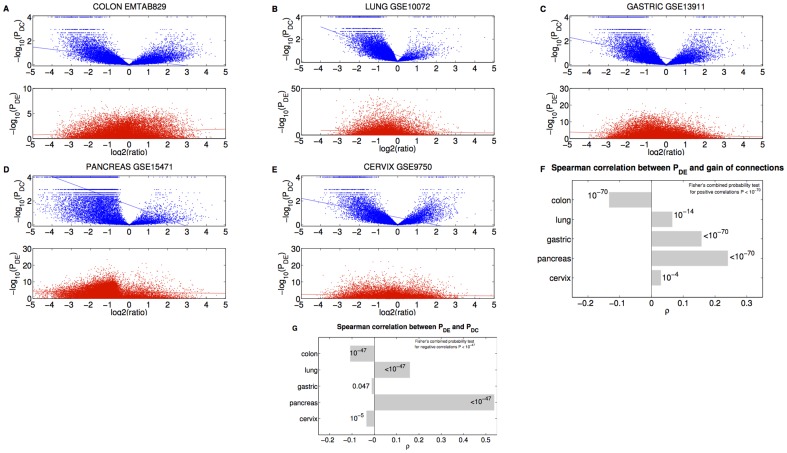
 as a function of degree ratio
  . (Lower panel) Gene differential expression p-value
  as a function of degree ratio
  . Each point represents a gene and the trend line is the least-square line. (F) Correlations between the differential expression p-value and the gain of connections. P-values on the bars refer to right-tail tests for the positive correlations, and left-tail tests for the negative correlations. (G) Correlations between differential expression p-values and differential connection p-values.
References
-
- Kitano H (2002) Computational systems biology. Nature 420: 206–210. - PubMed
-
- Kitano H (2012) Systems biology powered by arti_cial intelligence. In: PRICAI 2012: Trends in Artificial Intelligence - 12th Pacific Rim International Conference on Artificial Intelligence, Kuching, Malaysia, September 3-7, 2012. Proceedings. Springer, Lecture Notes in Computer Science, p. 1.
-
- Liang P, Pardee AB (2003) Analysing differential gene expression in cancer. Nat Rev Cancer 3: 869–876. - PubMed
Publication types
MeSH terms
Substances
LinkOut - more resources
Full Text Sources
Other Literature Sources
