

A conversion formula for comparing pulse oximeter desaturation rates obtained with different averaging times
- PMID: 24489887
- PMCID: PMC3904986
- DOI: 10.1371/journal.pone.0087280
A conversion formula for comparing pulse oximeter desaturation rates obtained with different averaging times
Abstract
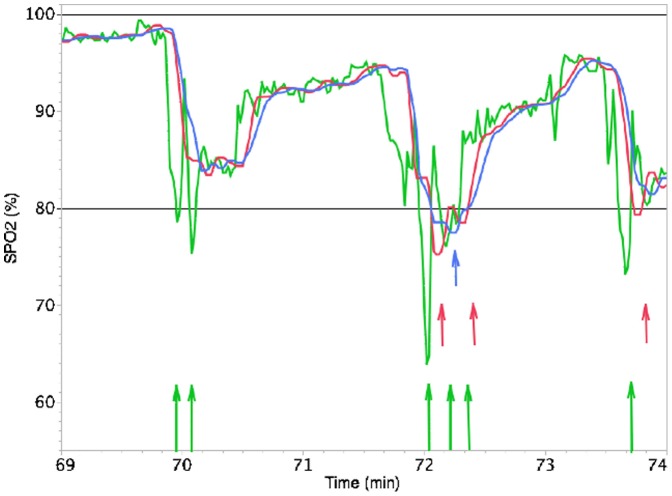
Objective: The number of desaturations determined in recordings of pulse oximeter saturation (SpO2) primarily depends on the time over which values are averaged. As the averaging time in pulse oximeters is not standardized, it varies considerably between centers. To make SpO2 data comparable, it is thus desirable to have a formula that allows conversion between desaturation rates obtained using different averaging times for various desaturation levels and minimal durations.
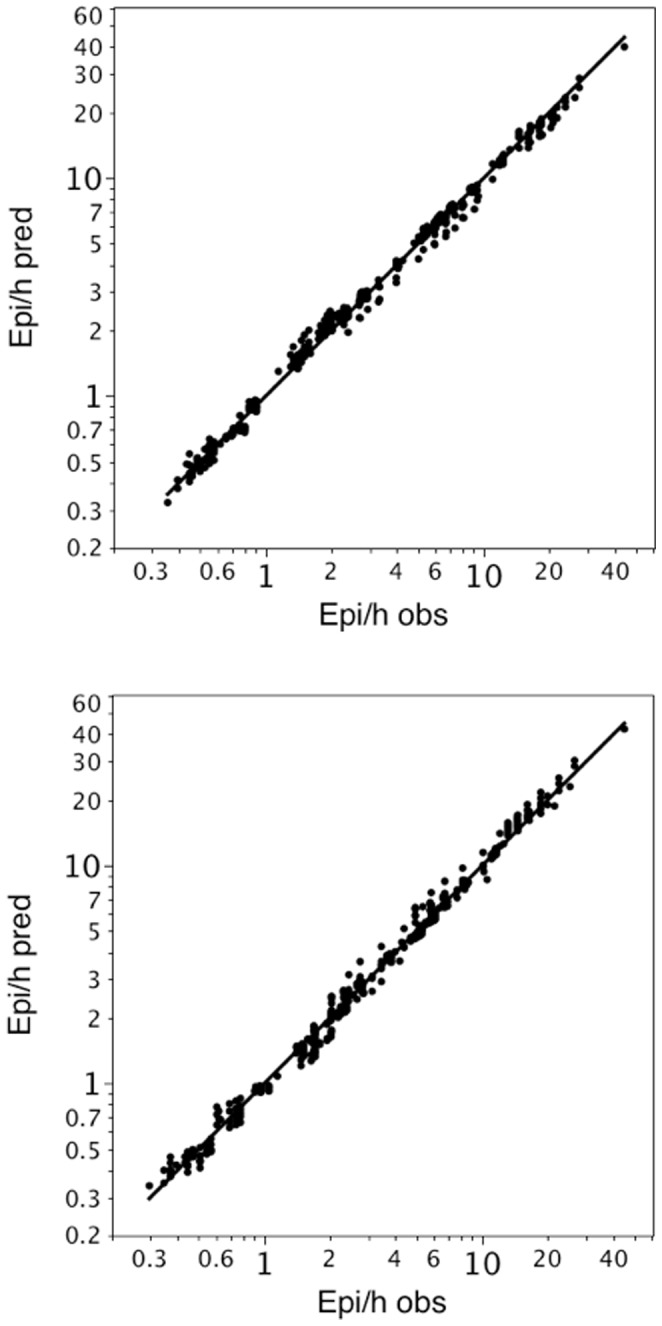
Methods: Oxygen saturation was measured for 170 hours in 12 preterm infants with a mean number of 65 desaturations <90% per hour of arbitrary duration by using a pulse oximeter in a 2-4 s averaging mode. Using 7 different averaging times between 3 and 16 seconds, the raw red-to-infrared data were reprocessed to determine the number of desaturations (D). The whole procedure was carried out for 7 different minimal desaturation durations (≥ 1, ≥ 5, ≥ 10, ≥ 15, ≥ 20, ≥ 25, ≥ 30 s) below SpO2 threshold values of 80%, 85% or 90% to finally reach a conversion formula. The formula was validated by splitting the infants into two groups of six children each and using one group each as a training set and the other one as a test set.
Results: Based on the linear relationship found between the logarithm of the desaturation rate and the logarithm of the averaging time, the conversion formula is: D2 = D1 (T2/T1)(c), where D2 is the desaturation rate for the desired averaging time T2, and D1 is the desaturation rate for the original averaging time T1, with the exponent c depending on the desaturation threshold and the minimal desaturation duration. The median error when applying this formula was 2.6%.
Conclusion: This formula enables the conversion of desaturation rates between different averaging times for various desaturation thresholds and minimal desaturation durations.
Conflict of interest statement
Figures
References
-
- Hay WW Jr, Brockway JM, Eyzaguirre M (1989) Neonatal pulse oximetry: accuracy and reliability. Pediatrics 83: 717–722. - PubMed
-
- Salyer JW (2003) Neonatal and pediatric pulse oximetry. Respir Care 48: 386–396 discussion 397–388. - PubMed
-
- Langton JA, Hanning CD (1990) Effect of motion artefact on pulse oximeters: evaluation of four instruments and finger probes. Br J Anaesth 65: 564–570. - PubMed
-
- Barker SJ (2002) “Motion-resistant” pulse oximetry: a comparison of new and old models. Anesth Analg 95: : 967–972, table of contents. - PubMed
-
- Severinghaus JW, Spellman MJ Jr (1990) Pulse oximeter failure thresholds in hypotension and vasoconstriction. Anesthesiology 73: 532–537. - PubMed
MeSH terms
Substances
LinkOut - more resources
Full Text Sources
Other Literature Sources
Research Materials
