

Chronic oxidative stress increases growth and tumorigenic potential of MCF-7 breast cancer cells
- PMID: 24489904
- PMCID: PMC3905021
- DOI: 10.1371/journal.pone.0087371
Chronic oxidative stress increases growth and tumorigenic potential of MCF-7 breast cancer cells
Erratum in
- PLoS One. 2014;9(4):e93799
Abstract
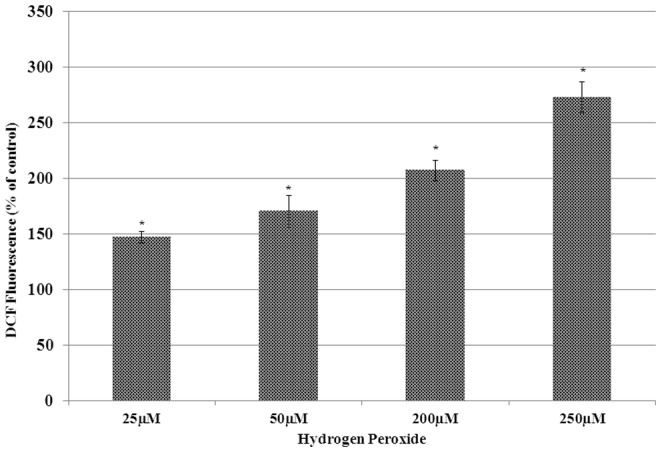
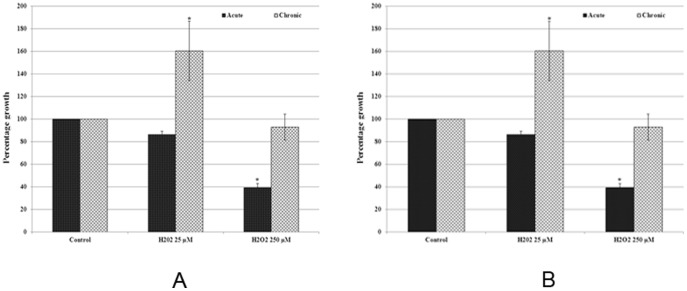
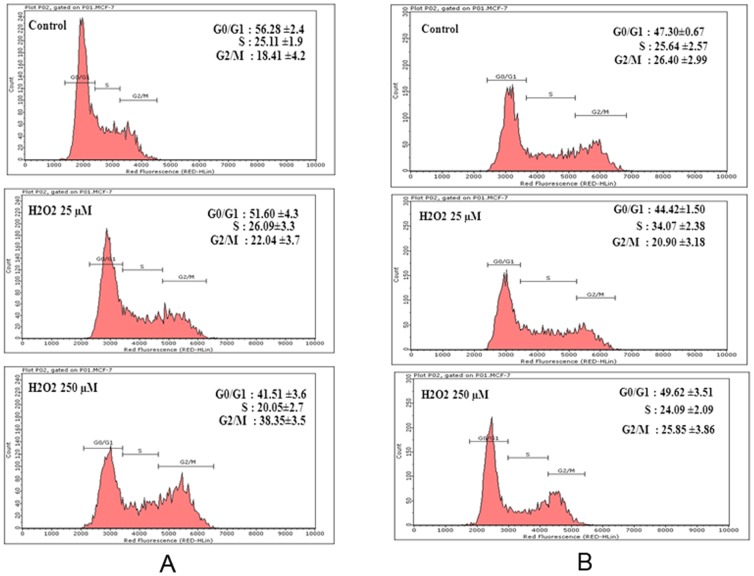
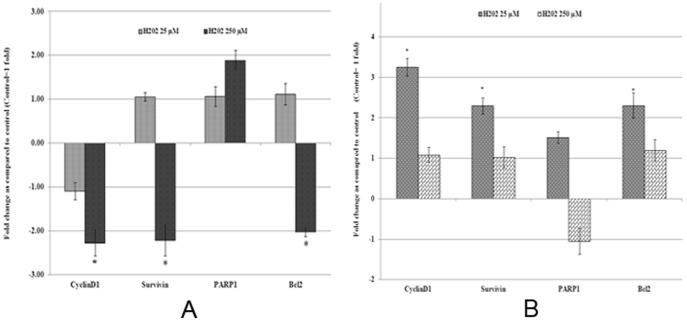
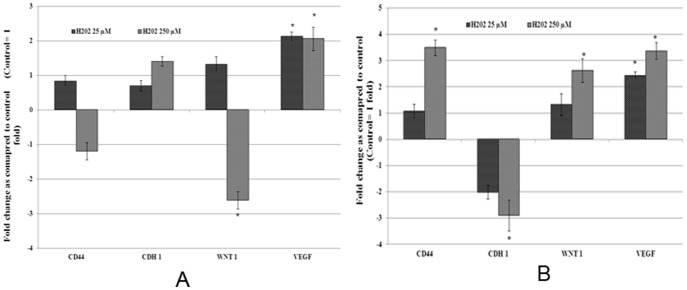
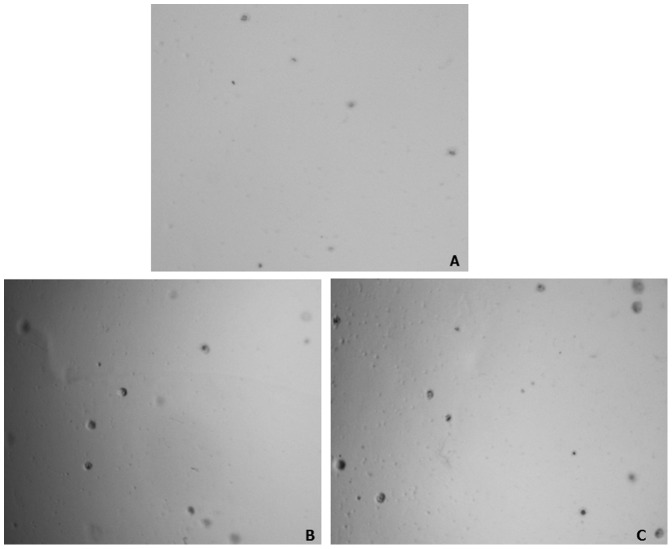
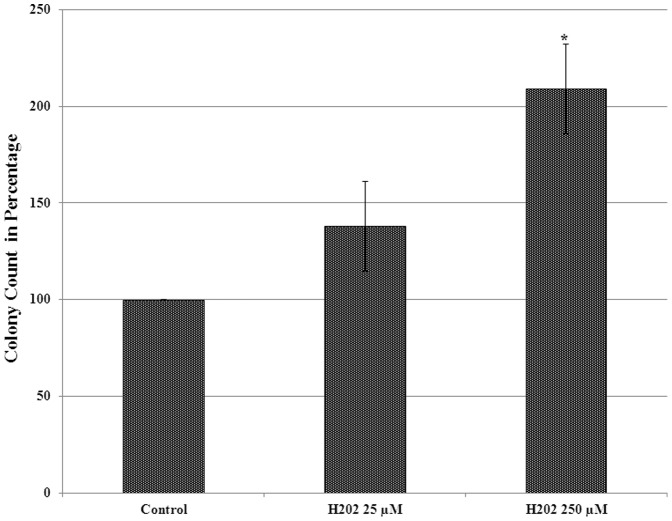
Accumulating evidence suggests that exposures to elevated levels of either endogenous estrogen or environmental estrogenic chemicals are associated with breast cancer development and progression. These natural or synthetic estrogens are known to produce reactive oxygen species (ROS) and increased ROS has been implicated in both cellular apoptosis and carcinogenesis. Though there are several studies on direct involvement of ROS in cellular apoptosis using short-term exposure model, there is no experimental evidence to directly implicate chronic exposure to ROS in increased growth and tumorigenicity of breast cancer cells. Therefore, the objective of this study was to evaluate the effects of chronic oxidative stress on growth, survival and tumorigenic potential of MCF-7 breast cancer cells. MCF-7 cells were exposed to exogenous hydrogen peroxide (H2O2) as a source of ROS at doses of 25 µM and 250 µM for acute (24 hours) and chronic period (3 months) and their effects on cell growth/survival and tumorigenic potential were evaluated. The results of cell count, MTT and cell cycle analysis showed that while acute exposure inhibits the growth of MCF-7 cells in a dose-dependent manner, the chronic exposure to H2O2-induced ROS leads to increased cell growth and survival of MCF-7 cells. This was further confirmed by gene expression analysis of cell cycle and cell survival related genes. Significant increase in number of soft agar colonies, up-regulation of pro-metastatic genes VEGF, WNT1 and CD44, whereas down-regulation of anti-metastatic gene E-Cadherin in H2O2 treated MCF-7 cells observed in this study further suggests that persistent exposure to oxidative stress increases tumorigenic and metastatic potential of MCF-7 cells. Since many chemotherapeutic drugs are known to induce their cytotoxicity by increasing ROS levels, the results of this study are also highly significant in understanding the mechanism for adaptation to ROS-induced toxicity leading to acquired chemotherapeutic resistance in breast cancer cells.
Conflict of interest statement
Figures
Similar articles
-
Oestrogen receptor-regulated glutathione S-transferase mu 3 expression attenuates hydrogen peroxide-induced cytotoxicity, which confers tamoxifen resistance on breast cancer cells.Breast Cancer Res Treat. 2018 Nov;172(1):45-59. doi: 10.1007/s10549-018-4897-5. Epub 2018 Jul 27. Breast Cancer Res Treat. 2018. PMID: 30054830
-
Effects of glutamine deprivation on oxidative stress and cell survival in breast cell lines.Biol Res. 2019 Mar 27;52(1):15. doi: 10.1186/s40659-019-0224-9. Biol Res. 2019. PMID: 30917872 Free PMC article.
-
Cadmium induces reactive oxygen species-dependent apoptosis in MCF-7 human breast cancer cell line.Toxicol Mech Methods. 2015 Jan;25(1):48-55. doi: 10.3109/15376516.2014.985353. Toxicol Mech Methods. 2015. PMID: 25403798
-
A vicious circle in breast cancer: The interplay between inflammation, reactive oxygen species, and microRNAs.Front Oncol. 2022 Sep 26;12:980694. doi: 10.3389/fonc.2022.980694. eCollection 2022. Front Oncol. 2022. PMID: 36226048 Free PMC article. Review.
-
Therapeutic Potential of Reactive Oxygen Species: State of the Art and Recent Advances.SLAS Technol. 2021 Apr;26(2):140-158. doi: 10.1177/2472630320977450. Epub 2020 Dec 21. SLAS Technol. 2021. PMID: 33345675 Review.
Cited by
-
Targeting peroxiredoxin 1 impairs growth of breast cancer cells and potently sensitises these cells to prooxidant agents.Br J Cancer. 2018 Oct;119(7):873-884. doi: 10.1038/s41416-018-0263-y. Epub 2018 Oct 5. Br J Cancer. 2018. PMID: 30287919 Free PMC article.
-
The Impact of Fullerenes as Doxorubicin Nano-Transporters on Metallothionein and Superoxide Dismutase Status in MCF-10A Cells.Pharmaceutics. 2022 Jan 2;14(1):102. doi: 10.3390/pharmaceutics14010102. Pharmaceutics. 2022. PMID: 35056998 Free PMC article.
-
Glucosamine and Silibinin Alter Cartilage Homeostasis through Glycosylation and Cellular Stresses in Human Chondrocyte Cells.Int J Mol Sci. 2024 Apr 30;25(9):4905. doi: 10.3390/ijms25094905. Int J Mol Sci. 2024. PMID: 38732122 Free PMC article.
-
Long-Term Exposure to Real-Life Polyethylene Terephthalate Nanoplastics Induces Carcinogenesis In Vitro.Environ Sci Technol. 2025 Jun 10;59(22):10891-10904. doi: 10.1021/acs.est.5c01628. Epub 2025 Jun 2. Environ Sci Technol. 2025. PMID: 40452141 Free PMC article.
-
Oxystressed tumor microenvironment potentiates epithelial to mesenchymal transition and alters cellular bioenergetics towards cancer progression.Tumour Biol. 2016 Oct;37(10):13307-13322. doi: 10.1007/s13277-016-5224-6. Epub 2016 Jul 26. Tumour Biol. 2016. PMID: 27460079
References
-
- Brody JG, Rudel RA, Michels KB, Moysich KB, Bernstein L, et al. (2007) Environmental pollutants, diet, physical activity, body size, and breast cancer: where do we stand in research to identify opportunities for prevention? Cancer 109: 2627–2634. - PubMed
MeSH terms
Substances
LinkOut - more resources
Full Text Sources
Other Literature Sources
Miscellaneous
