

Population-based studies of myocardial hypertrophy: high resolution cardiovascular magnetic resonance atlases improve statistical power
- PMID: 24490638
- PMCID: PMC3914701
- DOI: 10.1186/1532-429X-16-16
Population-based studies of myocardial hypertrophy: high resolution cardiovascular magnetic resonance atlases improve statistical power
Abstract
Background: Cardiac phenotypes, such as left ventricular (LV) mass, demonstrate high heritability although most genes associated with these complex traits remain unidentified. Genome-wide association studies (GWAS) have relied on conventional 2D cardiovascular magnetic resonance (CMR) as the gold-standard for phenotyping. However this technique is insensitive to the regional variations in wall thickness which are often associated with left ventricular hypertrophy and require large cohorts to reach significance. Here we test whether automated cardiac phenotyping using high spatial resolution CMR atlases can achieve improved precision for mapping wall thickness in healthy populations and whether smaller sample sizes are required compared to conventional methods.
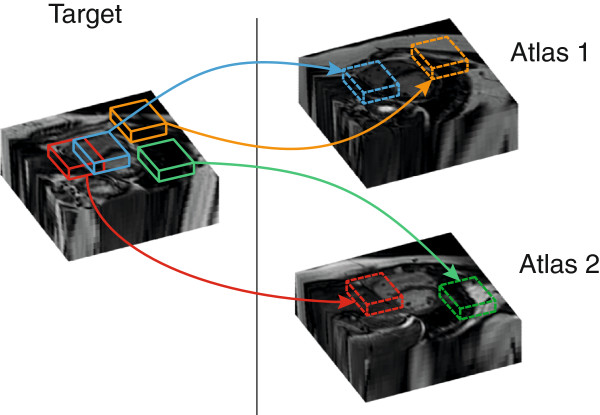
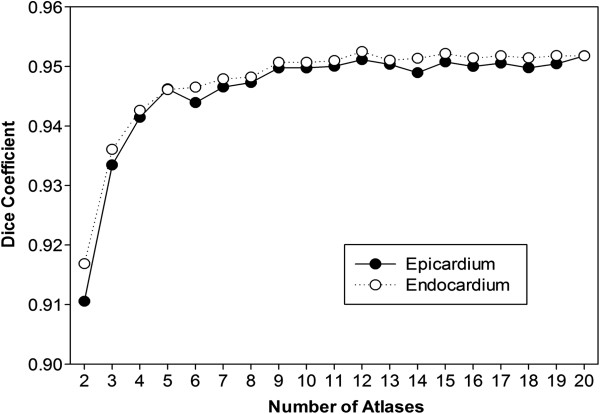
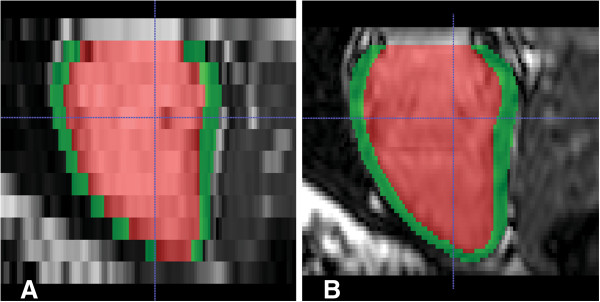
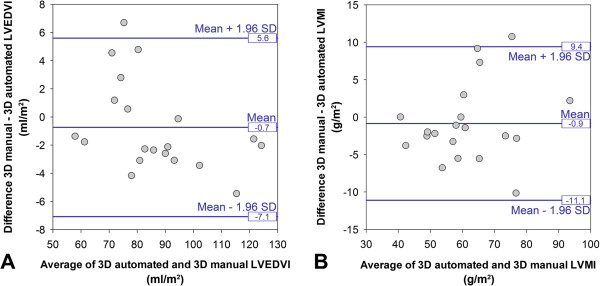
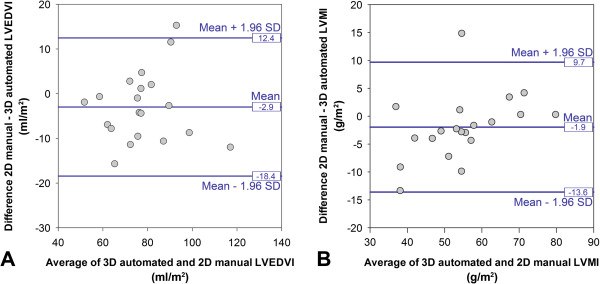
Methods: LV short-axis cine images were acquired in 138 healthy volunteers using standard 2D imaging and 3D high spatial resolution CMR. A multi-atlas technique was used to segment and co-register each image. The agreement between methods for end-diastolic volume and mass was made using Bland-Altman analysis in 20 subjects. The 3D and 2D segmentations of the LV were compared to manual labeling by the proportion of concordant voxels (Dice coefficient) and the distances separating corresponding points. Parametric and nonparametric data were analysed with paired t-tests and Wilcoxon signed-rank test respectively. Voxelwise power calculations used the interstudy variances of wall thickness.
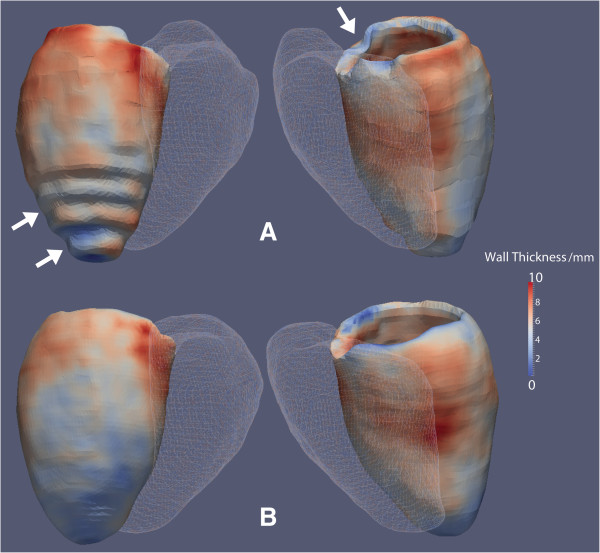
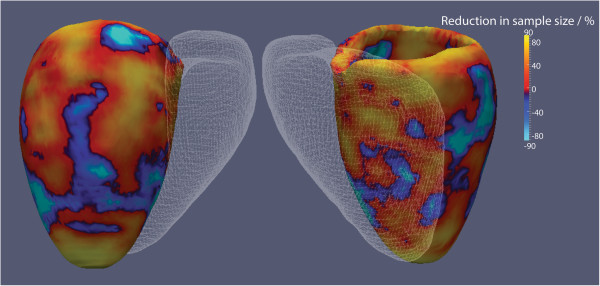
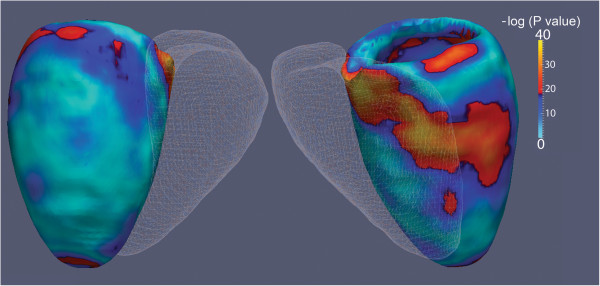
Results: The 3D volumetric measurements showed no bias compared to 2D imaging. The segmented 3D images were more accurate than 2D images for defining the epicardium (Dice: 0.95 vs 0.93, P<0.001; mean error 1.3 mm vs 2.2 mm, P<0.001) and endocardium (Dice 0.95 vs 0.93, P<0.001; mean error 1.1 mm vs 2.0 mm, P<0.001). The 3D technique resulted in significant differences in wall thickness assessment at the base, septum and apex of the LV compared to 2D (P<0.001). Fewer subjects were required for 3D imaging to detect a 1 mm difference in wall thickness (72 vs 56, P<0.001).
Conclusions: High spatial resolution CMR with automated phenotyping provides greater power for mapping wall thickness than conventional 2D imaging and enables a reduction in the sample size required for studies of environmental and genetic determinants of LV wall thickness.
Figures
Similar articles
-
Compressed sensing real-time cine cardiovascular magnetic resonance: accurate assessment of left ventricular function in a single-breath-hold.J Cardiovasc Magn Reson. 2016 Aug 24;18(1):50. doi: 10.1186/s12968-016-0271-0. J Cardiovasc Magn Reson. 2016. PMID: 27553656 Free PMC article.
-
Relationship between body composition and left ventricular geometry using three dimensional cardiovascular magnetic resonance.J Cardiovasc Magn Reson. 2016 May 31;18(1):32. doi: 10.1186/s12968-016-0251-4. J Cardiovasc Magn Reson. 2016. PMID: 27245154 Free PMC article.
-
Precursors of Hypertensive Heart Phenotype Develop in Healthy Adults: A High-Resolution 3D MRI Study.JACC Cardiovasc Imaging. 2015 Nov;8(11):1260-9. doi: 10.1016/j.jcmg.2015.08.007. Epub 2015 Oct 14. JACC Cardiovasc Imaging. 2015. PMID: 26476505 Free PMC article.
-
Three-dimensional left ventricular segmentation from magnetic resonance imaging for patient-specific modelling purposes.Europace. 2014 Nov;16 Suppl 4(Suppl 4):iv96-iv101. doi: 10.1093/europace/euu232. Europace. 2014. PMID: 25362176 Free PMC article.
-
Clinical applications of multiparametric CMR in left ventricular hypertrophy.Int J Cardiovasc Imaging. 2018 Apr;34(4):577-585. doi: 10.1007/s10554-018-1320-6. Epub 2018 Mar 3. Int J Cardiovasc Imaging. 2018. PMID: 29500729 Review.
Cited by
-
Deep Learning-Based Estimation of Myocardial Material Parameters from Cardiac MRI.Bioengineering (Basel). 2025 Apr 21;12(4):433. doi: 10.3390/bioengineering12040433. Bioengineering (Basel). 2025. PMID: 40281793 Free PMC article.
-
Translating principles of quality control to cardiovascular magnetic resonance: assessing quantitative parameters of the left ventricle in a large cohort.Sci Rep. 2023 Feb 7;13(1):2205. doi: 10.1038/s41598-023-29028-7. Sci Rep. 2023. PMID: 36750647 Free PMC article.
-
Evaluating reinforcement learning agents for anatomical landmark detection.Med Image Anal. 2019 Apr;53:156-164. doi: 10.1016/j.media.2019.02.007. Epub 2019 Feb 14. Med Image Anal. 2019. PMID: 30784956 Free PMC article.
-
Automatic 3D Bi-Ventricular Segmentation of Cardiac Images by a Shape-Refined Multi- Task Deep Learning Approach.IEEE Trans Med Imaging. 2019 Sep;38(9):2151-2164. doi: 10.1109/TMI.2019.2894322. Epub 2019 Jan 23. IEEE Trans Med Imaging. 2019. PMID: 30676949 Free PMC article.
-
Artificial Intelligence for Cardiac Imaging-Genetics Research.Front Cardiovasc Med. 2020 Jan 21;6:195. doi: 10.3389/fcvm.2019.00195. eCollection 2019. Front Cardiovasc Med. 2020. PMID: 32039240 Free PMC article. Review.
References
-
- Vasan RS, Glazer NL, Felix JF, Lieb W, Wild PS, Felix SB, Watzinger N, Larson MG, Smith NL, Dehghan A. et al.Genetic variants associated with cardiac structure and function: a meta-analysis and replication of genome-wide association data. JAMA. 2009;302:168–178. doi: 10.1001/jama.2009.978-a. - DOI - PMC - PubMed
Publication types
MeSH terms
Grants and funding
LinkOut - more resources
Full Text Sources
Other Literature Sources
Miscellaneous
