

Longitudinal measurements of MRI-T2 in boys with Duchenne muscular dystrophy: effects of age and disease progression
- PMID: 24491484
- PMCID: PMC4277599
- DOI: 10.1016/j.nmd.2013.12.012
Longitudinal measurements of MRI-T2 in boys with Duchenne muscular dystrophy: effects of age and disease progression
Abstract
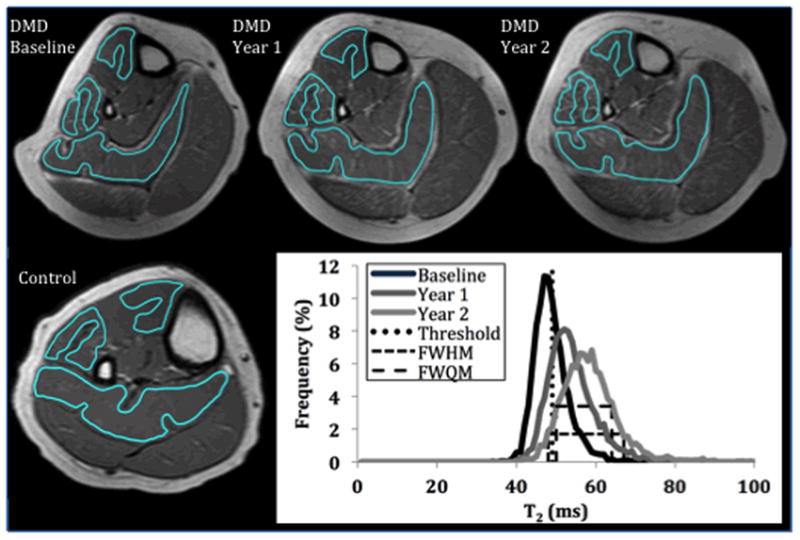
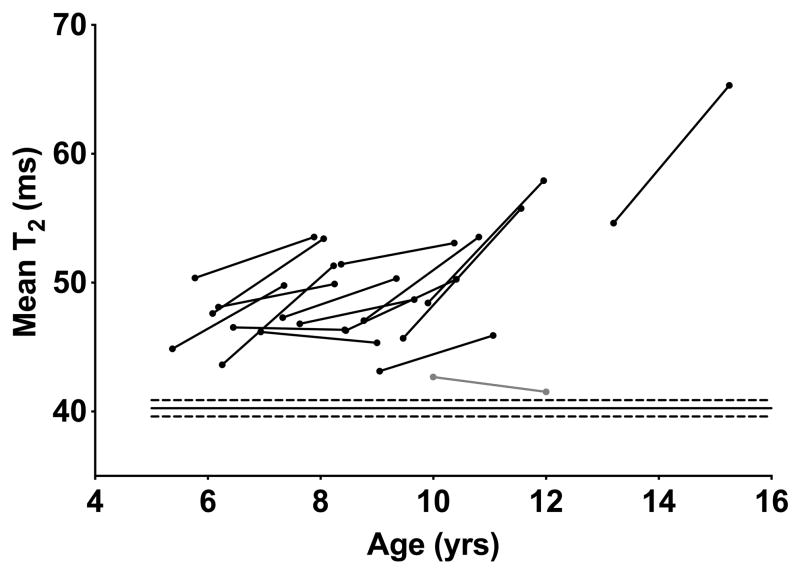
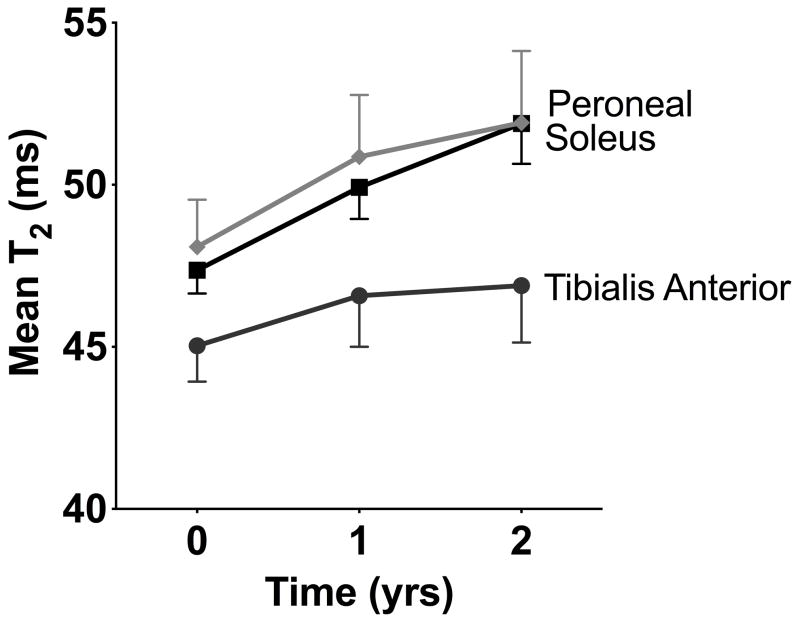
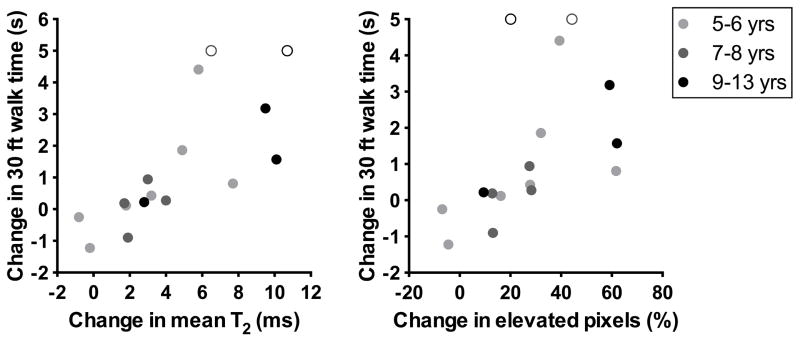
Duchenne muscular dystrophy (DMD) is characterized by an increased muscle damage and progressive replacement of muscle by noncontractile tissue. Both of these pathological changes can lengthen the MRI transverse proton relaxation time (T2). The current study measured longitudinal changes in T2 and its distribution in the lower leg of 16 boys with DMD (5-13years, 15 ambulatory) and 15 healthy controls (5-13years). These muscles were chosen to allow extended longitudinal monitoring, due to their slow progression compared with proximal muscles in DMD. In the soleus muscle of boys with DMD, T2 and the percentage of pixels with an elevated T2 (⩾2SD above control mean T2) increased significantly over 1year and 2years, while the width of the T2 histogram increased over 2years. Changes in soleus T2 variables were significantly greater in 9-13years old compared with 5-8years old boys with DMD. Significant correlations between the change in all soleus T2 variables over 2years and the change in functional measures over 2years were found. MRI measurement of muscle T2 in boys with DMD is sensitive to disease progression and shows promise as a clinical outcome measure.
Keywords: 30 Foot walk; Duchenne muscular dystrophy; Magnetic resonance imaging; Transverse relaxation time.
Copyright © 2014 Elsevier B.V. All rights reserved.
Figures

References
-
- Fraser LK, Childs AM, Miller M, et al. A cohort study of children and young people with progressive neuromuscular disorders: clinical and demographic profiles and changing patterns of referral for palliative care. Palliat Med. 2011 - PubMed
-
- Porter JD, Khanna S, Kaminski HJ, et al. A chronic inflammatory response dominates the skeletal muscle molecular signature in dystrophin-deficient mdx mice. Hum Mol Genet. 2002;11:263–72. - PubMed
-
- Cros D, Harnden P, Pellissier JF, Serratrice G. Muscle hypertrophy in Duchenne muscular dystrophy. A pathological and morphometric study. J Neurol. 1989;236:43–7. - PubMed
Publication types
MeSH terms
Grants and funding
LinkOut - more resources
Full Text Sources
Other Literature Sources
Medical
