

Retinal ganglion cell maps in the brain: implications for visual processing
- PMID: 24492089
- PMCID: PMC4086677
- DOI: 10.1016/j.conb.2013.08.006
Retinal ganglion cell maps in the brain: implications for visual processing
Abstract
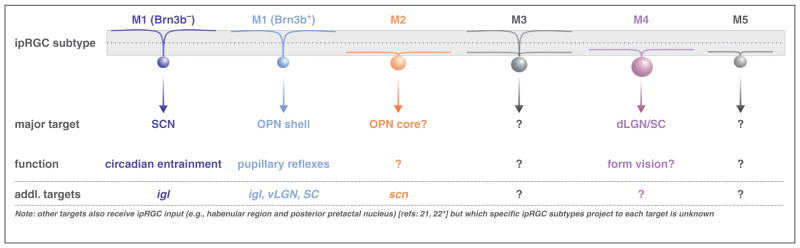
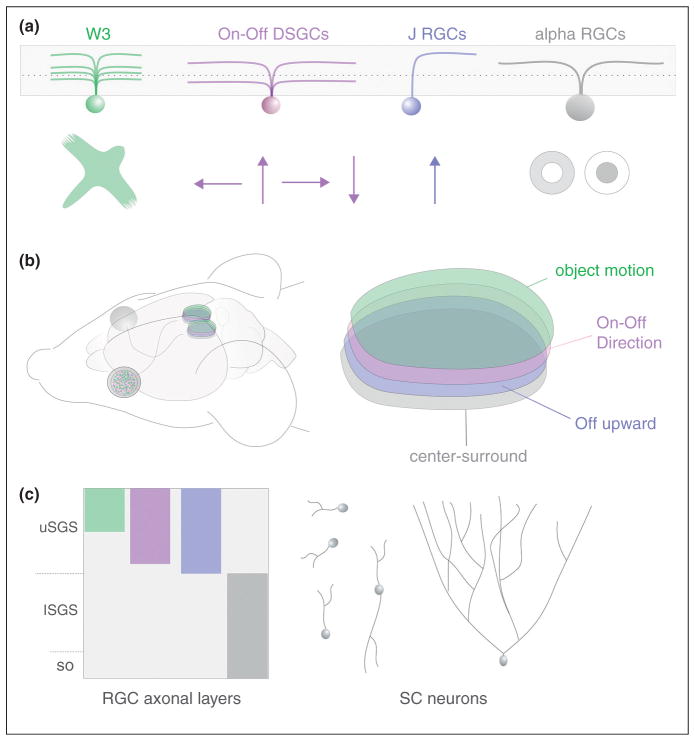
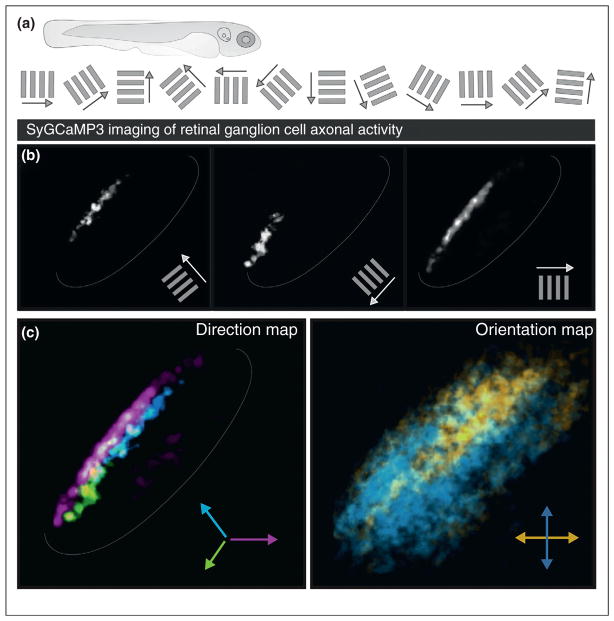
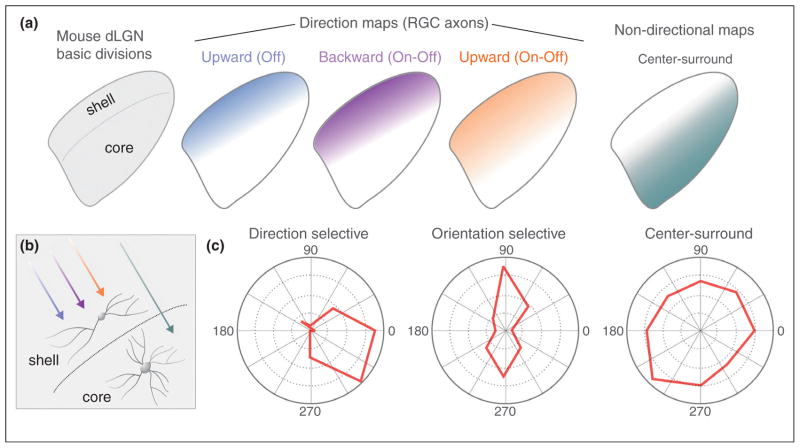
Everything the brain knows about the content of the visual world is built from the spiking activity of retinal ganglion cells (RGCs). As the output neurons of the eye, RGCs include ∼20 different subtypes, each responding best to a specific feature in the visual scene. Here we discuss recent advances in identifying where different RGC subtypes route visual information in the brain, including which targets they connect to and how their organization within those targets influences visual processing. We also highlight examples where causal links have been established between specific RGC subtypes, their maps of central connections and defined aspects of light-mediated behavior and we suggest the use of techniques that stand to extend these sorts of analyses to circuits underlying visual perception.
Copyright © 2013. Published by Elsevier Ltd.
Figures
Similar articles
-
Visual Neurons in the Superior Colliculus Innervated by Islet2+ or Islet2- Retinal Ganglion Cells Display Distinct Tuning Properties.Front Neural Circuits. 2017 Oct 10;11:73. doi: 10.3389/fncir.2017.00073. eCollection 2017. Front Neural Circuits. 2017. PMID: 29066954 Free PMC article.
-
Interlayer Repulsion of Retinal Ganglion Cell Mosaics Regulates Spatial Organization of Functional Maps in the Visual Cortex.J Neurosci. 2017 Dec 13;37(50):12141-12152. doi: 10.1523/JNEUROSCI.1873-17.2017. Epub 2017 Nov 7. J Neurosci. 2017. PMID: 29114075 Free PMC article.
-
Structure and function of parallel pathways in the primate early visual system.J Physiol. 2005 Jul 1;566(Pt 1):13-9. doi: 10.1113/jphysiol.2005.088047. Epub 2005 May 19. J Physiol. 2005. PMID: 15905213 Free PMC article. Review.
-
Seeing with the visual cortex.Ital J Neurol Sci. 1984 Jun;5(2):133-53. doi: 10.1007/BF02043216. Ital J Neurol Sci. 1984. PMID: 6432725 Review.
-
A Pixel-Encoder Retinal Ganglion Cell with Spatially Offset Excitatory and Inhibitory Receptive Fields.Cell Rep. 2018 Feb 6;22(6):1462-1472. doi: 10.1016/j.celrep.2018.01.037. Cell Rep. 2018. PMID: 29425502 Free PMC article.
Cited by
-
Blindness: Assassins of eyesight.Nature. 2015 Nov 26;527(7579):456-7. doi: 10.1038/527456a. Nature. 2015. PMID: 26607542 No abstract available.
-
Control of Retinal Ganglion Cell Positioning and Neurite Growth: Combining 3D Printing with Radial Electrospun Scaffolds.Tissue Eng Part A. 2016 Feb;22(3-4):286-94. doi: 10.1089/ten.TEA.2015.0373. Epub 2016 Jan 27. Tissue Eng Part A. 2016. PMID: 26729061 Free PMC article.
-
Not a one-trick pony: Diverse connectivity and functions of the rodent lateral geniculate complex.Vis Neurosci. 2017 Jan;34:E012. doi: 10.1017/S0952523817000098. Vis Neurosci. 2017. PMID: 28965517 Free PMC article. Review.
-
Dorsal raphe nucleus projecting retinal ganglion cells: Why Y cells?Neurosci Biobehav Rev. 2015 Oct;57:118-31. doi: 10.1016/j.neubiorev.2015.08.004. Epub 2015 Aug 5. Neurosci Biobehav Rev. 2015. PMID: 26363667 Free PMC article. Review.
-
Sox11 Expression Promotes Regeneration of Some Retinal Ganglion Cell Types but Kills Others.Neuron. 2017 Jun 21;94(6):1112-1120.e4. doi: 10.1016/j.neuron.2017.05.035. Neuron. 2017. PMID: 28641110 Free PMC article.
References
-
- Lettvin JY, Maturana HR, McCulloch WS, Pitts WS. What the frog’s eye tells the frog’s brain. Proc Inst Radio Eng. 1959;47:1940–1951.
-
- Brown SP, He S, Masland RH. Receptive field microstructure and dendritic geometry of retinal ganglion cells. Neuron. 2000;27:371–383. - PubMed
-
- Usrey WM, Reppas JB, Reid RC. Specificity and strength of retinogeniculate connections. J Neurophysiol. 1999;82:3527–3540. - PubMed
Publication types
MeSH terms
Grants and funding
LinkOut - more resources
Full Text Sources
Other Literature Sources
Research Materials
