. 2014 Apr;184(4):1104-1118.
doi: 10.1016/j.ajpath.2013.12.015. Epub 2014 Jan 31.

Increased severity of tuberculosis in Guinea pigs with type 2 diabetes: a model of diabetes-tuberculosis comorbidity

Affiliations

Increased severity of tuberculosis in Guinea pigs with type 2 diabetes: a model of diabetes-tuberculosis comorbidity

Brendan K Podell et al. Am J Pathol. 2014 Apr.

Abstract

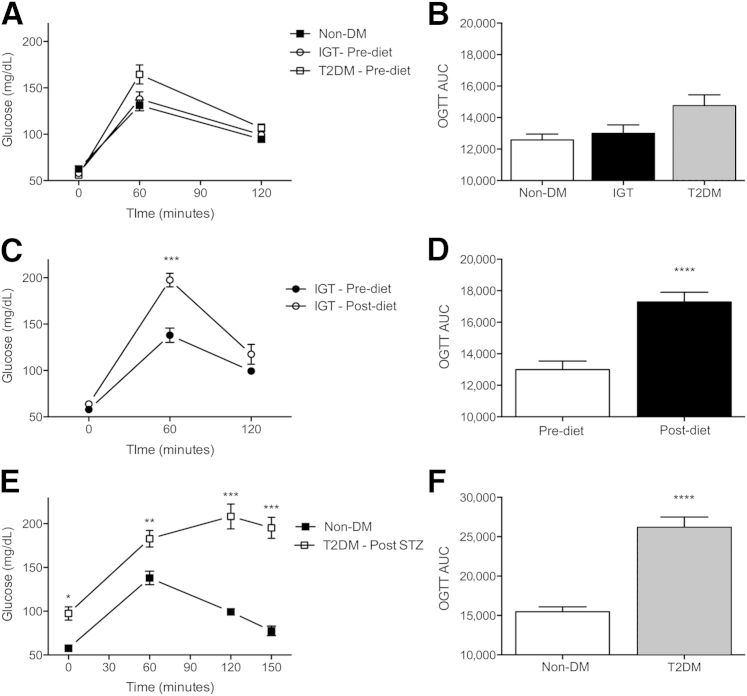
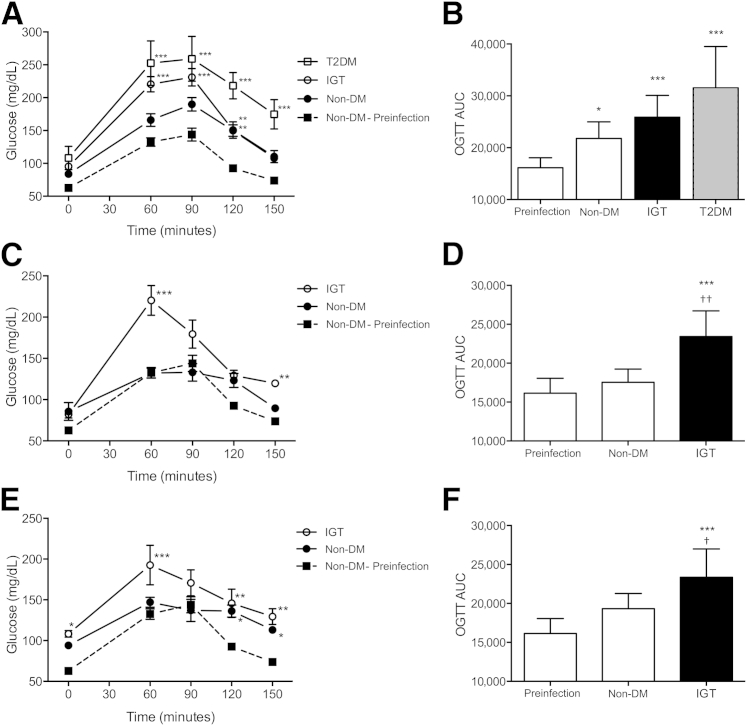
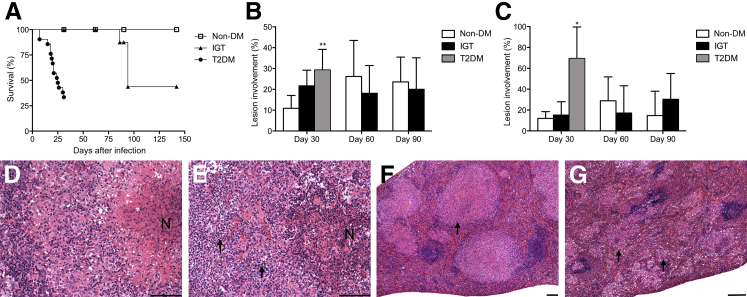
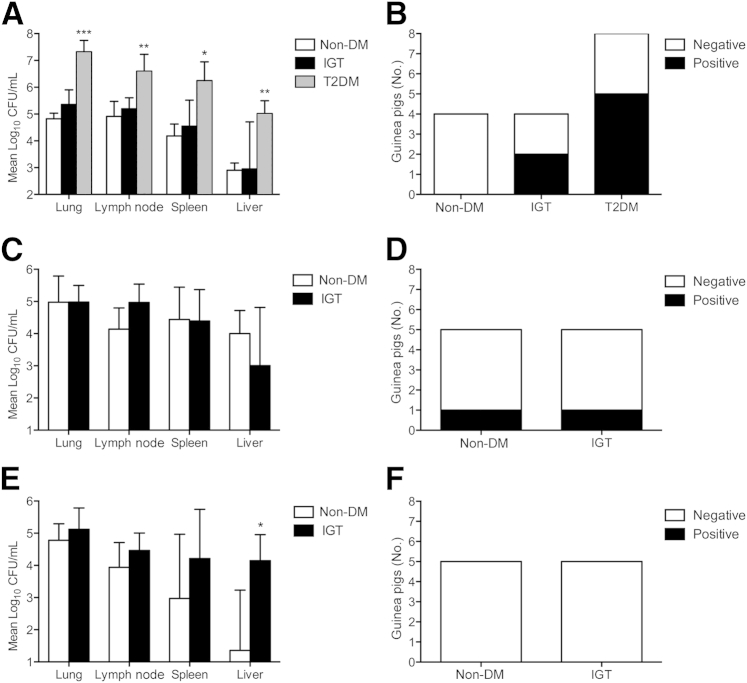
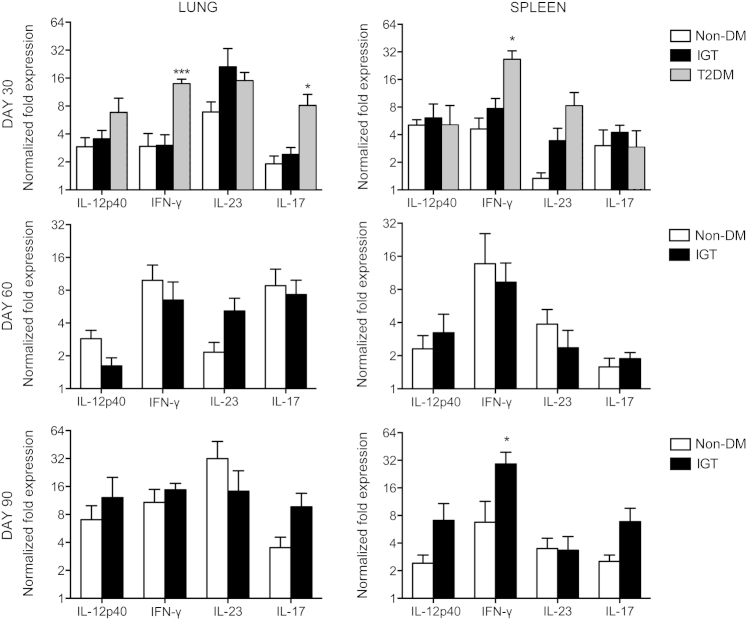
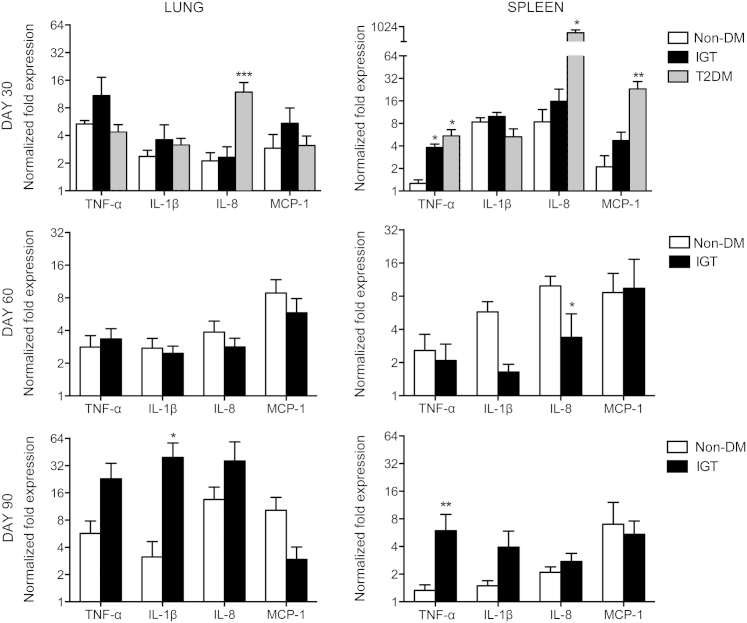
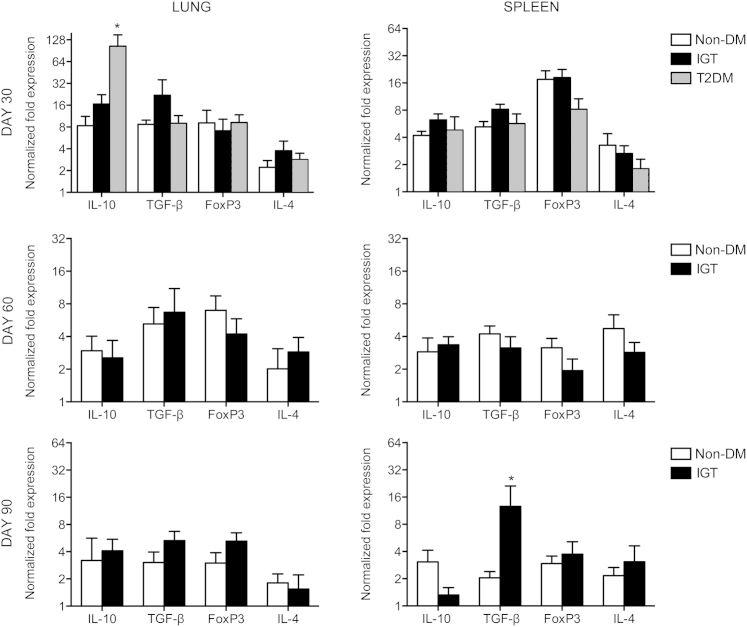
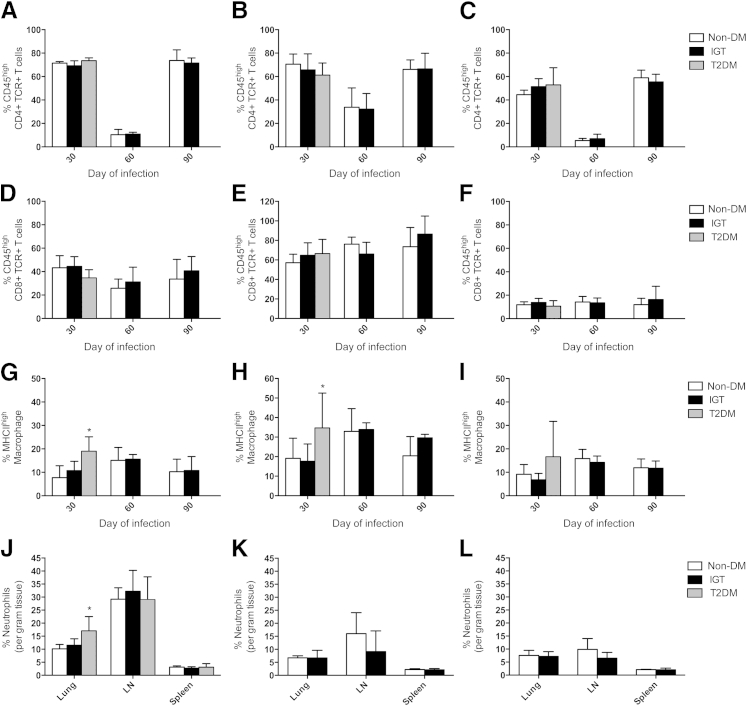
Impaired glucose tolerance and type 2 diabetes were induced in guinea pigs to model the emerging comorbidity of Mycobacterium tuberculosis infection in diabetic patients. Type 2 diabetes mellitus was induced by low-dose streptozotocin in guinea pigs rendered glucose intolerant by first feeding a high-fat, high-carbohydrate diet before M. tuberculosis exposure. M. tuberculosis infection of diabetic guinea pigs resulted in severe and rapidly progressive tuberculosis (TB) with a shortened survival interval, more severe pulmonary and extrapulmonary pathology, and a higher bacterial burden compared with glucose-intolerant and nondiabetic controls. Compared with nondiabetics, diabetic guinea pigs with TB had an exacerbated proinflammatory response with more severe granulocytic inflammation and higher gene expression for the cytokines/chemokines interferon-γ, IL-17A, IL-8, and IL-10 in the lung and for interferon-γ, tumor necrosis factor-α, IL-8, and monocyte chemoattractant protein-1 in the spleen. TB disease progression in guinea pigs with impaired glucose tolerance was similar to that of nondiabetic controls in the early stages of infection but was more severe by day 90. The guinea pig model of type 2 diabetes-TB comorbidity mimics important features of the naturally occurring disease in humans. This model will be beneficial in understanding the complex pathogenesis of TB in diabetic patients and to test new strategies to improve TB and diabetes control when the two diseases occur together.


Figures

Figure 1
Figure 1
Glucose tolerance is impaired in guinea pigs with prediabetic IGT and type 2 diabetes (T2DM). Normal glucose tolerance in nondiabetic (non-DM) guinea pigs before initiating an HFHC diet by OGTT (A) and corresponding area under the curve (AUC) (B). Glucose tolerance was impaired in guinea pigs fed the HFHC diet alone, with reduced glucose disposal at 60 minutes of OGTT (C) and an overall increase in AUC (D) compared with the same guinea pigs before initiating the diet. A diabetic level of IGT in T2DM guinea pigs 11 weeks after combined HFHC/STZ diabetogenic treatment (E) with a marked increase in AUC (F). Data are given as means ± SD. P ≤ 0.05, ∗∗P ≤ 0.01, ∗∗∗P ≤ 0.001, and ∗∗∗∗P ≤ 0.0001 compared with non-DM levels.
Figure 2
Figure 2
Infection with M. tuberculosis further impairs glucose tolerance in nondiabetic (non-DM), HFHC-fed only, and diabetic (T2DM) guinea pigs. OGTT on day 30 of infection (A) showed amplification of IGT in non-DM, HFHC-fed only, and T2DM guinea pigs due to M. tuberculosis infection with an increased area under the curve (AUC) (B) compared with preinfection values. On day 60 of infection (C), glucose tolerance was comparable with preinfection levels in non-DM guinea pigs, whereas IGT and an increased AUC (D) remained in guinea pigs with preexisting IGT. Similarly, IGT persisted on day 90 of infection (E) in guinea pigs with preexisting IGT as indicated by an elevated AUC (F), whereas overall glucose tolerance was comparable with preinfection levels in non-DM controls, although blood glucose levels remained elevated in this group 2 hours after administration. Data are given as means ± SD. P ≤ 0.05, ∗∗P ≤ 0.01, and ∗∗∗P ≤ 0.001 compared with non-DM preinfection levels; P ≤ 0.05, ††P ≤ 0.01 compared to non-DM, infected levels.
Figure 3
Figure 3
TB is more severe in guinea pigs with type 2 diabetes (T2DM). A: Markedly reduced survival in T2DM guinea pigs and intermediate, but nonsignificant, susceptibility seen in guinea pigs with IGT. B: An approximately threefold increase in lung disease severity in T2DM guinea pigs on day 30 of infection was measured by lesion burden, whereas no significant differences were present between glucose-intolerant and nondiabetic (non-DM) controls. C: Spleen lesion burden was markedly increased in T2DM guinea pigs on day 30 of infection, whereas no significant differences were present between glucose-intolerant and non-DM controls. Compared with normal granuloma morphology in the lung of non-DM guinea pigs (D), there is much higher granulocyte infiltration (arrows) and disruption of granuloma architecture in T2DM guinea pigs (E). Compared with typical large and discrete granulomas (arrow) in the spleen of non-DM guinea pigs (F), T2DM guinea pigs have a widespread miliary pattern of lesion dissemination in the spleen consisting of small and coalescing granulomas (arrows) (G). Data are given as means ± SD (A–C). P ≤ 0.05, ∗∗P ≤ 0.01 compared with non-DM levels. Scale bars: 100 μm (DG). H&E (DG). N, necrosis.
Figure 4
Figure 4
Guinea pigs with diabetes (T2DM) have a higher bacterial burden. A: T2DM guinea pigs on day 30 of infection had a much higher bacterial burden in pulmonary and extrapulmonary organs. B: There was higher frequency of M. tuberculosis growth from tracheal wash fluid of T2DM guinea pigs, exceeding positive samples from guinea pigs with IGT compared with no growth in nondiabetic (non-DM) controls. There were no significant differences in tissue bacterial burden on day 60 of infection between glucose-intolerant and non-DM guinea pigs (C) and similar tracheal wash culture results, which declined in guinea pigs with IGT (D). E: By day 90 of infection, extrapulmonary burden declined in non-DM guinea pigs, whereas it was persistently elevated in guinea pigs with IGT. F: All tracheal wash cultures from non-DM and glucose-intolerant guinea pigs were negative on day 90 of infection. Data are given as means ± SD (A, C, and E). P ≤ 0.05, ∗∗P ≤ 0.01, and ∗∗∗P ≤ 0.001 compared with non-DM levels. CFU, colony-forming unit.
Figure 5
Figure 5
Guinea pigs with type 2 diabetes (T2DM) respond to M. tuberculosis infection with a more robust type 1 cytokine response. Relative gene expression of cytokines promoting a Th1-biased T-cell response was measured by quantitative RT-PCR. Lung IFN-γ and IL-17 expression and spleen IFN-γ expression were higher in T2DM guinea pigs infected with M. tuberculosis on day 30 of infection. Elevated IFN-γ expression was not seen in guinea pigs with IGT until day 90 of infection. No significant differences were observed in IL-12p40 or IL-23 expression at any time point evaluated. Data are given as log2 ± SEM. P ≤ 0.05, ∗∗∗P ≤ 0.001 compared with nondiabetic (non-DM) levels.
Figure 6
Figure 6
Guinea pigs with type 2 diabetes (T2DM) respond with an elevated innate chemokine/cytokine response early in M. tuberculosis infection. Relative gene expression of innate cytokines and chemokines most involved in TB pathogenesis was measured by quantitative RT-PCR. Expression of the neutrophil and macrophage chemokines IL-8 and MCP-1, respectively, as well as splenic TNF-α expression were significantly elevated in guinea pigs with T2DM on day 30 of infection. In contrast, elevated expression of IL-1β and TNF-α occurred only on day 90 of infection in guinea pigs with IGT. Data are given as log2 ± SEM. P ≤ 0.05, ∗∗P ≤ 0.01, and ∗∗∗P ≤ 0.001 compared with nondiabetic (non-DM) levels.
Figure 7
Figure 7
Increased IL-10 expression does not impair the inflammatory response in type 2 diabetic (T2DM) guinea pigs. Relative gene expression of cytokines and transcription factors that oppose the cell-mediated response during TB were measured by quantitative RT-PCR. A productive type 1 cytokine response persisted in T2DM guinea pigs despite elevated IL-10 expression on day 30 of infection with M tuberculosis. IL-4 expression, as an indicator of Th2 T-cell differentiation, or FoxP3 expression, as an indicator of regulatory T-cell differentiation, did not differ between nondiabetic (non-DM), insulin-resistant, or T2DM states at any time point evaluated. Data are given as log2 ± SEM. P ≤ 0.05 compared with non-DM levels. TGF-β, transforming growth factor-β.
Figure 8
Figure 8
Activated macrophages and granulocytes are increased in diabetic (T2DM) guinea pigs on day 30 of M tuberculosis infection. Total CD4+ or CD8+ TCR+ T cells and MHCII low- or high-expressing macrophages were quantified by flow cytometry and normalized to per gram of tissue in lung, lymph node (LN), and spleen and then expressed as percentage activated based on proportions of CD45high CD4+ and CD8+ lymphocytes and MHCIIhigh macrophages. A–C: The proportion of activated CD4 T cells decreased in nondiabetic (non-DM) and glucose-intolerant guinea pigs on day 60 of infection but was equally elevated on day 90 of infection in all organs in non-DM and glucose-intolerant guinea pigs. D–F: There were no differences in CD8 T-cell activation at any time point among non-DM, glucose-intolerant, and T2DM guinea pigs. G–I: Higher proportions of activated macrophages were present in T2DM guinea pigs in lung and LN on day 30 of infection. J–L: Granulocytes as a proportion of total leukocytes counted per gram of tissue were increased in the lung of T2DM guinea pigs. Data are given as means ± SD. P ≤ 0.05 compared with non-DM levels.

References

    1. Maurice J. WHO framework targets tuberculosis-diabetes link. Lancet. 2011;378:1209–1210. - PubMed
    1. Stevenson C.R., Critchley J.A., Forouhi N.G., Roglic G., Williams B.G., Dye C., Unwin N.C. Diabetes and the risk of tuberculosis: a neglected threat to public health? Chronic Illn. 2007;3:228–245. - PubMed
    1. Guariguata L. By the numbers: new estimates from the IDF Diabetes Atlas Update for 2012. Diabetes Res Clin Pract. 2012;98:524–525. - PubMed
    1. Whiting D.R., Guariguata L., Weil C., Shaw J. IDF diabetes atlas: global estimates of the prevalence of diabetes for 2011 and 2030. Diabetes Res Clin Pract. 2011;94:311–321. - PubMed
    1. Leung C.C., Lam T.H., Chan W.M., Yew W.W., Ho K.S., Leung G.M., Law W.S., Tam C.M., Chan C.K., Chang K.C. Diabetic control and risk of tuberculosis: a cohort study. Am J Epidemiol. 2008;167:1486–1494. - PubMed

Publication types

MeSH terms