. 2014 Jun;39(7):1786-98.
doi: 10.1038/npp.2014.26. Epub 2014 Feb 4.

Subanesthetic ketamine treatment promotes abnormal interactions between neural subsystems and alters the properties of functional brain networks

Affiliations

Subanesthetic ketamine treatment promotes abnormal interactions between neural subsystems and alters the properties of functional brain networks

Neil Dawson et al. Neuropsychopharmacology. 2014 Jun.

Abstract

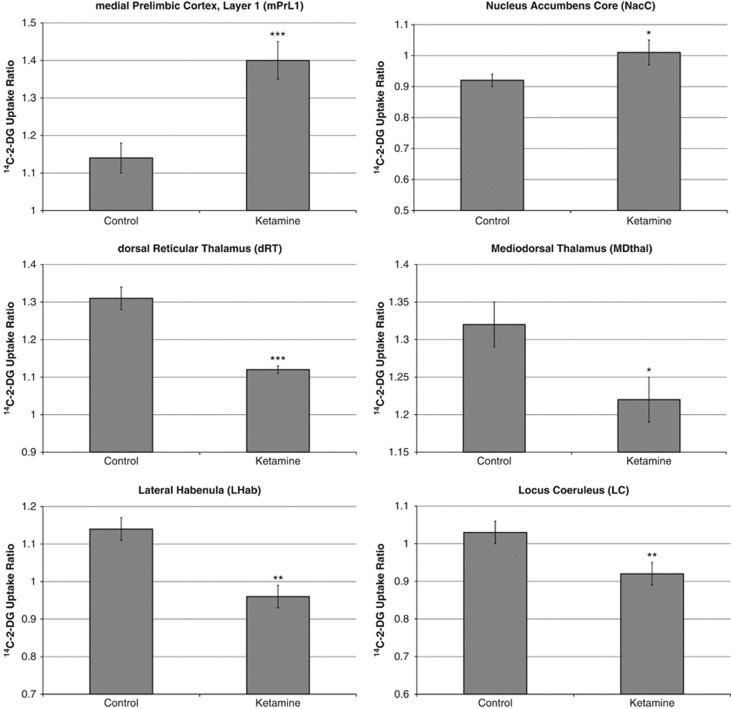
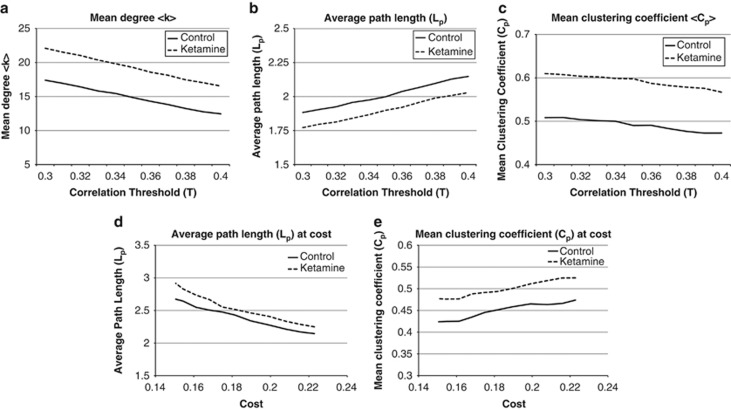
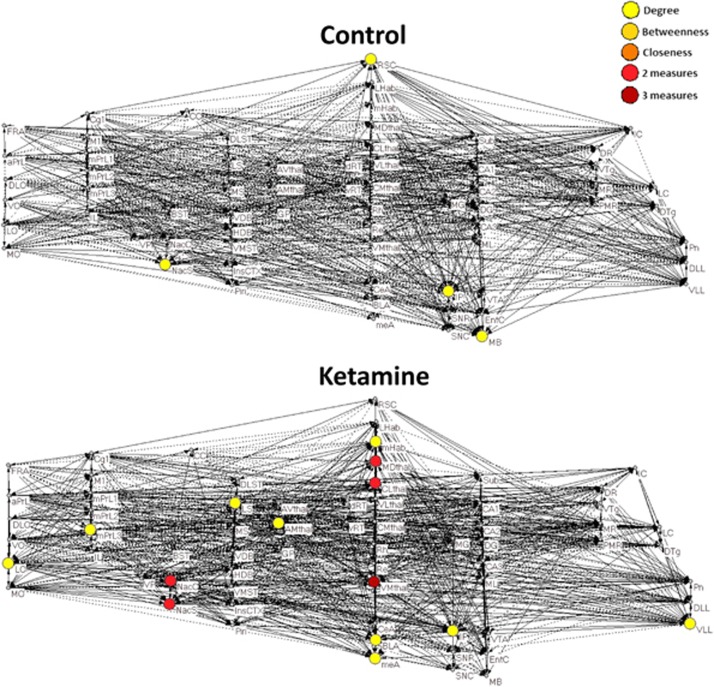
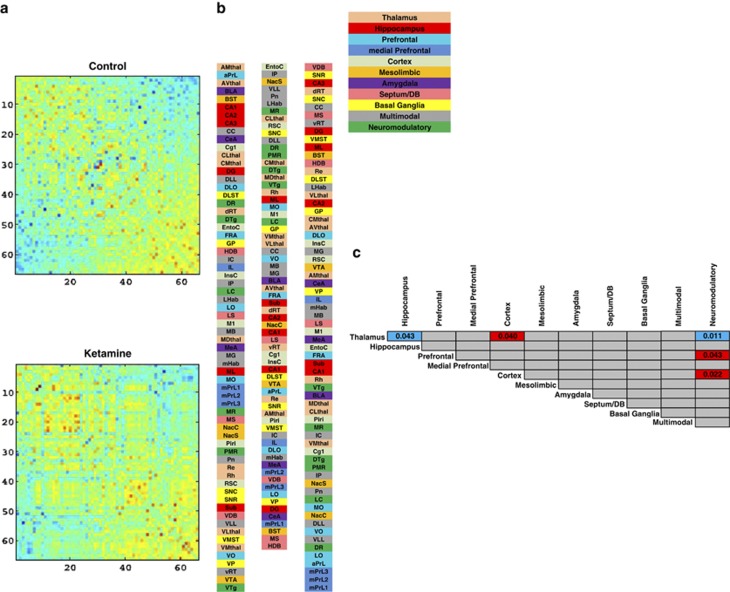
Acute treatment with subanesthetic ketamine, a non-competitive N-methyl-D-aspartic acid (NMDA) receptor antagonist, is widely utilized as a translational model for schizophrenia. However, how acute NMDA receptor blockade impacts on brain functioning at a systems level, to elicit translationally relevant symptomatology and behavioral deficits, has not yet been determined. Here, for the first time, we apply established and recently validated topological measures from network science to brain imaging data gained from ketamine-treated mice to elucidate how acute NMDA receptor blockade impacts on the properties of functional brain networks. We show that the effects of acute ketamine treatment on the global properties of these networks are divergent from those widely reported in schizophrenia. Where acute NMDA receptor blockade promotes hyperconnectivity in functional brain networks, pronounced dysconnectivity is found in schizophrenia. We also show that acute ketamine treatment increases the connectivity and importance of prefrontal and thalamic brain regions in brain networks, a finding also divergent to alterations seen in schizophrenia. In addition, we characterize how ketamine impacts on bipartite functional interactions between neural subsystems. A key feature includes the enhancement of prefrontal cortex (PFC)-neuromodulatory subsystem connectivity in ketamine-treated animals, a finding consistent with the known effects of ketamine on PFC neurotransmitter levels. Overall, our data suggest that, at a systems level, acute ketamine-induced alterations in brain network connectivity do not parallel those seen in chronic schizophrenia. Hence, the mechanisms through which acute ketamine treatment induces translationally relevant symptomatology may differ from those in chronic schizophrenia. Future effort should therefore be dedicated to resolve the conflicting observations between this putative translational model and schizophrenia.


Figures

Figure 1
Figure 1
Ketamine-induced alterations in overt local cerebral glucose utilization (LCGU). Data shown as mean±SEM. *Denotes p<0.05, **denotes p<0.01, and ***denotes p<0.001 significant difference from control (saline treated) animals (t-test). Full data for all brain regions analyzed are shown in Supplementary Table S1A–D.
Figure 2
Figure 2
Ketamine-induced alterations in global functional brain network topography. Acute ketamine treatment (30 mg/kg) resulted in functional brain networks that displayed a significantly increased (a) mean degree (p=0.0490), had a similar (b) average path length (p=0.207) but a significantly increased (c) mean clustering coefficient (p=0.0333) in comparison with networks in control (saline treated) animals. When the functional brain networks of each experimental group were compared at the same cost there was no significant difference between the two groups in terms of the (d) average path length (p=0.0987) or mean clustering coefficient (p=0.1448). The significance of ketamine-induced alterations in global network measures was analyzed by comparison with that in networks generated from 5000 (a–c) or 1000 (d, e) random permutations of the raw experimental data. Significance was set at p<0.05.
Figure 3
Figure 3
Hub brain regions in the functional brain networks of control and ketamine-treated mice. Graph representations of the 2-DG brain networks in control (saline treated) and ketamine-treated mice. Brain networks are shown at the 0.4 correlation threshold (T=0.4). Solid edges between nodes represent a positive correlation in cerebral metabolism between brain regions, whereas broken connections (edges) denote a negative correlation in cerebral metabolism between two brain regions. If regional centrality, for any centrality measure, surpassed the z>1.96 threshold, calculated in comparison with 11 000 calibrated random Erdös-Rényi graphs, across the entire correlation threshold range (T=0.3–0.4), then that region was considered to be a hub in the functional brain network. Large nodes are those that are defined as important hubs in the network. Node color denotes the centrality measure in which a brain region was considered to be an important hub in the brain network. These graphs were generated using the Pajek software (http://pajek.imfm.si/doku.php?id=download).
Figure 4
Figure 4
Ketamine-induced alterations in bipartite neural subsystem interactions. (a) Heatmaps showing the clustering of neural subsystems in control and ketamine-treated animals brain network matrices following GSVD reordering. Warm colors (red/orange) represent high/positive functional correlations between brain regions and cold colors (blue/green) represent low/negative correlations between brain regions. The Control reordered matrix identified clusters of brain regions present in the control group not present in ketamine-treated animals, and the ketamine ordered matrix shows clusters present in ketamine-treated animals not present in controls. (b) Brain region lists showing the order of brain regions in the original (alphabetical) and GSVD reordered matrices for ketamine-treated and control animals. (c) Summary diagram of significant neural subsystem bipartite interactions seen in the GSVD reordered matrices of control but not ketamine-treated animals (defined in blue) and those seen in ketamine-treated but not in control animals (defined in red). Values indicate the significance level of the given bipartite neural subsystem interaction, determined by comparison of the joint variance of each bipartite neural subsystem in the real GSVD reordered matrices as compared with that seen in 10 000 random permutations of the real data. These p-values were adjusted post hoc by Bonferroni–Holm correction for multiple (110) comparisons. Significance is set at p<0.05. Full data are shown in Supplementary Table S3A and B).

Similar articles

Cited by

References

    1. Amargos-Bosch M, Lopez-Gill X, Artigas F, Adell A. Clozapine and olanzapine, but not haloperidol, suppress serotonin efflux in the medial prefrontal cortex elicited by phencyclidine and ketamine. Int J Neuropsychopharmacol. 2006;9:565–573. - PubMed
    1. Bakshi VP, Geyer MA. Phencyclidine induced deficits in prepulse inhibition of startle are blocked by prazosin, an alpha-1 noradrenergic antagonist. J Pharmacol Exp Ther. 1997;283:666–674. - PubMed
    1. Bassett DS, Bullmore E, Verchinski BA, Mattay VS, Weinberger DR, Meyer-Lindenberg AM. Hierarchical organization of human cortical networks in health and schizophrenia. J Neurosci. 2008;28:9239–9248. - PMC - PubMed
    1. Benetti S, Mechelli A, Picchioni M, Broome M, Williams S, McGuire P. Functional integration between the posterior hippocampus and prefrontal cortex is impaired in both first episode schizophrenia and the at risk mental state. Brain. 2009;132:2426–2436. - PubMed
    1. Bifone A, Gozzi A, Schwarz AJ. Functional connectivity in the rat brain: a complex network approach. Magn Reson Imaging. 2010;28:1200–1209. - PubMed

Publication types

LinkOut - more resources