. 2014 Jun;16(2):415-30.
doi: 10.1007/s12017-014-8292-z. Epub 2014 Feb 4.

MiR-21 is an Ngf-modulated microRNA that supports Ngf signaling and regulates neuronal degeneration in PC12 cells

Affiliations

MiR-21 is an Ngf-modulated microRNA that supports Ngf signaling and regulates neuronal degeneration in PC12 cells

Enrica Montalban et al. Neuromolecular Med. 2014 Jun.

Abstract

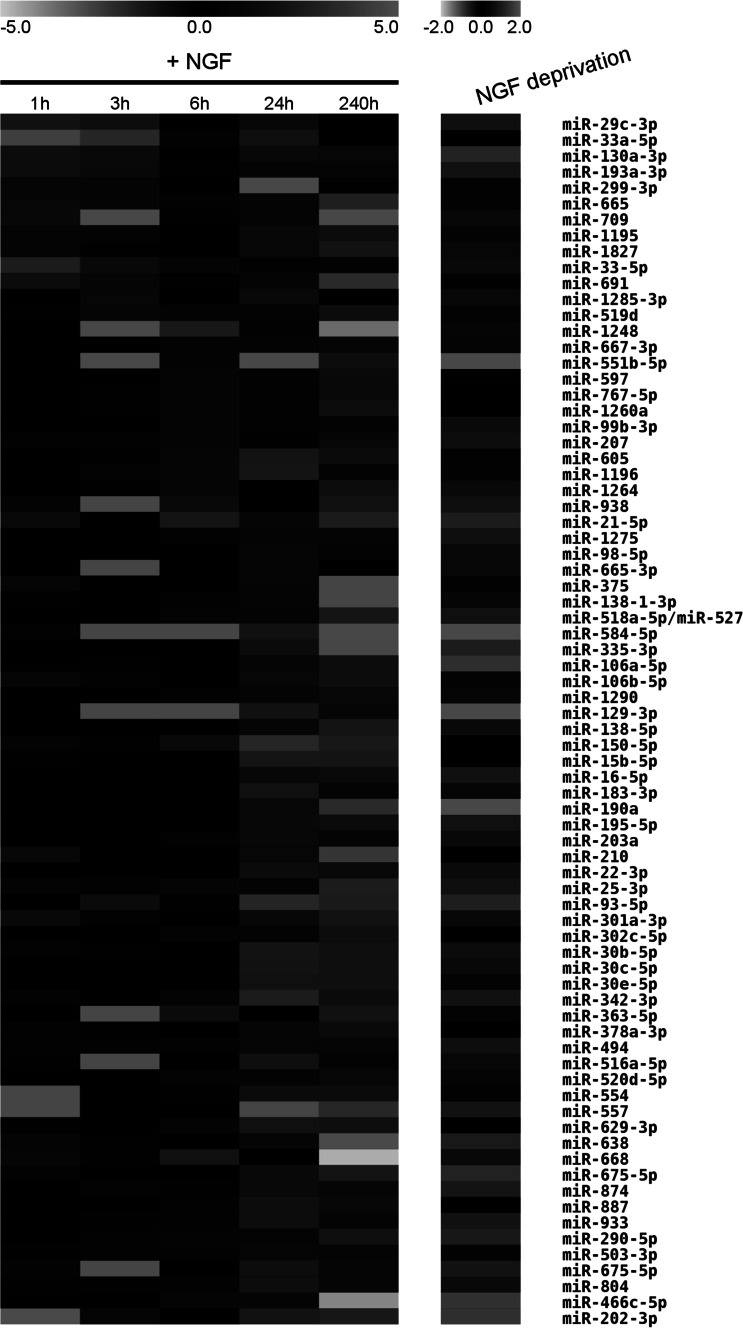
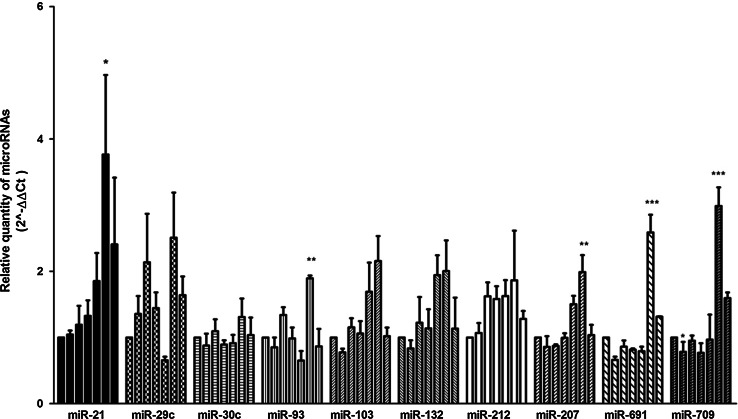
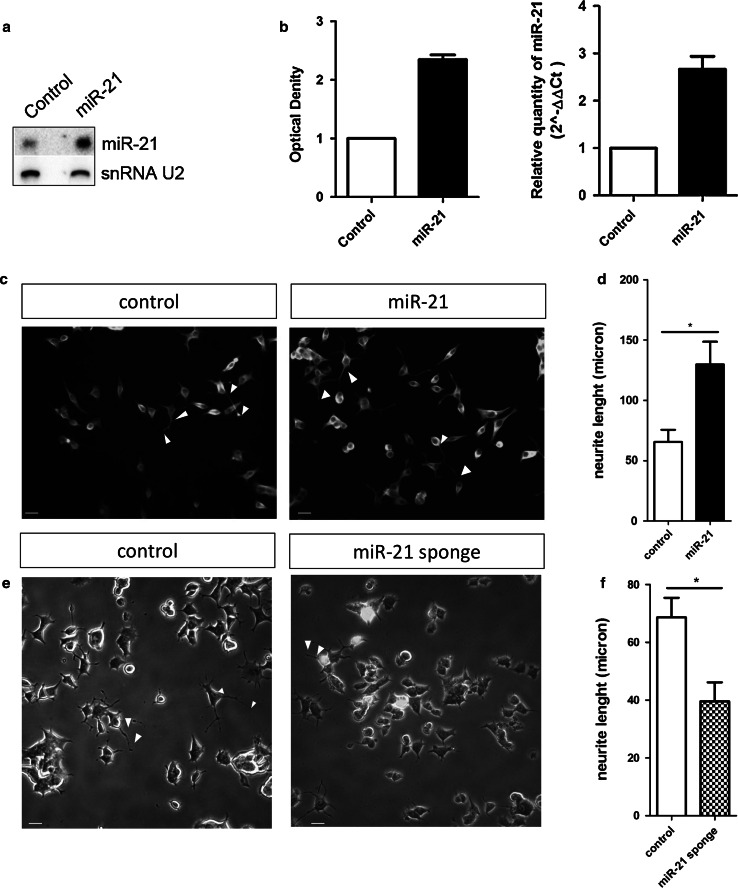
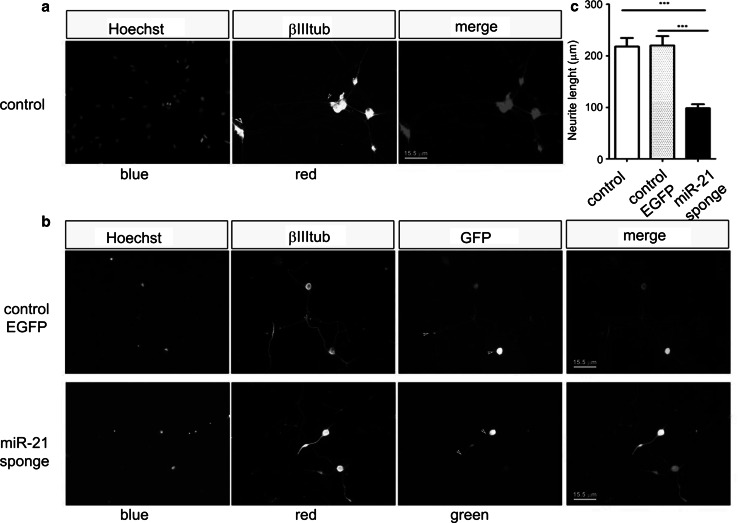
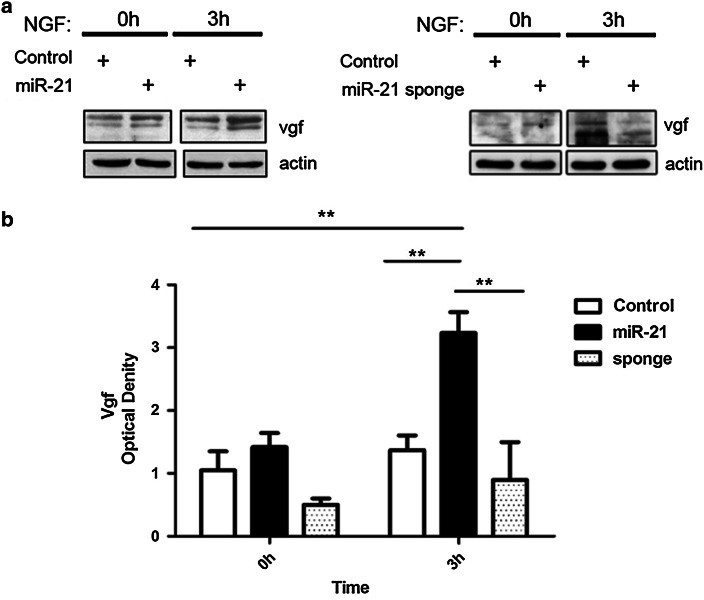
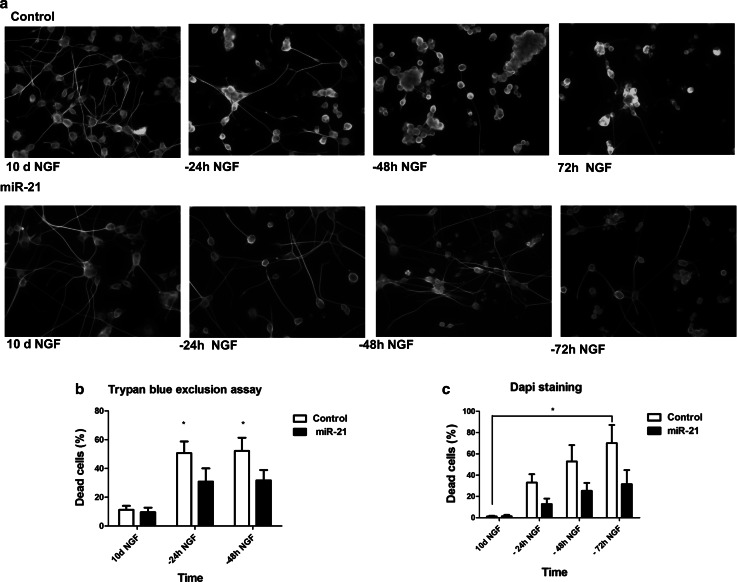
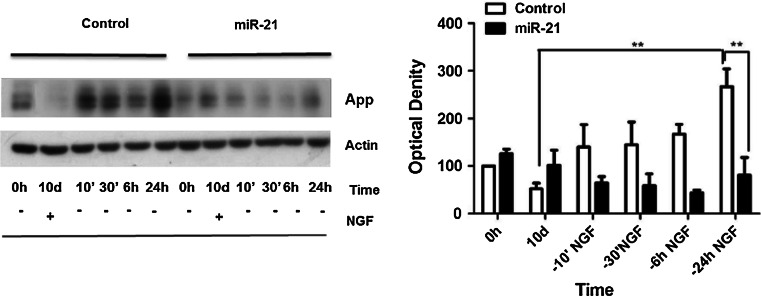
The neurotrophins Ngf, Bdnf, NT-3, NT4-5 have key roles in development, survival, and plasticity of neuronal cells. Their action involves broad gene expression changes at the level of transcription and translation. MicroRNAs (miRs)-small RNA molecules that control gene expression post-transcriptionally-are increasingly implicated in regulating development and plasticity of neural cells. Using PC12 cells as a model system, we show that Ngf modulates changes in expression of a variety of microRNAs, including miRs known to be modulated by neurotrophins-such as the miR-212/132 cluster-and several others, such as miR-21, miR-29c, miR-30c, miR-93, miR-103, miR-207, miR-691, and miR-709. Pathway analysis indicates that Ngf-modulated miRs may regulate many protein components of signaling pathways involved in neuronal development and disease. In particular, we show that miR-21 enhances neurotrophin signaling and controls neuronal differentiation induced by Ngf. Notably, in a situation mimicking neurodegeneration-differentiated neurons deprived of Ngf-this microRNA is able to preserve the neurite network and to support viability of the neurons. These findings uncover a broad role of microRNAs in regulating neurotrophin signaling and suggest that aberrant expression of one or more Ngf-modulated miRs may be involved in neurodegenerative diseases.


Figures

Fig. 1
Fig. 1
MicroRNAs modulated by Ngf in PC12 cells. Expression values of microRNAs modulated by Ngf are represented as heat map. The left image (+Ngf) shows microRNAs differentially expressed in PC12 cells at 1, 3, 6, 24 h and 10 d of Ngf treatment, relative to cells untreated with Ngf. The image on the right (Ngf deprivation) refers to microRNA expression in PC12 cells that were treated with Ngf for 10 days and then deprived of Ngf for 24 h, relative to cells treated with Ngf for 10 days but not deprived of Ngf. Only microRNAs modulated by Ngf in at least one condition are shown. Red and green indicate, respectively, increased or decreased expression relative to controls; black indicates no expression change; gray indicates that microRNA expression was undetected. Only miR expression values satisfying the threshold criteria—p value ≤0.05 in two-tailed Student’s t test; fold change ≤−1.7 or ≥1.7—are reported
Fig. 2
Fig. 2
Expression analysis of select microRNAs upon Ngf induction. a The plots show the amounts of each of the ten select miRs (21, 29c, 30c, 93, 103, 132, 212, 207, 691, 709) determined by RT-PCR in PC12 cells treated with Ngf—from left to right, respectively—for 0, 1, 3, 6, 24, 240 h; the most rightward bar of each plot represents cells treated with Ngf for 10 days and deprived of Ngf for 24 h. Expression levels are relative to cells not treated with Ngf. MiR expression values were calculated by the comparative ∆∆Ct method; U6 small nucleolar RNA (snoRNA) was used as internal control. Data represent averages of three independent experiments along with s.e.m. P values were calculated by one-way ANOVA followed by Tukey’s multiple comparison test; *p < 0.05; **p < 0.03; ***p < 0.01
Fig. 3
Fig. 3
MiR-21 promotes PC12 cell differentiation in response to Ngf. ab MiR-21 expression in PC12 cells transduced with miR-21 expressing (miR-21) or control lentivirus. a Representative Northern blotting. b Histograms showing miR-21 expression—relative to control cells set to a value of 1—measured by Northern blotting (left) and real-time PCR (right). Northern blotting data are presented as mean ± s.e.m. of two independent experiments; U2 snoRNA was used as loading control. Real-time PCR data are presented as mean ± s.e.m. of triplicate samples, from two biological replicates; U6 snoRNA was used as loading control. cd Neurite length of PC12 cells ectopically expressing, or not, miR-21 and stimulated for 2 days with Ngf. c Immunofluorescence staining of α-tubulin. Scale bar 30 μm. d Histogram showing the average length of axons, expressed in μm. Data are represented as means ± s.e.m. of triplicate determinations of ten random fields in three independent experiments. *P value ≤0.05, according to Student’s t test. ef Neurite length of PC12 cells transfected with a miR-21 sponge plasmid—harboring a destabilized EGFP with several miR-21 binding sites in the 3′ untranslated region –, stimulated for 2 days with Ngf, and fixed with 4 % PFA. e Photomicrographs. The green color represents EGFP; scale bar 30 μm. f The histogram shows neurite mean length, express in μm; data are represented as means ± s.e.m. of triplicate determinations of ten random fields in three independent experiments. *P value ≤0.05, according to Student’s t test
Fig. 4
Fig. 4
miR-21 inhibition affect neurite outgrowth in DRG cells. a, b Immunofluorescence staining. a Control, untransfected DRG cells, b DRG cells transfected with an EGFP encoding plasmid (control EGFP) and with the plasmid encoding the miR-21 sponge. Blue Hoechst staining; red ß-III-tubulin; green GFP. Scale bar 15.5 μm. c The histogram shows the mean length of neurites express in μm. Data are represented as means ± s.e.m. of triplicate determinations of ten random fields in four independent experiments. A total of 169 cells were counted for the not transfected control, a total of 133 cells were counted for EGFP control, and a total of 170 cells were counted for the miR-21 sponge. P values were calculated by one-way ANOVA followed by Tukey’s multiple comparison test; ***P value ≤0.01
Fig. 5
Fig. 5
Vgf induction in PC12 cells is affected by miR-21 expression. a Vgf immunoblotting in control PC12 cells and cells ectopically expressing miR-21 (left) or a miR-21 sponge (right), treated with Ngf for 0 and 3 h. b Densitometric analyses of the immunoblots—normalized to the actin loading control—of three independent experiments. Data are presented as mean ± s.e.m. P values were calculated by one-way ANOVA followed by Tukey’s multiple comparison test; **p value ≤0.01
Fig. 6
Fig. 6
MiR-21 prevents degeneration of differentiated PC12 cells upon deprivation of Ngf. a Immunofluorescence staining of α-tubulin in PC12 cells, differentiated for 10 days with Ngf (10 d Ngf) and then deprived of Ngf for 24, 48, and 72 h. b Trypan blue exclusion assay. The histogram indicates percentages of dead cells, at 24 and 48 h after deprivation of Ngf. Data are represented as means ± s.e.m. of four independent experiments. c Cell viability was evaluated by DAPI staining and counting of intact nuclei. Data are represented as means ± s.e.m. of triplicate determinations of ten random fields in three independent experiments. P values were calculated by one-way ANOVA followed by Tukey’s multiple comparison test. *P value ≤0.05
Fig. 7
Fig. 7
App expression is affected by mir-21 expression. Left panel representative immunoblotting of App in PC12 cells ectopically expressing or not miR-21, treated for 10 days with Ngf and then deprived of Ngf from 10 min to 24 h. Right panel the histogram depicts densitometric analyses of immunoblots, normalized to the actin loading control. Data are represented as means ± s.e.m. of three independent experiments. P values were calculated by one-way ANOVA followed by Tukey’s multiple comparison test; **p value ≤0.01 by Tukey’s multiple comparison test

References

    1. Adilakshmi T, Sudol I, Tapinos N. Combinatorial action of miRNAs regulates transcriptional and post-transcriptional gene silencing following in vivo PNS injury. PLoS ONE. 2012;7(7):e39674. doi: 10.1371/journal.pone.0039674. - DOI - PMC - PubMed
    1. Alsina FC, Irala D, Fontanet PA, Hita FJ, Ledda F, Paratcha G. Sprouty4 is an endogenous negative modulator of TrkA signaling and neuronal differentiation induced by Ngf. PLoS ONE. 2012;7(2):e32087. doi: 10.1371/journal.pone.0032087. - DOI - PMC - PubMed
    1. Annibali D, Gioia U, Savino M, Laneve P, Caffarelli E, Nasi S. A new module in neural differentiation control: Two microRNA upregulated by Retinoic Acid, miR-9 and-103, target the differentiation inhibitor ID2. PLoS ONE. 2012;7(7):e40269. doi: 10.1371/journal.pone.0040269. - DOI - PMC - PubMed
    1. Annibali, D., & Nasi, S. (2007). Signaling by neurotrophins. In Reactome. http://www.reactome.org.
    1. Babenko O, Golubov A, Ilnytskyy Y, Kovalchuk I, Metz GA. Genomic and epigenomic responses to chronic stress involve miRNA-mediated programming. PLoS ONE. 2012;7(1):e29441. doi: 10.1371/journal.pone.0029441. - DOI - PMC - PubMed

Publication types

MeSH terms