. 2014 Jun 1;30(11):1539-46.
doi: 10.1093/bioinformatics/btu072. Epub 2014 Feb 3.

SegAnnDB: interactive Web-based genomic segmentation

Affiliations

SegAnnDB: interactive Web-based genomic segmentation

Toby D Hocking et al. Bioinformatics. .

Abstract

Motivation: DNA copy number profiles characterize regions of chromosome gains, losses and breakpoints in tumor genomes. Although many models have been proposed to detect these alterations, it is not clear which model is appropriate before visual inspection the signal, noise and models for a particular profile.

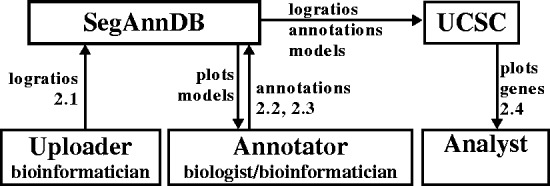
Results: We propose SegAnnDB, a Web-based computer vision system for genomic segmentation: first, visually inspect the profiles and manually annotate altered regions, then SegAnnDB determines the precise alteration locations using a mathematical model of the data and annotations. SegAnnDB facilitates collaboration between biologists and bioinformaticians, and uses the University of California, Santa Cruz genome browser to visualize copy number alterations alongside known genes.

Availability and implementation: The breakpoints project on INRIA GForge hosts the source code, an Amazon Machine Image can be launched and a demonstration Web site is http://bioviz.rocq.inria.fr.


Figures

Fig. 1.
Fig. 1.
General workflow in annotation-guided DNA copy number analysis on SegAnnDB. Scatterplots of black points show log ratio as a function of genomic position. Breakpoints in the current segmentation are shown with vertical dashed lines, and predicted copy number status of each horizontal line segment is indicated by its color (Supplementary Table S2). Annotated regions can be added to update the copy number (top) and breakpoints (bottom) in the displayed model. Dragging on an unannotated region creates a new region with Save and Delete buttons, as shown for the normal region in the center. Before saving, the annotation can be changed by clicking the region. After saving, the displayed model is immediately updated to agree with the annotation
Fig. 2.
Fig. 2.
SegAnnDB exports data to the UCSC genome browser and facilitates collaboration between bioinformaticians and biologists. First, profile probe log ratio values are uploaded to a SegAnnDB server by an uploader (Section 2.1). Then an annotator can plot the data and refine a segmentation model by adding annotations (Sections 2.2 and 2.3). Finally, an analyst can send data to the UCSC genome browser, which displays plots of the segmentation model with known genes (Section 2.4)
Fig. 3.
Fig. 3.
The data, annotated regions and labeled segments are exported for visualization alongside RefSeq genes on the UCSC genome browser. From top to bottom, the probe log ratios are shown in black, the annotated regions are shown using their colors on SegAnnDB, the log ratio of the segmentation model is shown using a white formula image 
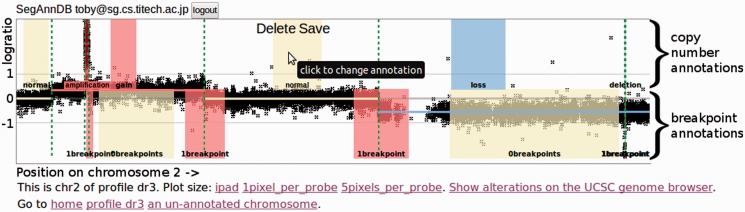
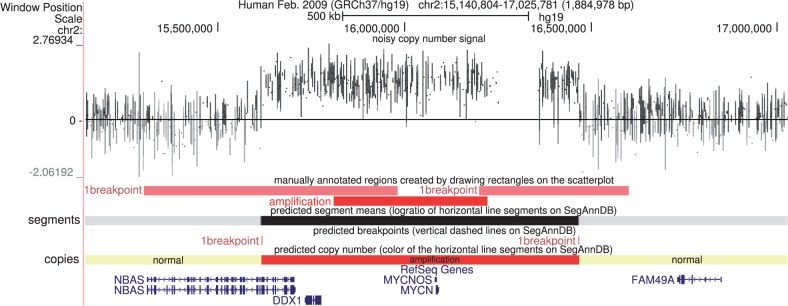
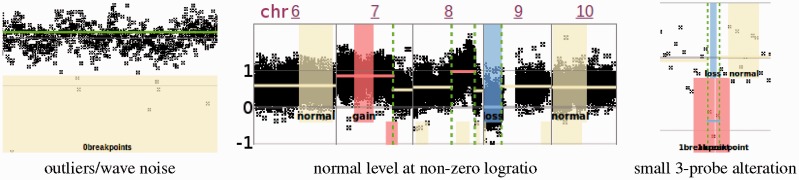
black scale, the breakpoints in the segmentation model are red and the inferred copy number status of each segment is shown using the copy number annotation colors of
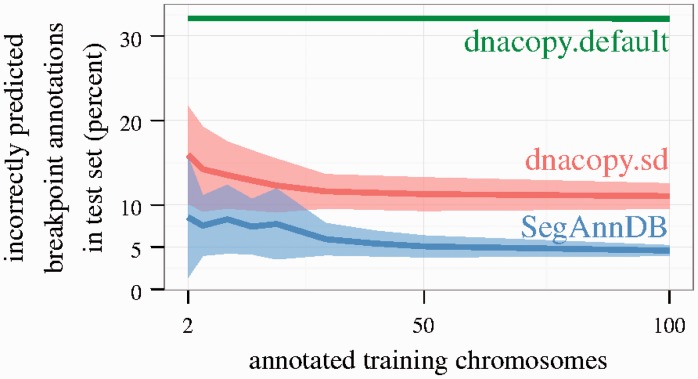
 Supplementary Table S2. In this example, it is clear that the MYCN oncogene is amplified in this neuroblastoma tumor sample
Fig. 4.
Fig. 4.
Cross-validation was used to estimate breakpoint detection error in the neuroblastoma.U830.bac dataset. It is clear that the supervised methods (dnacopy.sd, SegAnnDB) adapt to the training set, and provide better breakpoint detection on test data. Note that dnacopy.sd sometimes had lower test error than SegAnnDB in the other datasets we examined (Supplementary Fig. S5)
Fig. 5.
Fig. 5.
Examples of noise and alterations that can be annotated using SegAnnDB. Left: outliers and wave noise can be ignored using 0breakpoints annotations. Center: normal copy number at a non-zero log ratio value can be indicated using normal annotations. Right: small alterations can be annotated using 1breakpoints and copy number annotations

References

    1. Altshuler DM, et al. A map of human genome variation from population scale sequencing. Nature. 2010;467:1061–1073. - PMC - PubMed
    1. Boeva V, et al. Control-FREEC: a tool for assessing copy number and allelic content using next-generation sequencing data. Bioinformatics. 2012;28:423–425. - PMC - PubMed
    1. Bostock M, et al. D3 data-driven documents. IEEE Trans. Vis. Comput. Graph. 2011;17:2301–2309. - PubMed
    1. Conde L, et al. ISACGH: a web-based environment for the analysis of Array CGH and gene expression which includes functional profiling. Nucleic Acids Res. 2007;35(Suppl. 2):W81–W85. - PMC - PubMed
    1. Flicek P, et al. Ensembl 2012. Nucleic Acids Res. 2012;40:D84–D90. - PMC - PubMed

Publication types