Clinical Trial
. 2014 Jul;60(1):211-23.
doi: 10.1002/hep.27045. Epub 2014 May 27.

Gene expression signature for biliary atresia and a role for interleukin-8 in pathogenesis of experimental disease

Affiliations
Clinical Trial

Gene expression signature for biliary atresia and a role for interleukin-8 in pathogenesis of experimental disease

Kazuhiko Bessho et al. Hepatology. 2014 Jul.

Abstract

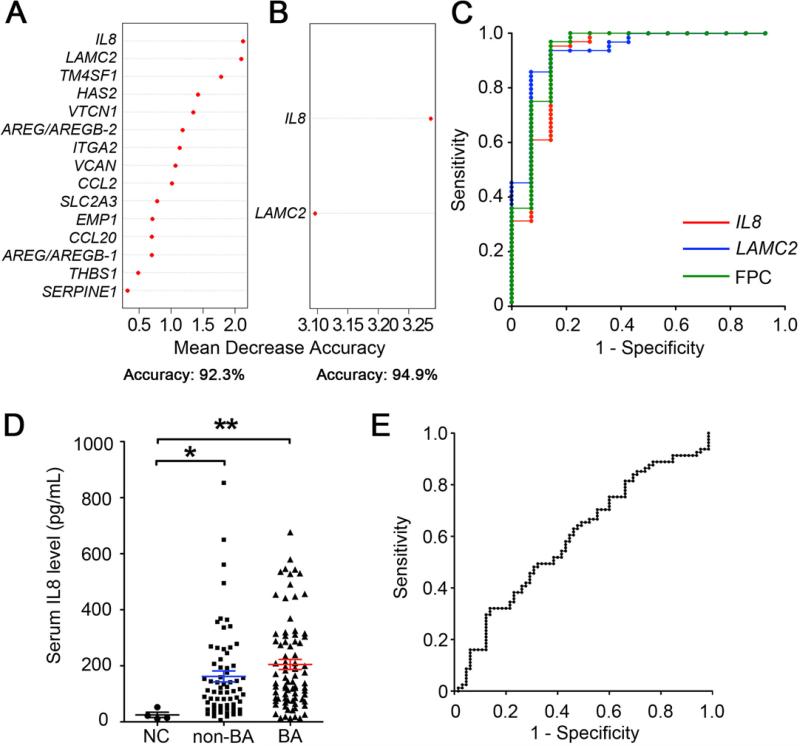
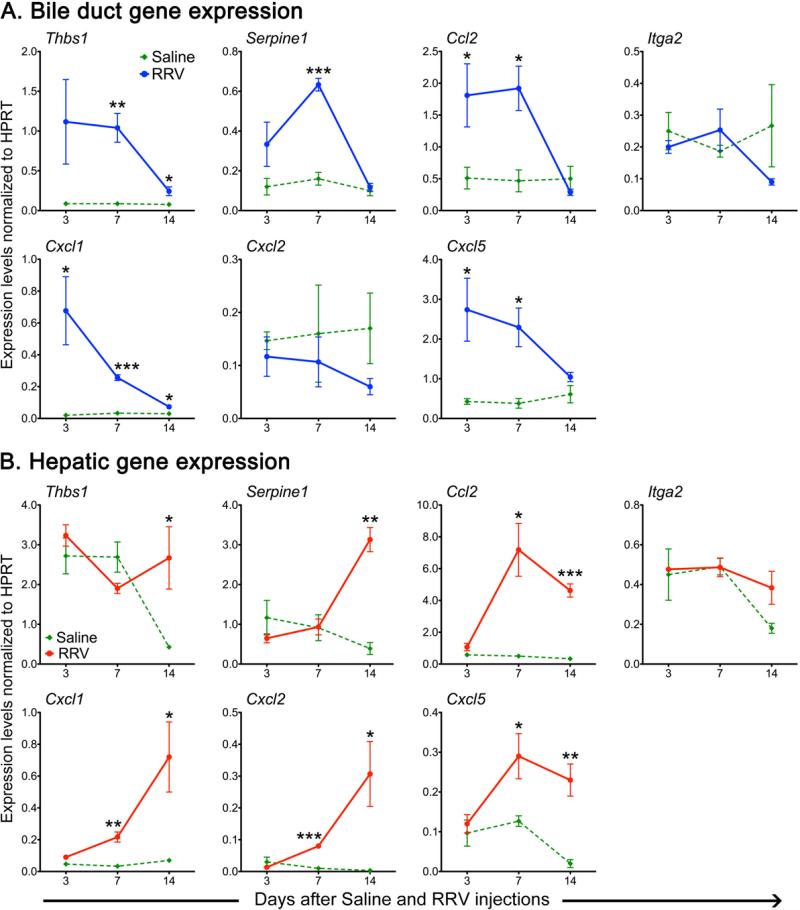
Biliary atresia (BA) is a progressive fibroinflammatory obstruction of extrahepatic bile ducts that presents as neonatal cholestasis. Due to the overlap in clinical, biochemical, and histological features with other causes of cholestasis, the diagnosis requires an intraoperative cholangiogram. Thus, we determined whether diseased livers express a gene expression signature unique to BA. Applying stringent statistical analysis to a genome-wide liver expression platform of 64 infants with BA at the time of diagnosis, 14 age-appropriate subjects with intrahepatic cholestasis as diseased controls and seven normal controls, we identified 15 genes uniquely expressed in BA with an accuracy of 92.3%. Among these genes, IL8 and LAMC2 were sufficient to classify subjects with BA distinctly from diseased controls with an area under the curve of 0.934 (95% confidence interval [CI]: 0.84-1.03), sensitivity of 96.9%, and specificity of 85.7% using their combined first principal component. Direct measurement of interleukin (IL)8 protein in the serum, however, was not different between the two groups. To investigate whether the liver-restricted increase in IL8 was relevant to disease pathogenesis, we inactivated the signaling of IL8 homologs by genetic targeting of the Cxcr2 receptor in a murine model of experimental BA. Disruption of Cxcr2 shortened the duration of cholestasis, decreased the incidence of bile duct obstruction, and improved survival above wild-type neonatal mice.

Conclusion: The hepatic expression of IL8 and LAMC2 has high sensitivity for BA at diagnosis and may serve as a biomarker of disease, with an important role for the IL8 signaling in experimental BA.

Trial registration: ClinicalTrials.gov NCT00061828.


Figures

Figure 1
Figure 1. Molecular signature of biliary atresia
(A) Venn diagram showing the initial selection of 24 probe sets based on the shared overexpression in biliary atresia (BA) over both normal control (NC) and non-biliary atresia (non-BA) as diseased controls. From these probe sets, 9 were excluded based on their increased expression in comparative analysis between the two control groups (NC and non-BA). (B) Hierarchical clustering of the 24 probe sets. Each column represents signal intensities in each subject, and the expression level is depicted by color variation from red (high expression) to blue (low expression); yellow indicates expression level of the median of 7 normal controls.
Figure 2
Figure 2. Levels of discriminatory power of hepatic genes and serum IL8 to differentiate biliary atresia from diseased controls
Random forest analysis with expression levels of all 15 probe sets (panel A) shows the relative impact of individual genes on the accuracy when differentiating biliary atresia from diseased controls. In panel B, the accuracy improves for IL8 and LAMC2 as a subgroup. In panel C, subjecting IL8 and LAMC2 as individual values or combined as a first principal component (FPC) to ROC curves identifies livers of subjects with biliary atresia at the specified values. Considering IL8 and LAMC2 combined as FPC (green line in [C]), the area under curve is 0.934, sensitivity is 96.9%, and specificity is 85.7%. In panel D, scatter plots show the serum concentration of IL8 for infants at the time of diagnosis of biliary atresia (BA; N=81) compared to non-biliary atresia (non-BA; N=66) and normal control (NC; N=5). The average concentrations for BA and non-BA are not different. Values are expressed as mean ± SEM; *P<0.05, **P<0.01. In panel E, ROC curves of serum IL8 to differentiate samples from biliary atresia and diseased controls has sensitivity of 63.0% and specificity of 53.0%, with the ideal cutoff value as 117.8 pg/mL.
Figure 3
Figure 3. Functional analyses of the 15 genes highly enriched for biliary atresia
(A) Functional enrichment analysis of the 15 genes depicted as a 2-way condition tree for individual genes and biological processes (from Gene Ontology), classified into 4 functional categories. The red area in the heatmap indicates the closely related biological processes that are shared by the subgroup of genes shown in the horizontal axis. (B) Protein-protein interaction network of the 15 genes and their accessory proteins, with red nodes indicating original seed proteins and green nodes indicating accessory proteins that are known to directly bind to one of the original 15 proteins. The size of the nodes is proportional to the number of edges connected to the node. A detailed description of (A) and (B) is included in Supplementary Figures 4 and 5, and Supplementary Tables 3 and 4.
Figure 4
Figure 4. Expression levels of murine orthologs of functionally enriched genes in experimental biliary atresia
mRNA expression for Thbs1, Serpine1, Ccl2, Itga2 and 3 murine orthologues of IL8 (Cxcl1, Cxcl2, Cxcl5; B) in extrahepatic bile ducts (A) and liver (B) at 3, 7 and 14 days after injection of RRV or saline in the first day of life. N=4 samples per group and per time point; *P<0.05, **P<0.01, ***P<0.001 between the 2 groups at each time point. mRNA expression is normalized to internal Hprt control; values are expressed as mean ± SEM.
Figure 5
Figure 5. Overexpression of Cxcr2 in wild type mice after RRV infection and suppression of hepatobiliary injury in Cxcr2−/− mice
(A) Expression levels of Cxcr1 and Cxcr2 in extrahepatic bile ducts from wild type mice at different time points after normal saline or RRV injection. N=4 samples per group; **P<0.01, ***P<0.001 between the 2 groups at each time point. Development of symptoms (B), and survival (C) of wild type (WT) and Cxcr2−/− neonatal mice after RRV injection. N=21 and 56 samples for (B) and 21 and 40 samples for (C) in each group, respectively. H&E staining of longitudinal sections of murine extrahepatic bile ducts (D) and livers (E) at different time points after RRV challenge. Asterisk: bile duct lumen; PV: portal vein; arrow: infiltration of immune cells; arrowhead: necrotic area in the parenchyma. Scale bars: 50 μm (D) and 100 μm (E).
Figure 6
Figure 6. Population of neonatal livers by inflammatory cells after RRV challenge
Flow cytometry-based quantification of hepatic plasmacytoid dendritic cells (CD11c+B220+PDCA1+), myeloid dendritic cells (CD11c+CD11b+), natural killer cells (CD49b+), neutrophils (CD11b+Gr1+), macrophages (CD11b+F4/80+), CD4+ (CD3+CD4+) and CD8+ T cells (CD3+CD8+) at 3 (A), 7 (B) and 14 (C) days after RRV challenge. Values are expressed as total number of cells per liver. (D) shows the percentage of NK cells expressing the NKg2d receptor and (E) of mDC expressing its ligand Rae-1 at 14 days after RRV challenge. Data are shown as an average of 4 different experiments. *P<0.05, **P<0.01; values are expressed as mean ± SEM.
Figure 7
Figure 7. Hepatic expression of cytokines, chemokines and their receptors in wild-type and Cxcr2−/− mice
Graphs display mRNA expression for genes encoding individual cytokines in extrahepatic bile ducts (A) and livers (B) of WT and Cxcr2−/− mice at 3, 7 and 14 days after RRV infection. N = 4-8 livers per group and time point. *P <0.05; **P<0.01, ***P<0.001 between the 2 groups at each time point. mRNA expression is normalized to internal Hprt control; Values are expressed as mean ± SEM.

Comment in

References

    1. Moyer V, Freese DK, Whitington PF, Olson AD, Brewer F, Colletti RB, Heyman MB. Guideline for the evaluation of cholestatic jaundice in infants: recommendations of the North American Society for Pediatric Gastroenterology, Hepatology and Nutrition. J Pediatr Gastroenterol Nutr. 2004;39:115–128. - PubMed
    1. Bezerra JA, Tiao G, Ryckman FC, Alonso M, Sabla GE, Shneider B, Sokol RJ, et al. Genetic induction of proinflammatory immunity in children with biliary atresia. Lancet. 2002;360:1653–1659. - PubMed
    1. Mack CL, Falta MT, Sullivan AK, Karrer F, Sokol RJ, Freed BM, Fontenot AP. Oligoclonal expansions of CD4+ and CD8+ T-cells in the target organ of patients with biliary atresia. Gastroenterology. 2007;133:278–287. - PMC - PubMed
    1. Ohya T, Fujimoto T, Shimomura H, Miyano T. Degeneration of intrahepatic bile duct with lymphocyte infiltration into biliary epithelial cells in biliary atresia. J Pediatr Surg. 1995;30:515–518. - PubMed
    1. Moyer K, Kaimal V, Pacheco C, Mourya R, Xu H, Shivakumar P, Chakraborty R, et al. Staging of biliary atresia at diagnosis by molecular profiling of the liver. Genome Med. 2010;2:33. - PMC - PubMed

Publication types

MeSH terms

Associated data