. 2014 Apr;42(7):4435-49.
doi: 10.1093/nar/gku088. Epub 2014 Feb 3.

PARP1-TDP1 coupling for the repair of topoisomerase I-induced DNA damage

Affiliations

PARP1-TDP1 coupling for the repair of topoisomerase I-induced DNA damage

Benu Brata Das et al. Nucleic Acids Res. 2014 Apr.

Abstract

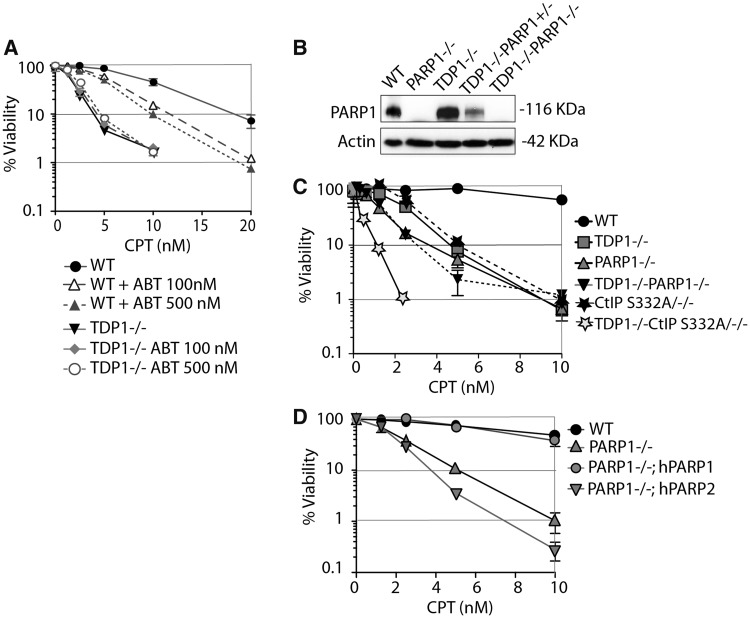
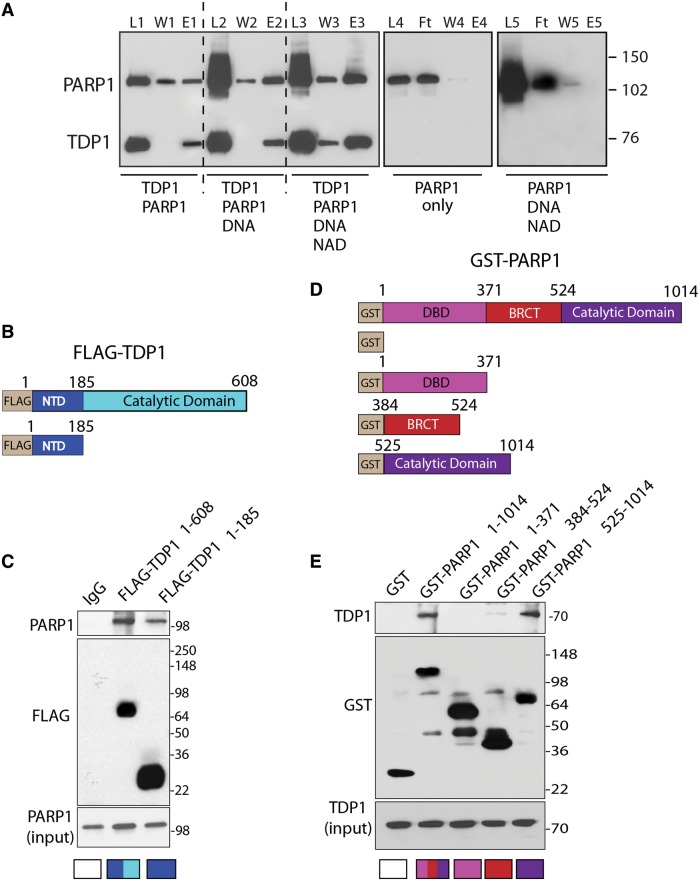
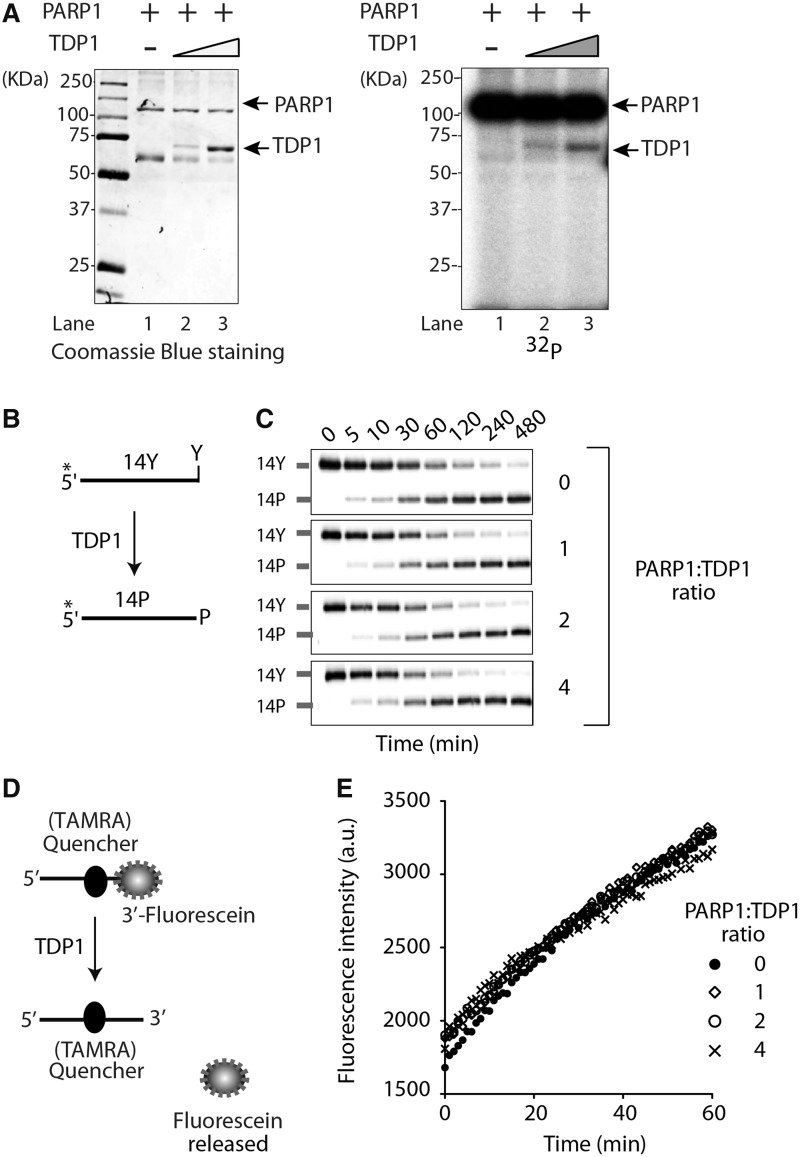
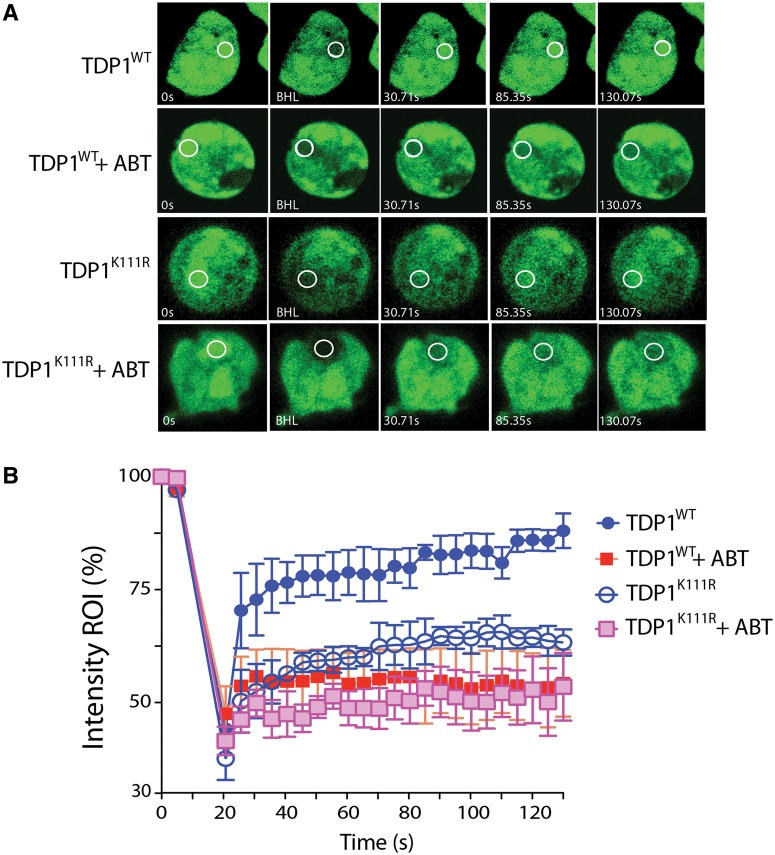
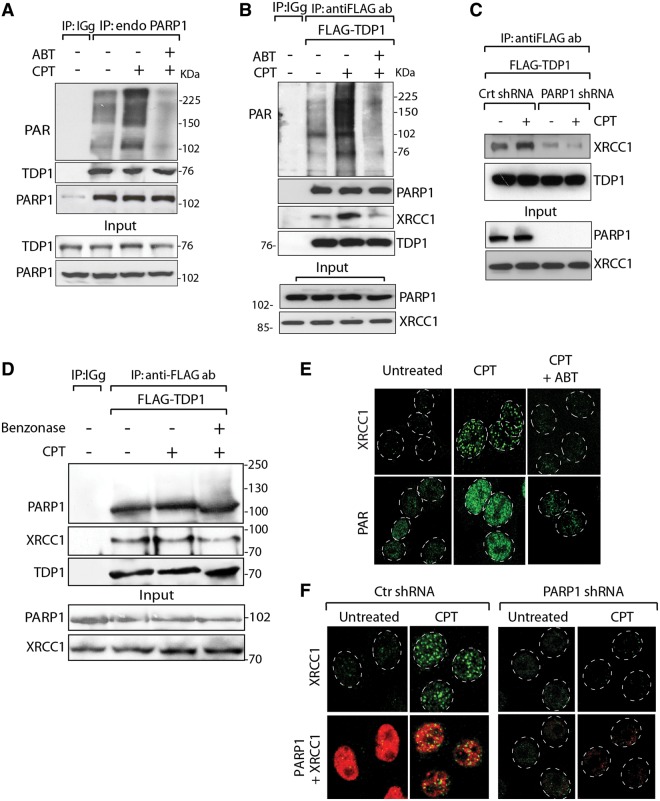
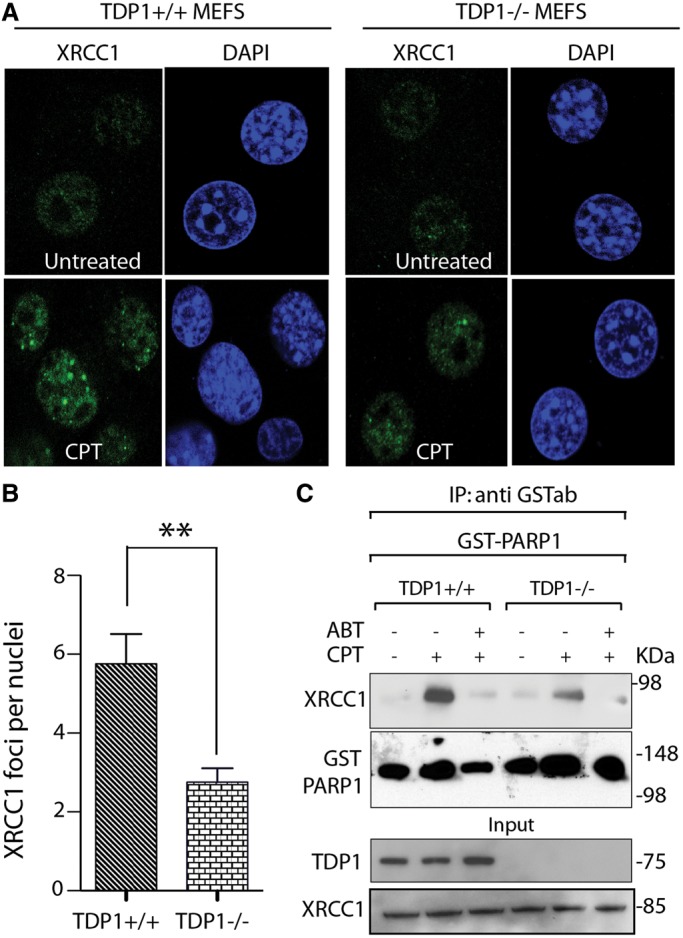
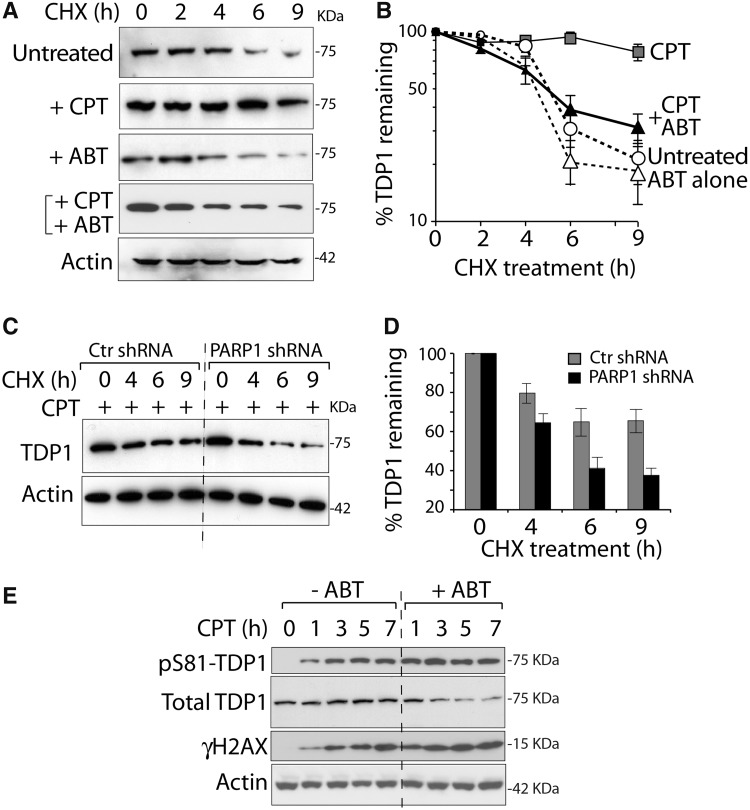
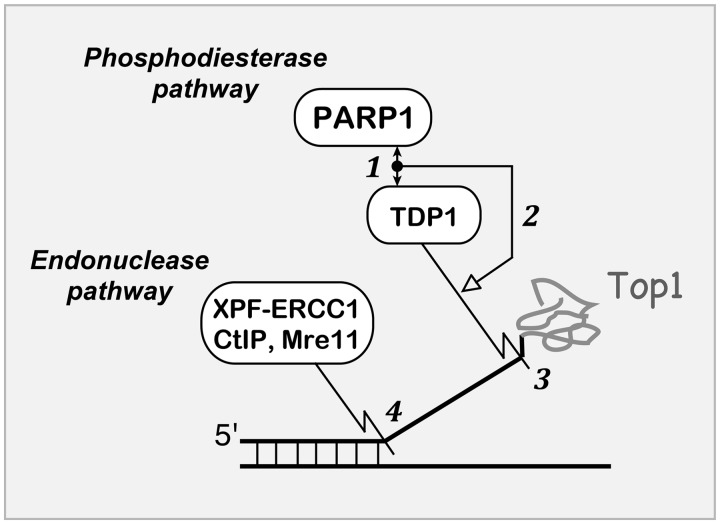
Poly(ADP-ribose) polymerases (PARP) attach poly(ADP-ribose) (PAR) chains to various proteins including themselves and chromatin. Topoisomerase I (Top1) regulates DNA supercoiling and is the target of camptothecin and indenoisoquinoline anticancer drugs, as it forms Top1 cleavage complexes (Top1cc) that are trapped by the drugs. Endogenous and carcinogenic DNA lesions can also trap Top1cc. Tyrosyl-DNA phosphodiesterase 1 (TDP1), a key repair enzyme for trapped Top1cc, hydrolyzes the phosphodiester bond between the DNA 3'-end and the Top1 tyrosyl moiety. Alternative repair pathways for Top1cc involve endonuclease cleavage. However, it is unknown what determines the choice between TDP1 and the endonuclease repair pathways. Here we show that PARP1 plays a critical role in this process. By generating TDP1 and PARP1 double-knockout lymphoma chicken DT40 cells, we demonstrate that TDP1 and PARP1 are epistatic for the repair of Top1cc. The N-terminal domain of TDP1 directly binds the C-terminal domain of PARP1, and TDP1 is PARylated by PARP1. PARylation stabilizes TDP1 together with SUMOylation of TDP1. TDP1 PARylation enhances its recruitment to DNA damage sites without interfering with TDP1 catalytic activity. TDP1-PARP1 complexes, in turn recruit X-ray repair cross-complementing protein 1 (XRCC1). This work identifies PARP1 as a key component driving the repair of trapped Top1cc by TDP1.


Figures

Figure 1.
Figure 1.
PARP1 and TDP1 are epistatic for the repair of Top1cc. (A) Survival of wild-type or TDP1−/− DT40 cells treated with CPT continuously for 72 h in the absence or presence of ABT-888. Cell viability was determined by ATPlite® assays. Error bars represent standard deviation (n ≥ 3). (B) Western blotting of the indicated whole-cell lysates. Blots were probed with anti-PARP1 and anti-actin antibodies. (C) Survival curves of DT40 cells of the indicated genotypes treated with CPT. (D) Survival curves of PARP1−/− DT40 cells stably complemented with human PARP1 (PARP1−/−; hPARP1) or human PARP2 (PARP1−/−; hPARP2) (46,47) cells treated with CPT. Cell viability was determined by ATPlite® assays. Error bars represent SD (n ≥ 3); where not visible, error bars are smaller than the symbols.
Figure 2.
Figure 2.
Direct interaction between the N-terminus of TDP1 and the C-terminus of PARP1. (A) His6-tagged hTDP1 pulls down recombinant human PARP1 (hPARP1). L1, L2 and L3: Loaded samples following 1-h incubation at 4°C (reaction conditions are indicated at the bottom). W1, W2 and W3: excess unbound proteins after washing the Ni2+-NTA-agarose beads with 50 mM imidazole. E1, E2 and E3: bound proteins eluted with 300 mM imidazole. Right panel: control reactions showing that hPARP1 alone (L4) or in the presence of DNA plus NAD+ (L5) does not bind the Ni2+-NTA-agarose beads and is recovered in the flow through (Ft). W4, W5 and E4, E5 are washed and eluted fractions with 50 and 300 mM imidazole, respectively. PARP1 and TDP1 were detected by Western blotting after 8% SDS-PAGE. (B) Schematic representation of Flag-tagged full-length hTDP1 and truncated hTDP1 (residues 1–185) constructs. The regulatory NTD and the catalytic domain are indicated with different colors. (C) PARP1 binds the NTD of TDP1. Flag-tagged TDP1 constructs were expressed in HCT116 cells. TDP1 was immunoprecipitated using anti-Flag antibody and the immune complexes were probed with anti-PARP1 antibody. Blots were subsequently stripped and probed with anti-Flag antibody. Lower panel shows PARP1 input corresponding to one-tenth of the lysate. Control immunoprecipitation with anti-IgG demonstrates the specificity of the reactions. (D) Schematic representation of GST-fused full-length hPARP1 and hPARP1 truncated domains corresponding to the DNA binding domain (DBD) (residues 1–371), the BRCT (C-terminal domain of a breast cancer susceptibility protein; residues 384–524) and the C-terminal domain (CTD) harboring the catalytic site (residues 525–1014). (E) TDP1 binds the CTD of PARP1. The GST-tagged full-length and truncated domains of PARP1 were expressed in HCT116 cells. PARP1 and its truncated domains were immunoprecipitated using anti-GST antibody, and the immune complexes were detected by western blotting after 4–20% SDS-PAGE with anti-TDP1 antibody. Lower panel shows TDP1 input corresponding to one-tenth of the lysates.
Figure 3.
Figure 3.
TDP1 is PARylated but not inactivated by PARP1. (A) ADP-ribosylation of TDP1. Purified hPARP1 (1 µg, Lanes 1–3) was incubated without (Lane 1) or with 1.5 µg (Lane 2) or 3 µg (Lane 3) purified hTDP1 in the presence of [32P]-NAD+ and DNase I–treated DNA for 20 min at 25°C. Samples were analyzed by 10% SDS-PAGE. Autoradiography of the Coomassie Blue–stained gel shown at left. Protein molecular weight markers (kDa) are indicated at left. (B) Schematic representation of the TDP1 biochemical assays using a single-stranded oligopeptide 14Y. 32P-radiolabeling (*) was at the 5′-terminus of the oligopeptide. TDP1 converts 14Y to an oligonucleotide with 3′-phosphate, 14P (14). (C) Representative gels showing TDP1 catalytic activity (5 nM) in the presence of PARP1 in PARylation conditions (5–20 nM, increasing concentrations as indicated). Reactions were performed at 0°C for the indicated times. (D) Schematic representation of the FRET-based TDP1 assay using a 14-mer single-stranded substrate with an internally labeled quencher (TAMRA) and a fluorophore (fluorescein) attached to the 3′-DNA-end. Hydrolysis of the 3′-phosphodiester bond by TDP1 releases the free fluorescein, which was measured in real time at 520 nm. (E) TDP1 activity measured by FRET-based assays plotted as a function of PARP1/TDP1 ratio.
Figure 4.
Figure 4.
TDP1 recruitment to DNA damage sites is determined by PARP1 activity in addition to TDP1 SUMOylation. (A) Representative images showing the recruitment of wild-type TDP1 (GFP-TDP1WT) or SUMOylation mutant TDP1 (GFP-TDP1K111R) transiently expressed in HCT116 cells in response to laser-induced DNA damage. Cells expressing the ectopic proteins were kept untreated or pretreated for 2 h with the PARP inhibitor (ABT-888, 5 µM) and were analyzed by micro-irradiation with live cell microscopy and photobleaching (FRAP analysis). A subnuclear spot indicated by a circle was bleached (BLH) for 300 ms and photographed at regular intervals of 5 s thereafter. Successive images taken for ∼130 s after bleaching illustrate fluorescence return into the bleached areas. (B) Quantitation of FRAP data (n = 5) showing mean curves. Error bars represent the standard error of the mean.
Figure 5.
Figure 5.
PARP1 recruits both XRCC1 and TDP1 to Top1-induced damage sites. (A) Endogenous PARP1 co-immunoprecipitates TDP1. HCT116 cells were treated with CPT (10 µM for 2 h) alone or with ABT-888 (5 µM for 2 h). Endogenous PARP1 was immunoprecipitated with anti-PARP1 antibody and immune complexes were blotted with anti-PAR or anti-TDP1 antibodies. Blots were subsequently stripped and probed with anti-PARP1 antibody. Control immunoprecipitation with anti-IgG antibody demonstrates the specificity of the reactions. (B) TDP1 co-immunoprecipitates PARP1. Flag-tagged hTDP1 was ectopically expressed in HCT116 cells. Following CPT treatment without or with ABT-888 (as in A), TDP1 was immunoprecipitated with anti-Flag antibody and immune complexes were probed with anti-PAR, anti-PARP1 or anti-XRCC1 antibodies. Blots were subsequently stripped and probed with anti-TDP1 antibody. Protein molecular weight markers (kDa) are indicated at right. (C) Knocking down PARP1 abrogates the TDP1-XRCC1 interaction. Flag-tagged hTDP1 was ectopically expressed in isogenic HeLa cells stably transfected with PARP1-shRNA or control (Ctr)-shRNA. Following CPT treatment (as in A), ectopic TDP1 was immunoprecipitated using anti-Flag antibody and the immune complexes were blotted with anti-XRCC1 antibodies. (D) TDP1–PARP1 association is not mediated through DNA. Flag-tagged hTDP1 was ectopically expressed in HCT116 cells treated with CPT (as in A). Cell lysates was pretreated with Benzonase® nuclease before co-immunoprecipitation. The immune complexes were probed with anti-PARP1 or anti-XRCC1 antibodies. Blots were subsequently stripped and probed with anti-TDP1 antibody. Migration of protein molecular weight markers (kDa) is indicated at right. Aliquots (10%) of the input show the level of indicated proteins before immunoprecipitation. (E) CPT-induced XRCC1 foci are abrogated by ABT-888. Representative immunofluorescence microscopy image of HCT116 cells treated with CPT (1 µM for 3 h) alone or with ABT-888 (5 µM for 3 h). Focal accumulation of PAR-polymers and XRCC1 are shown in green. (F) Defective XRCC1 focus formation in HeLa cells stably transfected with PARP1-shRNA. Representative immunofluorescence microscopy image of control-shRNA (Ctr) or PARP1-shRNA HeLa cells were treated with CPT (1 µM for 3 h) and subsequently fixed and immunostained for XRCC1 (green) or PARP1 (red). Nuclei are outlined as dashed white line circle.
Figure 6.
Figure 6.
TDP1–PARP1 association stimulates CPT-induced XRCC1 foci formation. (A) Representative immunofluorescence microscopy images showing CPT-induced (1 µM for 3 h) nuclear XRCC1 foci in TDP1+/+ and −/− MEFs cells. XRCC1 foci are in green. Nuclei were stained with DAPI (blue). (B) Quantitation of XRCC1 foci per nuclei after CPT treatment in TDP1+/+ (dark bar) and −/− cells (light gray bar) calculated from 25 to 30 cells per sample (Error bar: mean values ± SEM). Asterisks denote statistically significant difference (**P < 0.001; t-test). (C) TDP1 deficiency impairs the CPT-induced PARP1–XRCC1 interaction. GST-tagged hPARP1 was ectopically expressed in isogenic TDP1+/+ and −/− MEFs cells. Following CPT treatment (5 µM for 2 h) alone or with ABT-888 (5 µM for 2 h), ectopic PARP1 was immunoprecipitated using anti-GST antibody and the immune complexes were blotted with anti-XRCC1 antibody. Blots were subsequently stripped and probed with anti-GST antibody to evaluate PARP1 expression. Aliquots (10%) of the input demonstrate equal protein levels before immunoprecipitation.
Figure 7.
Figure 7.
PARP1 stabilizes TDP1. (A and B) PARP inhibition by ABT-888 interferes with CPT-induced TDP1 stabilization. HCT116 cells treated with 10 µM CPT and/or ABT-888 (10 µM) were co-treated with CHX for the indicated times. Endogenous TDP1 was detected by western blotting (panel A, representative experiment) and quantified by densitometry analyses after normalization to actin (panel B). Data represent the mean ± standard error of at least three independent experiments. (C and D) PARP1 knockdown (isogenic HeLa cells stably transfected with PARP1-shRNA) reduces TDP1 stabilization by CPT. Cells were treated with CPT (10 µM) in the presence CHX for the indicated times. TDP1 levels were determined by western blotting (panel C, representative experiment) and quantified by densitometry normalized to actin (panel D). Data represents mean ± standard errors. (E) Representative experiment showing the kinetics of TDP1 phosphorylation at Ser81 (pS81-TDP1), γH2AX and the disappearance of total TDP1 in HCT116 cells treated with CPT (1 µM) in the absence or presence of ABT-888 (5 µM) for the indicated times. Protein levels were determined by western blotting.
Figure 8.
Figure 8.
Schematic representation of PARP1–TDP1 coupling for the repair of Top1–DNA covalent complexes. (1) The C-terminus domain of PARP1 binds the N-terminus regulatory domain of TDP1 (double-headed arrow). The PARP1–TDP1 molecular complex is shown as a black node. (2) PARP coupling with TDP1 stimulates (open arrow) the excision of Top1-DNA covalent complexes by the phosphodiesterase activity of TDP1 (jigsaw line) (3). The parallel pathway for Top1–DNA complex removal involves various endonucleases (4) including XPF-ERCC1, CtIP and Mre11. Graphical symbols for molecular interactions are derived from Kohn’s MIM conventions (68).

References

    1. Wang JC. A journey in the world of DNA rings and beyond. Annu. Rev. Biochem. 2009;78:31–54. - PubMed
    1. Champoux JJ. DNA topoisomerases: structure, function, and mechanism. Annu. Rev. Biochem. 2001;70:369–413. - PubMed
    1. Pommier Y. Drugging topoisomerases: lessons and challenges. ACS Chem. Biol. 2013;8:82–95. - PMC - PubMed
    1. Dexheimer TS, Antony S, Marchand C, Pommier Y. Tyrosyl-DNA phosphodiesterase as a target for anticancer therapy. Anticancer Agents Med. Chem. 2008;8:381–389. - PMC - PubMed
    1. El-Khamisy SF, Caldecott KW. DNA single-strand break repair and spinocerebellar ataxia with axonal neuropathy-1. Neuroscience. 2007;145:1260–1266. - PubMed

Publication types

MeSH terms

Substances