Review
. 2014 Feb 3;369(1638):20130109.
doi: 10.1098/rstb.2013.0109. Print 2014 Mar 19.

Ion channels and transporters in the development of drug resistance in cancer cells

Affiliations
Review

Ion channels and transporters in the development of drug resistance in cancer cells

Else K Hoffmann et al. Philos Trans R Soc Lond B Biol Sci. .

Abstract

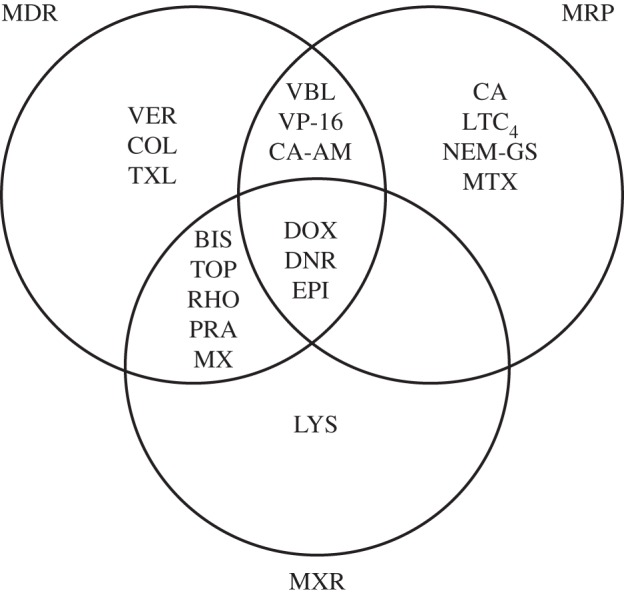
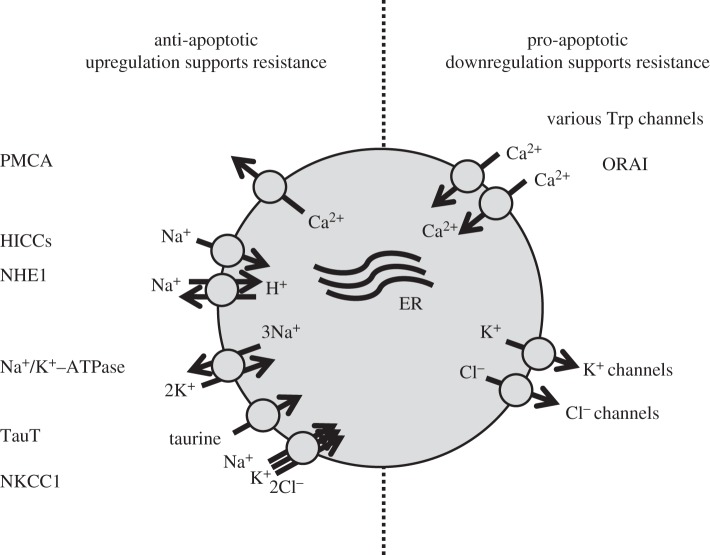
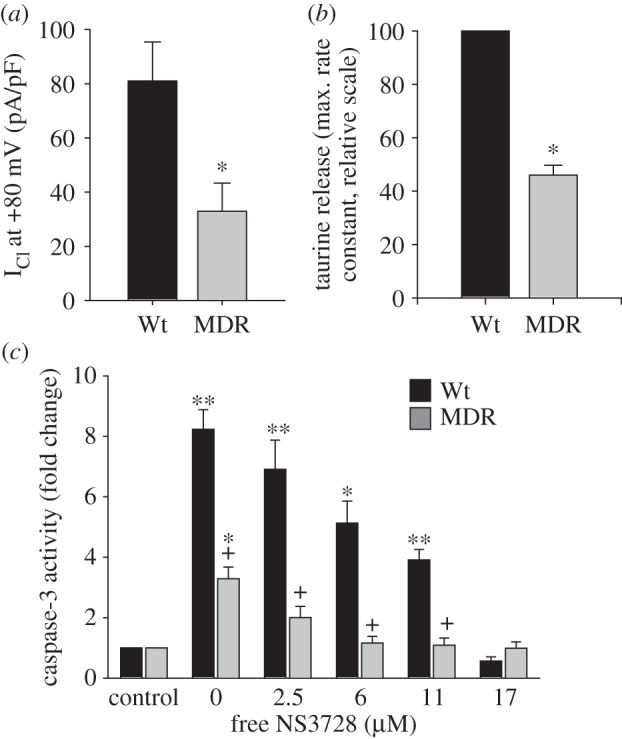
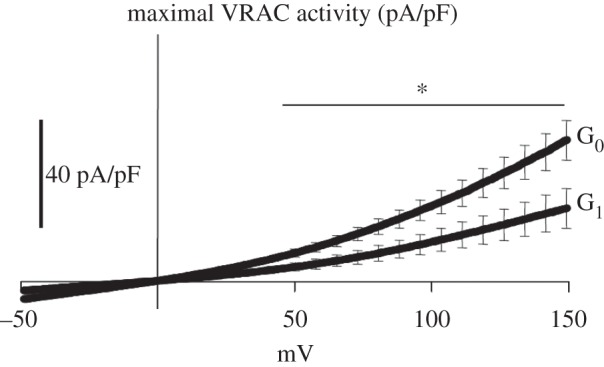
Multi-drug resistance (MDR) to chemotherapy is the major challenge in the treatment of cancer. MDR can develop by numerous mechanisms including decreased drug uptake, increased drug efflux and the failure to undergo drug-induced apoptosis. Evasion of drug-induced apoptosis through modulation of ion transporters is the main focus of this paper and we demonstrate how pro-apoptotic ion channels are downregulated, while anti-apoptotic ion transporters are upregulated in MDR. We also discuss whether upregulation of ion transport proteins that are important for proliferation contribute to MDR. Finally, we discuss the possibility that the development of MDR involves sequential and localized upregulation of ion channels involved in proliferation and migration and a concomitant global and persistent downregulation of ion channels involved in apoptosis.

Keywords: apoptosis; cancer; drug resistance; ion channels in cancer; tumour proliferation.


Figures

Figure 1.
Figure 1.
Substrate overlaps between the transporters P-glycoprotein/MDR1, multi-drug-resistance-associated protein (MRP) and mitoxantrone-resistance protein (MXR). The substrate and inhibitor profiles for the transporters were obtained from micrographs that showed the steady-state accumulation of fluorescent drugs (60 min incubation at 37°C); adapted from [7]. BIS, bisantrene; CA, calcein; CA-AM, calcein-AM ester; COL, colchicine; DNR, daunorubicin; DOX, doxorubicin; EPI, epirubicin; LTC4, leukotriene C4; LYS, LysoTracker; MTX, methotrexate; MX, mitoxantrone; NEM-GS, N-ethyl maleimide glutathione; PRA, prazosin; RHO, rhodamine 123; TXL, taxol; TOP, topotecan; VBL, vinblastine; VER, verapamil; VP-16, etoposide.
Figure 2.
Figure 2.
Anti- and pro-apoptotic plasma membrane-bound ion transporters involved in MDR. The anti-apoptotic transporters include the plasma membrane Ca2+ ATPase (PMCA), hypertonicity-induced cation channels (HICCs), the Na+/H+ exchanger (NHE1), the Na+/K+-ATPase, the Na+-dependent taurine transporter (TauT) and the 1Na+, 1K+, 2Cl cotransporter (NKCC1). The pro-apototic transporters include the membrane-bound Ca2+ channel (Orai1) and various transient receptor potential channels (Trps) and K+ and Cl channels.
Figure 3.
Figure 3.
Time-dependent changes in cellular water content and ion content in Wt EATC following exposure to 5 µM cisplatin. (a) The water content (millilitre per gram cell dry weight) was normalized to values obtained prior to cisplatin exposure. (b) Cl content (micromole per gram cell dry weight) was obtained by Ag+ titration. (c,d) K+ and Na+ content was determined using emission flame photometry. The values are reported as means with the standard error of the mean. Asterisks (*) and plus symbols (++) indicate values that were significantly different from the initial control value. Adapted from [19].
Figure 4.
Figure 4.
Changes in cell volume and caspase 3 activity in wild-type (Wt) and multi-drug resistant (MDR), EATC. (a) Cell volume was estimated by electronic cell sizing using the Coulter counter technique. (b) Caspase 3 activity was determined using a calorimetric assay to detect production of p-nitroanilide by cleavage of the substrate acetyl-Asp-Glu-Val-Asp p-nitroanilide. The values are reported as means with the standard error of the mean. In (a), asterisk (*) indicates a significant difference between Wt and MDR EATC cells. In (b), asterisk (*) indicates a significant difference compared with control, and plus symbol (+) indicates a significant difference between Wt and MDR EATC cells. Adapted from [19].
Figure 5.
Figure 5.
Downregulation of the volume-regulated Cl current/taurine release pathway in multi-drug resistant (MDR) Ehrlich ascites cells (EATC) and elimination of cisplatin-induced apoptosis following addition of the Cl channel blocker NS3728. (a) The volume-activated Cl current was measured using a whole-cell patch-clamp technique following hypotonic exposure (reduction of the extracellular medium to two-third of the isotonic value). (b) Volume-activated release of the organic osmolyte taurine was estimated as the maximal obtainable rate constant following hypotonic exposure. The MDR value is relative to the value in Wt cells. (c) Caspase 3 activity was measured using a calorimetric assay to detect production of p-nitroanilide by cleavage of the substrate acetyl-Asp-Glu-Val-Asp p-nitroanilide. NS3728 was added to block the Cl current, and the free concentration of NS3728 was determined using Centrifree YM-30 micropartition devices and 14C-labelled NS3728. In (a,b), asterisk (*) indicates significant differences compared with Wt EATC. In (c), asterisk (*) indicates a significant difference compared with control cells without cisplatin, and plus symbol (+) indicates a significant difference between Wt and MDR EATC cells. Adapted from [19].
Figure 6.
Figure 6.
Cell cycle-dependent changes in maximal volume-regulated anion channel (VRAC) activity in ELA cells. The VRAC current was measured using a whole-cell patch-clamp technique as the Cl current in G0 and G1 phase ELA cells following exposure to hypotonic extracellular solution (190 mOsm) and at nominally zero [Ca2+]i (no added Ca2+, 10 mM EGTA in the pipette solution). The data shown are the I/V relationships based on the mean current density obtained from six to nine cells at each cell cycle phase; error bars indicate the standard error of the mean. Asterisk (*) indicates that the current densities in G0 are significantly different from those in G1 (p < 0.05). Adapted from [38].

Similar articles

Cited by

References

    1. Krishna R, Mayer LD. 2000. Multidrug resistance (MDR) in cancer. Mechanisms, reversal using modulators of MDR and the role of MDR modulators in influencing the pharmacokinetics of anticancer drugs. Eur. J. Pharm. Sci. 11, 265–283. (10.1016/S0928-0987(00)00114-7) - DOI - PubMed
    1. Lothstein L, Israel M, Sweatman TW. 2001. Anthracycline drug targeting: cytoplasmic versus nuclear--a fork in the road. Drug Resist. Update 4, 169–177. (10.1054/drup.2001.0201) - DOI - PubMed
    1. Stavrovskaya AA. 2000. Cellular mechanisms of multidrug resistance of tumor cells. Biochemistry (Mosc). 65, 95–106. - PubMed
    1. El MG, Le TC, Batty GN, Faivre S, Raymond E. 2009. Markers involved in resistance to cytotoxics and targeted therapeutics in pancreatic cancer. Cancer Treat Rev. 35, 167–174. (10.1016/j.ctrv.2008.10.002) - DOI - PubMed
    1. Tamburrino A, Piro G, Carbone C, Tortora G, Melisi D. 2013. Mechanisms of resistance to chemotherapeutic and anti-angiogenic drugs as novel targets for pancreatic cancer therapy. Front Pharmacol. 4, 56 (10.3389/fphar.2013.00056) - DOI - PMC - PubMed

Publication types

MeSH terms