. 2014 Feb 10;211(2):365-79.
doi: 10.1084/jem.20131603. Epub 2014 Feb 3.

Monovalent engagement of the BCR activates ovalbumin-specific transnuclear B cells

Affiliations

Monovalent engagement of the BCR activates ovalbumin-specific transnuclear B cells

Ana M Avalos et al. J Exp Med. .

Abstract

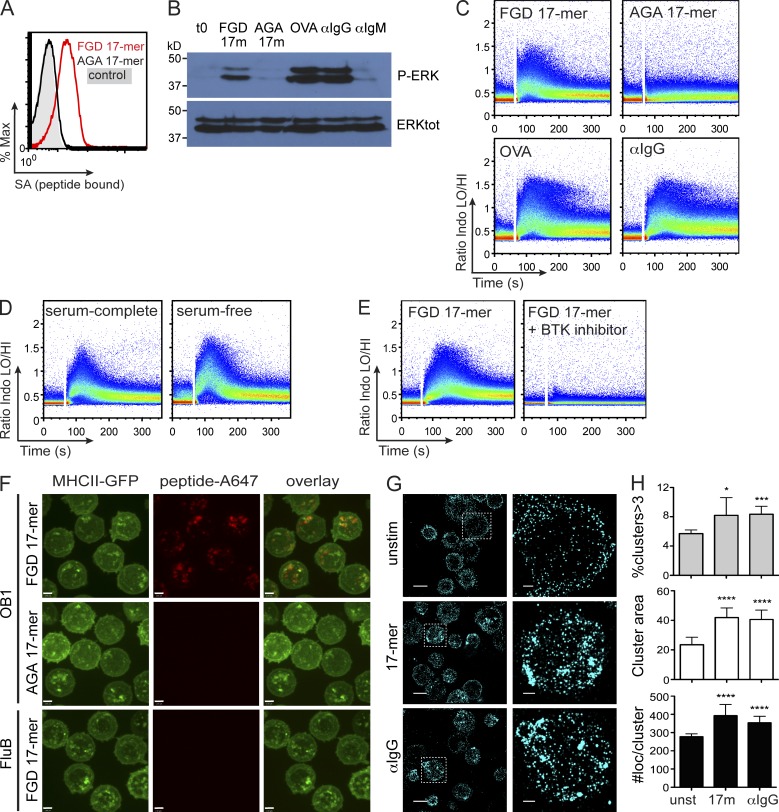
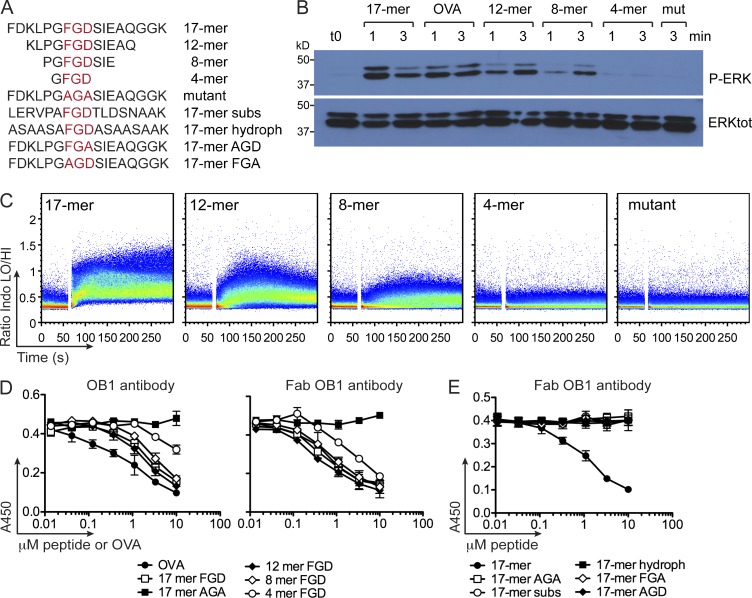
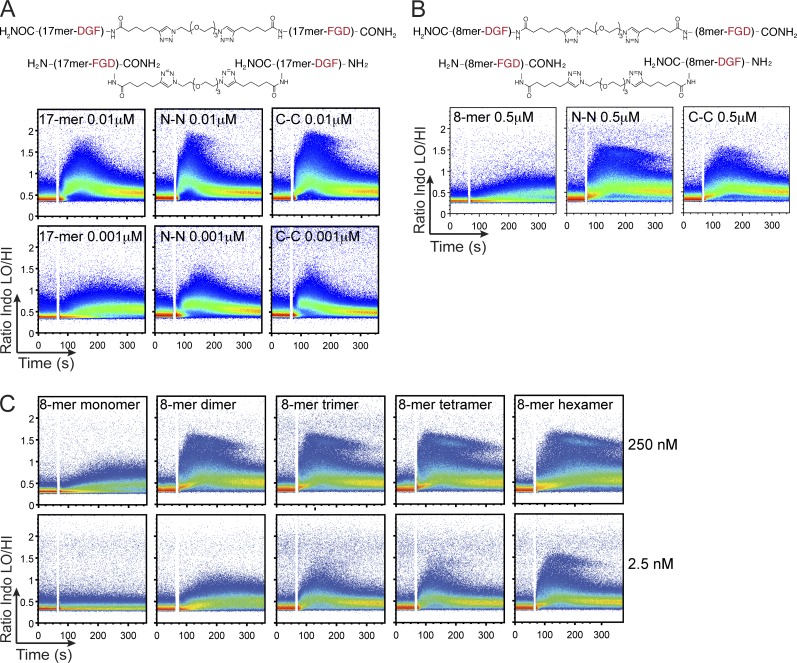
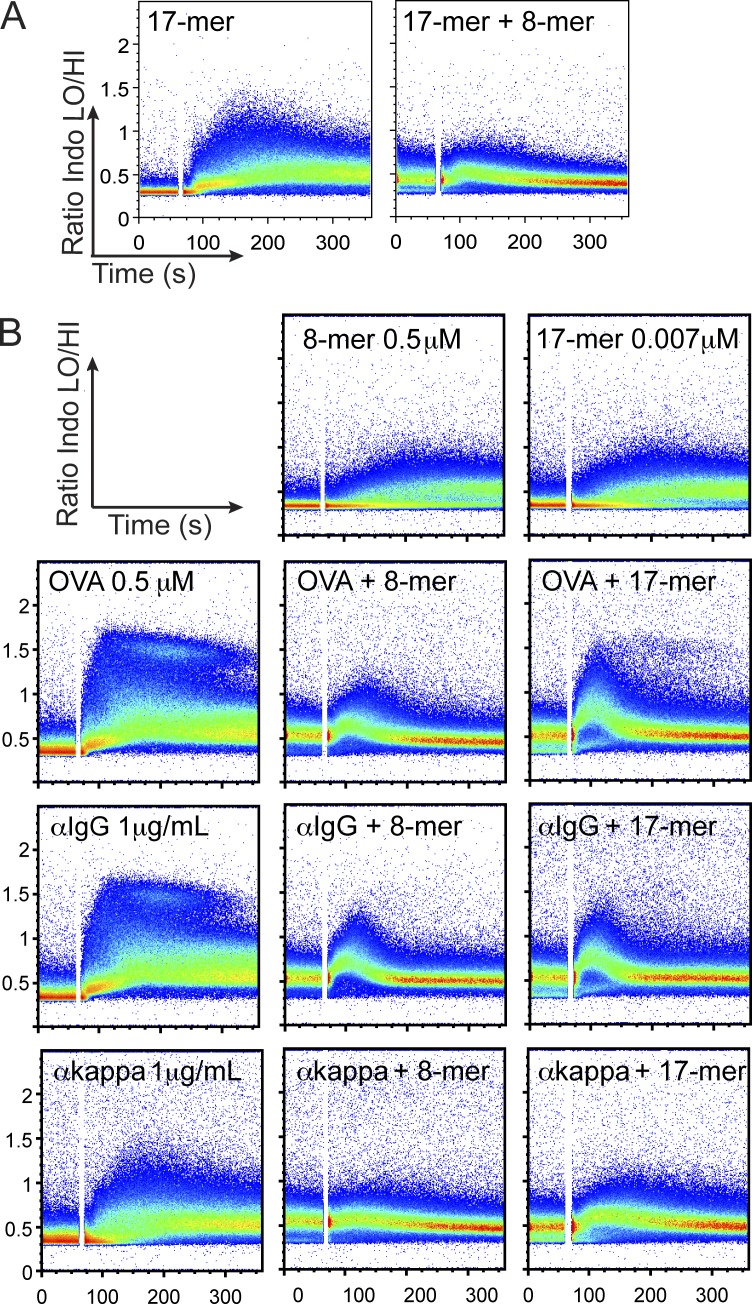
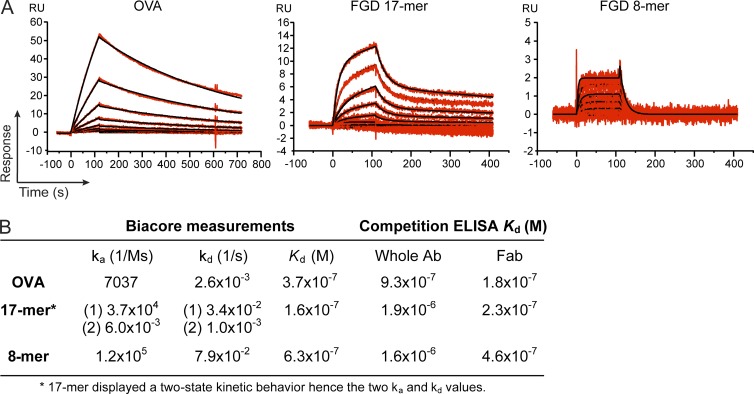
Valency requirements for B cell activation upon antigen encounter are poorly understood. OB1 transnuclear B cells express an IgG1 B cell receptor (BCR) specific for ovalbumin (OVA), the epitope of which can be mimicked using short synthetic peptides to allow antigen-specific engagement of the BCR. By altering length and valency of epitope-bearing synthetic peptides, we examined the properties of ligands required for optimal OB1 B cell activation. Monovalent engagement of the BCR with an epitope-bearing 17-mer synthetic peptide readily activated OB1 B cells. Dimers of the minimal peptide epitope oriented in an N to N configuration were more stimulatory than their C to C counterparts. Although shorter length correlated with less activation, a monomeric 8-mer peptide epitope behaved as a weak agonist that blocked responses to cell-bound peptide antigen, a blockade which could not be reversed by CD40 ligation. The 8-mer not only delivered a suboptimal signal, which blocked subsequent responses to OVA, anti-IgG, and anti-kappa, but also competed for binding with OVA. Our results show that fine-tuning of BCR-ligand recognition can lead to B cell nonresponsiveness, activation, or inhibition.


Figures

Figure 1.
Figure 1.
OVA-specific OB1 B cells are activated by peptide containing the epitope FGD. (A) OB1 B cells were incubated on ice in the absence (control) or presence of biotinylated versions of 0.5 µM FGD 17-mer and AGA 17-mer peptides. Binding was detected by flow cytometry using SA-APC. (B) OB1 B cells were stimulated with equimolar (0.5 µM) FGD 17-mer, AGA 17-mer, or OVA or 5 µg/ml anti-IgG1 or anti-IgM for 3 min, and then lysates were run in SDS-PAGE and immunoblotted with anti–phospho-ERK (top) or anti–total ERK (bottom). (C) OB1 B cells were loaded with Ca2+-sensitive Indo-1 AM dye and collected for 1 min (unstimulated baseline). After that, 5 µM FGD 17-mer, AGA 17-mer, or OVA or 5 µg/ml anti-IgG1 was added and collected for five additional minutes. (D) OB1 B cells were resuspended in serum-free or serum-complete RPMI, and Ca2+ trace was collected as in C upon incubation with 0.5 µM FGD 17-mer. (E) OB1 B cells loaded with Indo-1 AM dye were preincubated with 50 nM Btk inhibitor for 30 min at 37°C, and Ca2+ trace was collected upon stimulation with 0.5 µM FGD 17-mer. (F) Render of z-stacks of confocal microscopy of OB1 MHC II GFP B cells that were incubated for 10 min with Alexa Fluor 647–labeled FGD or AGA 17-mer or FluB1 MHC II B cells stimulated with Alexa Fluor 647–labeled FGD 17-mer. (G) OB1 B cells were either left unstimulated or stimulated with 17-mer or anti-IgG for 15 min in the presence of 100 µM dynasore at 37°C and stained with anti–mouse IgG antibody conjugated with Alexa Fluor 405 and Alexa Fluor 647 for STORM imaging. Representative fields (left) and single-cell images from selected box regions (right) are shown. Bars: (F) 2 µm; (G, left) 5 µm; (G, right) 1 µm. (H) The percentage of clusters that have more than three BCRs (top), the cluster size (middle), and the number of localizations within clusters (bottom) between unstimulated, 17-mer, and anti-IgG conditions were quantified, and means and SDs are plotted. Unpaired Student’s t test was performed comparing the total number of clusters contained in unstimulated versus the 17-mer or the anti-IgG condition. The number of cells analyzed was 67 (unstimulated), 102 (17-mer), and 118 (anti-IgG). P values of resulting analysis are shown: *, P = 0.024; ***, P = 0.0004; ****, P < 0.0001. Results shown are representative of two (A, G, and H) and at least three independent experiments (B–F).
Figure 2.
Figure 2.
Shorter peptides containing the FGD sequence bind to OB1 B cells but fail to elicit a response. (A) Sequence of peptides nested on the FGD epitope bearing 17, 12, 8, and 4 amino acids, the mutant (mut) AGA 17-mer, and 17-mer peptides where the flanking residues were either substituted by same-polarity amino acids (17-mer subs), by hydrophobic amino acids with the exception of four serines (17-mer hydroph), or 17-mer peptides in which the core FGD was mutated to AGD or FGA. (B) OB1 B cells were stimulated with 0.5 µM of each FGD 17-mer, OVA, 12-, 8-, and 4-mer peptides for 1 and 3 min, and AGA 17-mer (mut) for 3 min, and then lysates were run in SDS-PAGE and immunoblotted with anti–phospho-ERK (top) or anti–total ERK (bottom). (C) OB1 B cells were loaded with Indo-1 AM, stimulated with 0.5 µM FGD 17-, 12-, 8-, and 4-mer and 17-mer AGA (mut), and Ca2+ flux traces were collected. (D) ELISA plates were coated with 0.1 µM OVA, and then 50 ng/ml of whole OB1 antibody (left) or 500 ng/ml OB1 antibody Fab (right) plus increasing concentrations of FGD 17-, 12-, 8-, and 4-mer, AGA 17-mer mutant peptide, or OVA were added. Plates were developed with anti-IgG1 HRP (left) or anti-Fab HRP (right). (E) Competitive ELISA was performed as in D but adding increasing concentrations of 17-mer subs, hydroph, AGD, or FGA, according to the sequences in A. Results are representative of three (B and C) independent experiments. In D and E, mean + SEM of two (whole antibody) and three (Fab) independent experiments is shown.
Figure 3.
Figure 3.
Increased valency and N-N orientation favor enhanced B cell stimulation. (A and B) FGD 17-mer (A) or FGD 8-mer (B) peptides were linked on an N-N (top structure) or C-C (bottom structure) orientation by click chemistry. Monomers or N-N or C-C dimers for FGD 17-mer at 0.01 and 0.001 µM (A) or FGD 8-mer at 0.5 µM (B) were added to OB1 B cells loaded with Indo-1 AM, and Ca2+ flux traces were collected. (C) Peptides carrying one, two, three, four, and six copies of FGD 8-mer (monomer, dimer, trimer, tetramer, and hexamer, respectively) at 250 nM (top) or 2.5 nM (bottom) were added to OB1 B cells that were loaded with Indo-1 AM, and Ca2+ flux traces were collected. Results are representative of two (A and C) and three (B) independent experiments.
Figure 4.
Figure 4.
Peptides that bind but do not elicit a response block activation by antigen or cross-linking agents. (A) OB1 B cells were loaded with Indo-1 AM and incubated for 5 min with 0.5 µM FGD 8-mer or media before addition of equimolar FGD 17-mer. (B, top two panels) OB1 B cells were incubated with 8-mer at 0.5 µM or 17-mer at 0.007 µM. (bottom nine panels) OB1 B cells were preincubated with 8-mer as stated in A (middle) or with 17-mer at 0.007 µM (right) for 6 min before addition of 0.5 µM OVA (top), anti-IgG at 1 µg/ml (middle), or anti-kappa at 1 µg/ml (bottom), and Ca2+ flux traces were collected. Results are representative of three independent experiments, except for anti-kappa (two).
Figure 5.
Figure 5.
FGD 17-mer, FGD 8-mer, and OVA share similar Kd but different binding behavior. (A) CM5 chips coated with OB1 antibody were subject to Biacore measurements using OVA (left), FGD 17-mer (middle), and FGD 8-mer (right) peptides as analytes, and binding was recorded as relative units (RU) at different concentrations of analyte. Data recorded are shown in red, and the model prediction is shown in black. (B) Kinetic parameters calculated by Biacore experiments and competitive ELISAs.
Figure 6.
Figure 6.
Computational modeling of OVA, 17-mer, and 8-mer binding and activation. (A) The fraction of doubly phosphorylated ITAM versus time for FGD 8-mer, 17-mer, and OVA from stochastic simulations: (left) for the case when konLyn[Lyn]>koff8mer and all peptide concentrations are the same; inset shows the level of phosphorylated ITAMs in Igα in response to 17-mer, 8-mer, or OVA; (middle) for the case when konLyn[Lyn]<koff8mer and all peptide concentrations are the same; (right) for the case when konLyn[Lyn]<koff8mer and 17-mer is 8% of the OVA and 8-mer concentration. (B) Contour plots showing the probability of 8-mer rebinding as a function of 8-mer diffusion coefficient (y axis) and 17-mer concentration (x axis).
Figure 7.
Figure 7.
FGD 8-mer renders B cells unresponsive to cell-bound antigen with engaged CD40L-CD40. (A) OB1 B cells were preincubated with 5 µM FGD 8-mer or mutant AGA 17-mer for 2 h before addition of 5 µM FGD 17-mer, OVA, or 1 µg/ml anti-IgG1 and incubated for 18 h. Up-regulation of CD86 was detected by flow cytometry using anti–CD86-APC. (B) MDCK cells were stably transduced or not with CD40L-LPETG-HA and stained with anti-CD40L and anti-HA. Cells expressing both CD40L and HA were FACS-sorted and cultured in DMEM in the presence of 250 mg/ml hygromycin B. (C) Untransduced or CD40L-LPETG-HA–expressing MDCK cells were incubated with 200 µM FGD 17-mer peptide coupled to GGG and biotin in the absence or presence of 100 µM sortase A for 30 min on ice. After that, cells were washed three times with PBS, detached with 8 mM EDTA, and FACS-stained. (left) Total CD40L levels. (middle) HA levels. (right) Incorporated biotinylated peptide detected with SA. (D) Untransduced (UT) and CD40L-transduced MDCK cells (CD40L-tag) were incubated with peptide alone or in the presence of sortase A as in C, and cells were lysed and analyzed by immunoblotting for covalent incorporation of biotinylated peptide to CD40L by SA conjugated to HRP. (E) Representative scheme showing stimulation of B cells by cross-linked FGD 17-mer peptide on CD40L. (F) Sortase reaction on untransduced or CD40L-carrying MDCK cells was performed as in C. After washing, untransduced or CD40L-LPETG-HA–expressing MDCK cells were co-cultured for 18–20 h with OB1 B cells that were untreated or previously incubated with 10 µM FGD 8-mer for 2 h. Histograms show CD86 levels on B cells at the indicated conditions. Dashed lines on histograms delimit CD86 negative/low and positive/high populations. (G) Graph shows the percentage of B cells expressing high levels of CD86 under different treatments. Results shown are representative of three (A, B, and F), two (C and D), and the mean + SD of two (G) independent experiments.

References

    1. Abel S.M., Roose J.P., Groves J.T., Weiss A., Chakraborty A.K. 2012. The membrane environment can promote or suppress bistability in cell signaling networks. J. Phys. Chem. B. 116:3630–3640 10.1021/jp2102385 - DOI - PMC - PubMed
    1. Aleksic M., Dushek O., Zhang H., Shenderov E., Chen J.L., Cerundolo V., Coombs D., van der Merwe P.A. 2010. Dependence of T cell antigen recognition on T cell receptor-peptide MHC confinement time. Immunity. 32:163–174 10.1016/j.immuni.2009.11.013 - DOI - PMC - PubMed
    1. Batista F.D., Harwood N.E. 2009. The who, how and where of antigen presentation to B cells. Nat. Rev. Immunol. 9:15–27 10.1038/nri2454 - DOI - PubMed
    1. Batista F.D., Iber D., Neuberger M.S. 2001. B cells acquire antigen from target cells after synapse formation. Nature. 411:489–494 10.1038/35078099 - DOI - PubMed
    1. Bell G.I. 1978. Models for the specific adhesion of cells to cells. Science. 200:618–627 10.1126/science.347575 - DOI - PubMed

Publication types

MeSH terms