. 2014 Feb 10;211(2):181-8.
doi: 10.1084/jem.20131189. Epub 2014 Feb 3.

Erythropoietin guides multipotent hematopoietic progenitor cells toward an erythroid fate

Affiliations

Erythropoietin guides multipotent hematopoietic progenitor cells toward an erythroid fate

Amit Grover et al. J Exp Med. .

Abstract

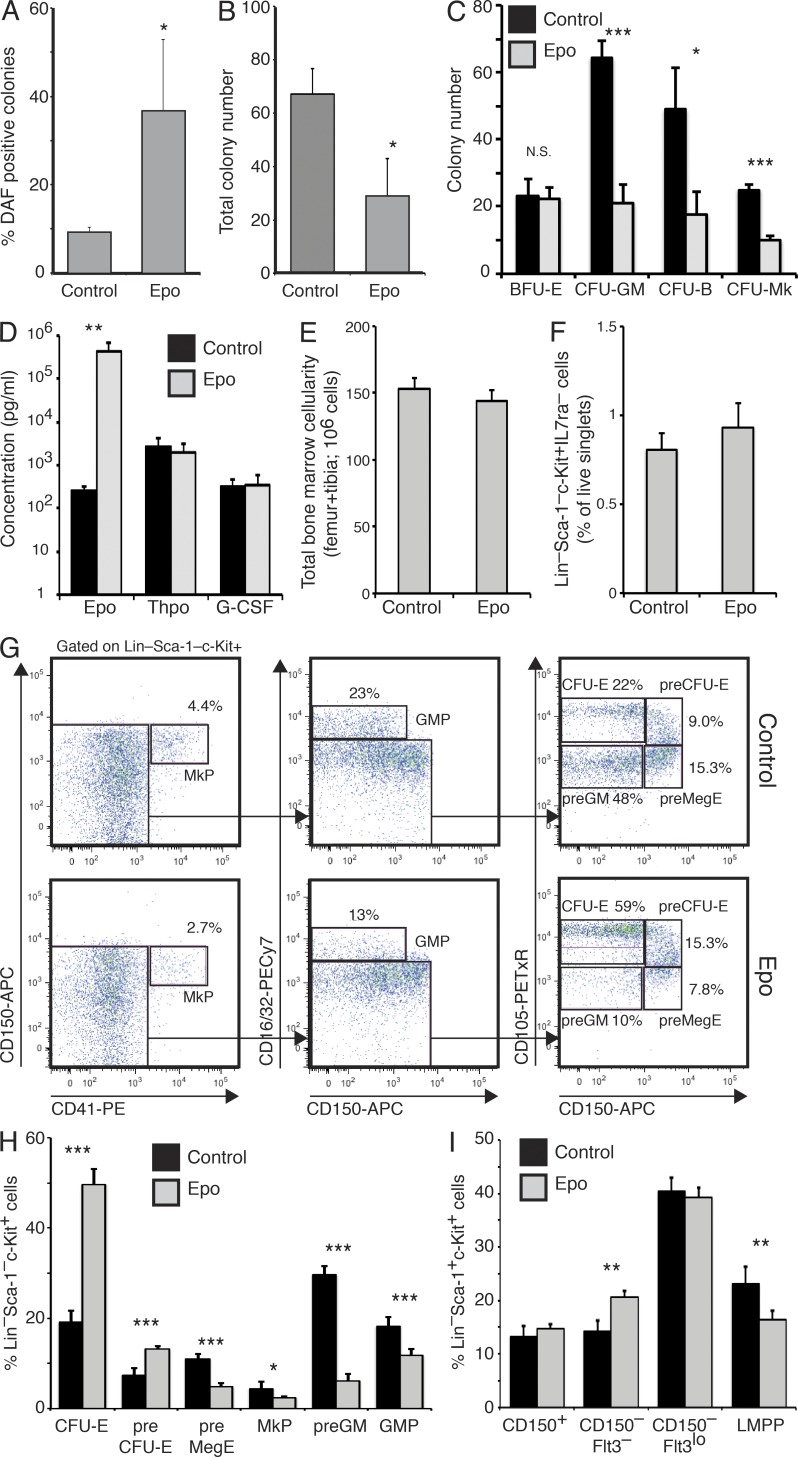
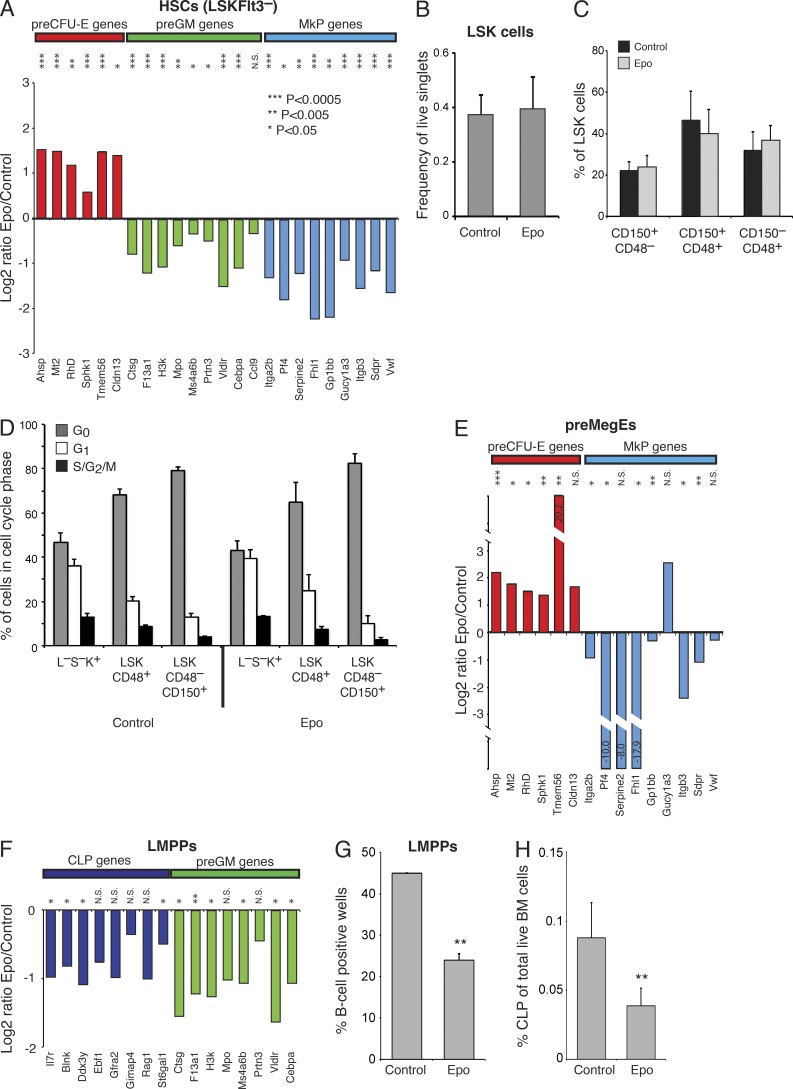
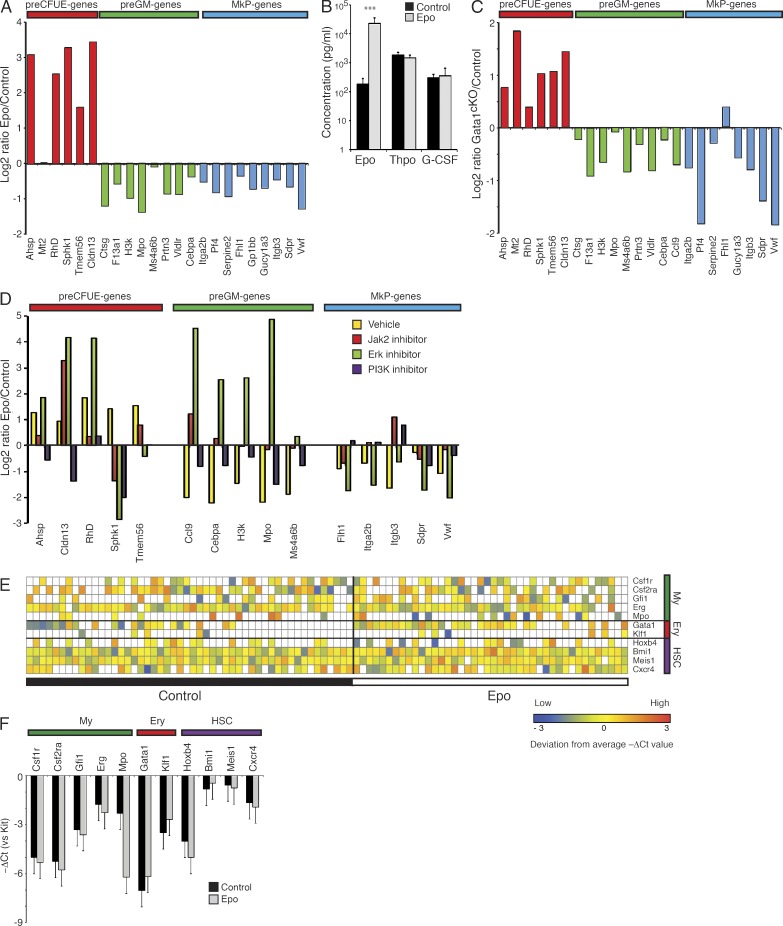
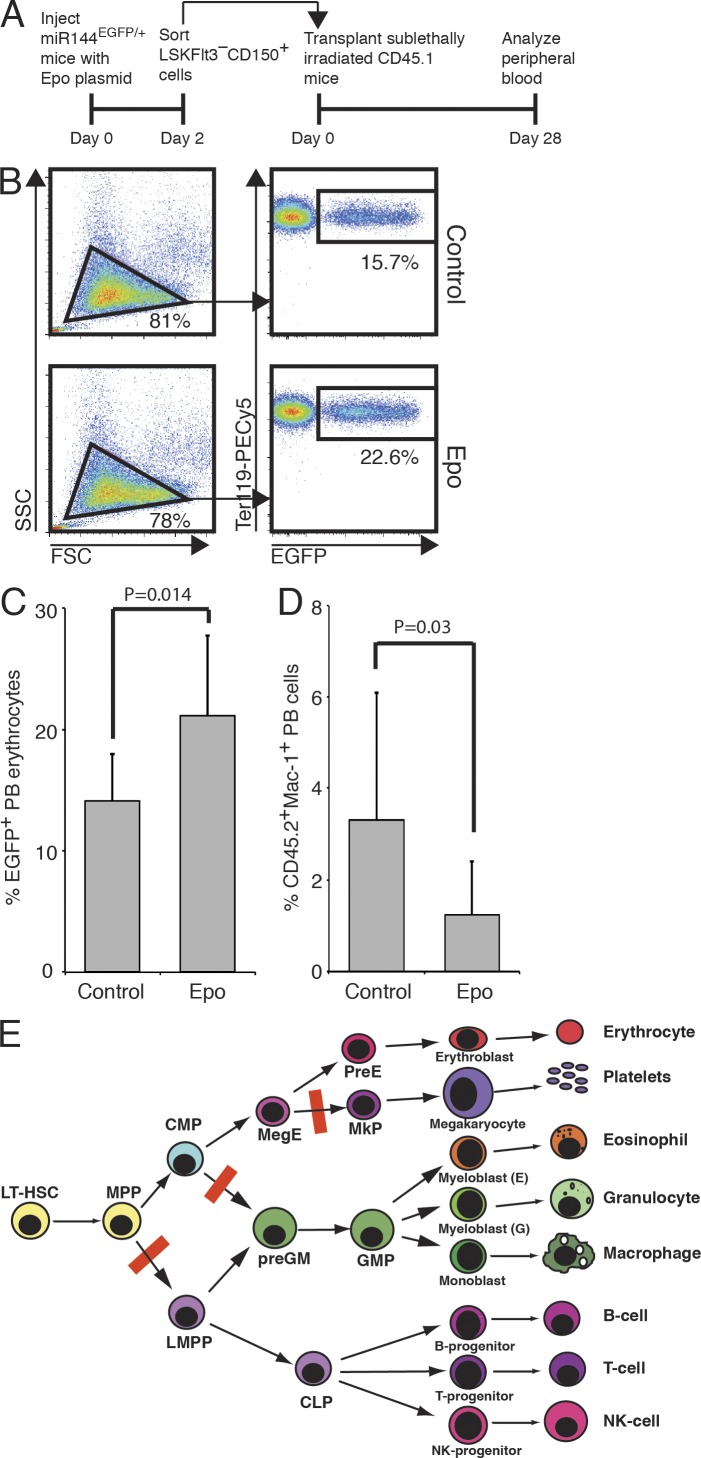
The erythroid stress cytokine erythropoietin (Epo) supports the development of committed erythroid progenitors, but its ability to act on upstream, multipotent cells remains to be established. We observe that high systemic levels of Epo reprogram the transcriptomes of multi- and bipotent hematopoietic stem/progenitor cells in vivo. This induces erythroid lineage bias at all lineage bifurcations known to exist between hematopoietic stem cells (HSCs) and committed erythroid progenitors, leading to increased erythroid and decreased myeloid HSC output. Epo, therefore, has a lineage instructive role in vivo, through suppression of non-erythroid fate options, demonstrating the ability of a cytokine to systematically bias successive lineage choices in favor of the generation of a specific cell type.


Figures

Figure 1.
Figure 1.
Systemic Epo treatment introduces E bias in myelo-erythroid progenitor and LMPP production. (A) In vitro E differentiation potential of 500 bone marrow LinSca-1c-Kit+ cells isolated after 2 d of Epo treatment (Epo) or mock treatment (control), measured by 2,7-diaminofluorene (DAF) staining of M3434 methylcellulose cultures after 8 d of culture. Values are mean ± SD, n = 3. One of two representative experiments is shown. (B) Total colonies formed from cells plated in A. (C) Colony-forming potential of 2-d Epo-exposed or control LinSca-1c-Kit+ bone marrow cells was assayed separately under GM (M3534; 500 cells), E (M3436; 1,000 cells), preB (M3630; 1,000 cells), and Mk (MegaCult; 500 cells) conditions. Values are mean ± SD, n = 3. One of two representative experiments is shown. (D) Bar graph showing serum cytokine levels in mice hydrodynamically injected with pCMV6-Epo or empty pCMV6 vector 2 d after transfection. Values are mean ± SD, n = 8, from two experiments. (E) Bar graphs showing total bone marrow cellularity (femurs and tibiae) in mice hydrodynamically injected with pCMV6-Epo vector (Epo; n = 6) or pCMV6 vector (control; n = 5), as indicated. Analysis was performed 2 d after injection. Values are mean ± SD, n = 5 (control) and 6 (Epo). One of three representative experiments is shown. (F) Bar graphs showing LinSca1c-Kit+IL7rα myelo-erythroid progenitor cells from mice in E as percentage of live singlets. (G) Representative flow cytometric analysis of the hematopoietic myelo-erythroid progenitor population from bone marrow of wild-type C57BL/6 mice after 2 d of Epo exposure. The size of gated populations as percentage of the parental population is shown next to each gate. (H) Bar graphs representing the mean size of each myelo-erythroid progenitor population as defined in G, shown as percentage of the total Lin/Sca-1/IL7Rαc-Kit+ progenitor fraction in 2-d Epo-exposed (Epo) and control mice. Values are mean ± SD, n = 5, from two experiments. (I) Bar graphs represent the frequencies of LSK subpopulations in bone marrow of 2-d Epo-exposed and control mice. Values are mean ± SD, n = 4. One of two representative experiments is shown. *, P < 0.05; **, P < 0.005; ***, P < 0.0005.
Figure 2.
Figure 2.
Epo transcriptionally reprograms HSCs and progenitors in vivo toward an erythroid fate. (A) Bar graphs showing the expression of preCFU-E, preGM, and MkP genes in in vivo, comparing Epo-exposed and control LSKFlt3 cells. Data are shown as log2 of the ratio between Epo-exposed and control cells. Values are means, n = 9, from 3 experiments. (B) Bar graphs showing mean size of LinSca-1+c-Kit+ (LSK) population as percentage of live singlets in mice hydrodynamically injected with pCMV6-Epo vector or pCMV6 control vector on day 2 after injection. Values are mean ± SD, n = 5 (control) and 6 (Epo), from 2 experiments. (C) LSK cells from B were subdivided by CD150 and CD48 expression into MPPs (defined as LSKCD48+CD150+ or LSKCD48+CD150) and primitive HSCs (defined as LSKCD48CD150+). The proportion of cells in the indicated fractions is shown as a percentage of the total LSK population. Values are mean ± SD. No significant difference (defined as P < 0.05) was observed between control and Epo-treated populations. (D) MPPs (LSKCD48+) and HSCs (LSKCD48CD150+) from mice hydrodynamically injected with pCMV6-mEpo vector (Epo, n = 3) or pCMV6 vector (control, n = 3) were analyzed on day 2 after injection for cell cycle status by intracellular staining for Ki67 and DNA content. G0 was defined as Ki67, G1 as Ki67+/2n DNA content, and S/G2/M as Ki67+/>2n DNA content. LinSca-1c-Kit+ (LSK+) progenitors are included as a positive control for high proliferation rate. Values are mean ± SD, n = 3. One of two representative experiments shown. (E) Expression of preCFU-E and MkP genes in in vivo Epo-exposed and control preMegEs. Data are represented as in A. (F) Expression of CLP and preGM genes in in vivo Epo-exposed and control LMPP. Data are represented as in A. (G) B cell potential of single Epo-exposed and control LSKFlt3hi LMPPs cultured on OP9 stromal cells. Representative FACS profiles of analyzed clone derived from a single cell are shown in Fig. S2 A. Values are mean ± SD, n = 48, from 2 experiments. (H) Bar graphs showing the number of CLPs as percentage of total live BM cells from Epo-exposed and control mice. Values are mean ± SD, n = 5. One of two representative experiments shown. *, P < 0.05; **, P < 0.005; ***, P < 0.0005; N.S., not significant.
Figure 3.
Figure 3.
Cellular and molecular mechanism of Epo action on HSCs. (A) LSKFlt3CD150+ cells were cultured in the presence (Epo) or absence (Control) of Epo. After 24 h, cells were harvested and analyzed for gene expression. Data are represented as in Fig. 2 A. Values are means, n = 2, from 2 experiments with triplicate measurements. (B) Bar graph showing different serum cytokines levels in CD45.1/2 mice competitively transplanted with 105 CD45.1 wild-type cells and either 106 CD45.2 Gata1fl/fl; Mx1-Cretg/+ (cKO) or 106 Gata1fl/fl BM cells (Con). Values are mean ± SD, n = 9 (control) and 8 (cKO), from 2 experiments. (C) CD45.1/2 mice were competitively transplanted with 105 CD45.1 wild-type and either 106 CD45.2 Gata1fl/fl; Mx1-Cretg/+ (cKO) or 106 Gata1fl/fl BM cells (Con). Cre recombination was induced by three poly(I-C) injections at 2-d intervals, and CD45.1+CD45.2LSKFlt3CD150+ cells were isolated 6 wk after the first poly(I-C) injection and subjected to gene expression profiling. Data are represented as the log2 of the ratio between gene expression in WT/cKO and WT/Control co-transplanted mice after normalization to Hprt. Values are means, n = 2, from 2 experiments with triplicate measurements. (D) LSKFlt3CD150+ cells were cultured in the presence (Epo) or absence (Control) of Epo. For both conditions, individual cultures were supplied with either vehicle (DMSO) or inhibitors of one of the following kinases: 25 µM Jak2 (AG490), 25 µM PI3K (LY294002), or 25 µM ERK1/2 (PD98059). After 24 h, cells were harvested and analyzed for gene expression. Values are means, n = 2, from 2 experiments with triplicate measurements. (E) Heat map of gene expression in single sorted LSKFlt3 HSCs analyzed by microfluidics-based real time PCR. Expression values were normalized using Kit expression and are shown as deviation from the mean expression value of each individual gene. n = 3 from 3 experiments. (F) Bar graph of mean expression of GM-, E-, and HSC-associated genes in single cells from E. Values represent the mean Δ(ΔCt(gene)−ΔCt(Kit)) for each of the genes indicated, including only cells where expression was detected. ***, P < 0.0005.
Figure 4.
Figure 4.
Epo-exposed HSCs generate reduced myeloid lineage output and increased erythroid lineage output. (A) LSKFlt3CD150+ cells were isolated from Epo-exposed or control miR144/451Egfp/+ mice and transplanted into sublethally irradiated CD45.1 recipients, followed by peripheral blood analysis 28 d after transplantation. (B) Representative flow cytometric analysis of peripheral blood erythrocytes from CD45.1 recipients transplanted in A. The gated population shows the Ter119+EGFP+ donor-derived erythrocytes. The size of gated populations as a percentage of the parental population is shown next to gates. (C and D) Bar graphs representing the mean percentage of donor-derived Ter119+EGFP+ PB erythrocytes and CD45.2+Mac-1+ PB cells, respectively, from mice transplanted in A. Values are mean ± SD, n = 9 (control) and 12 (Epo), from 2 experiments. (E) The overall effect of Epo exposure on the hematopoietic hierarchy: generation of LMPP/CLP, preGM, and MkP progenitors is impaired, leading HSC output to be directed toward the E lineage by blocking alternative exits from the HSC compartment. The result is an erythroid superhighway from the HSC to the preCFU-E.

Similar articles

Cited by

References

    1. Adolfsson J., Månsson R., Buza-Vidas N., Hultquist A., Liuba K., Jensen C.T., Bryder D., Yang L., Borge O.J., Thoren L.A., et al. 2005. Identification of Flt3+ lympho-myeloid stem cells lacking erythro-megakaryocytic potential a revised road map for adult blood lineage commitment. Cell. 121:295–306 10.1016/j.cell.2005.02.013 - DOI - PubMed
    1. Akashi K., Traver D., Miyamoto T., Weissman I.L. 2000. A clonogenic common myeloid progenitor that gives rise to all myeloid lineages. Nature. 404:193–197 10.1038/35004599 - DOI - PubMed
    1. Bereshchenko O., Mancini E., Moore S., Bilbao D., Månsson R., Luc S., Grover A., Jacobsen S.E., Bryder D., Nerlov C. 2009. Hematopoietic stem cell expansion precedes the generation of committed myeloid leukemia-initiating cells in C/EBPalpha mutant AML. Cancer Cell. 16:390–400 10.1016/j.ccr.2009.09.036 - DOI - PubMed
    1. Cheers C., Haigh A.M., Kelso A., Metcalf D., Stanley E.R., Young A.M. 1988. Production of colony-stimulating factors (CSFs) during infection: separate determinations of macrophage-, granulocyte-, granulocyte-macrophage-, and multi-CSFs. Infect. Immun. 56:247–251 - PMC - PubMed
    1. Hirai H., Zhang P., Dayaram T., Hetherington C.J., Mizuno S., Imanishi J., Akashi K., Tenen D.G. 2006. C/EBPbeta is required for ‘emergency’ granulopoiesis. Nat. Immunol. 7:732–739 10.1038/ni1354 - DOI - PubMed

Publication types

MeSH terms