Review
. 2013 Jan 1;5(1):51-108.
doi: 10.4161/derm.24494.

Sunlight and Vitamin D: A global perspective for health

Affiliations
Review

Sunlight and Vitamin D: A global perspective for health

Matthias Wacker et al. Dermatoendocrinol. .

Abstract

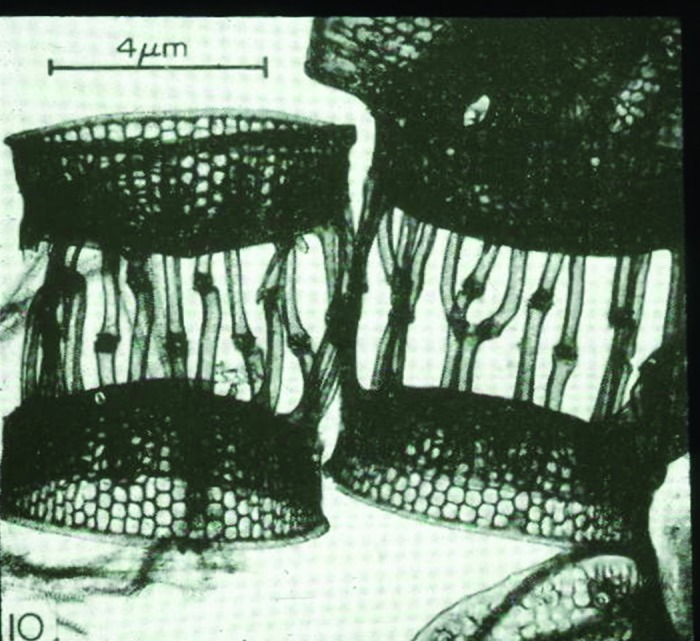
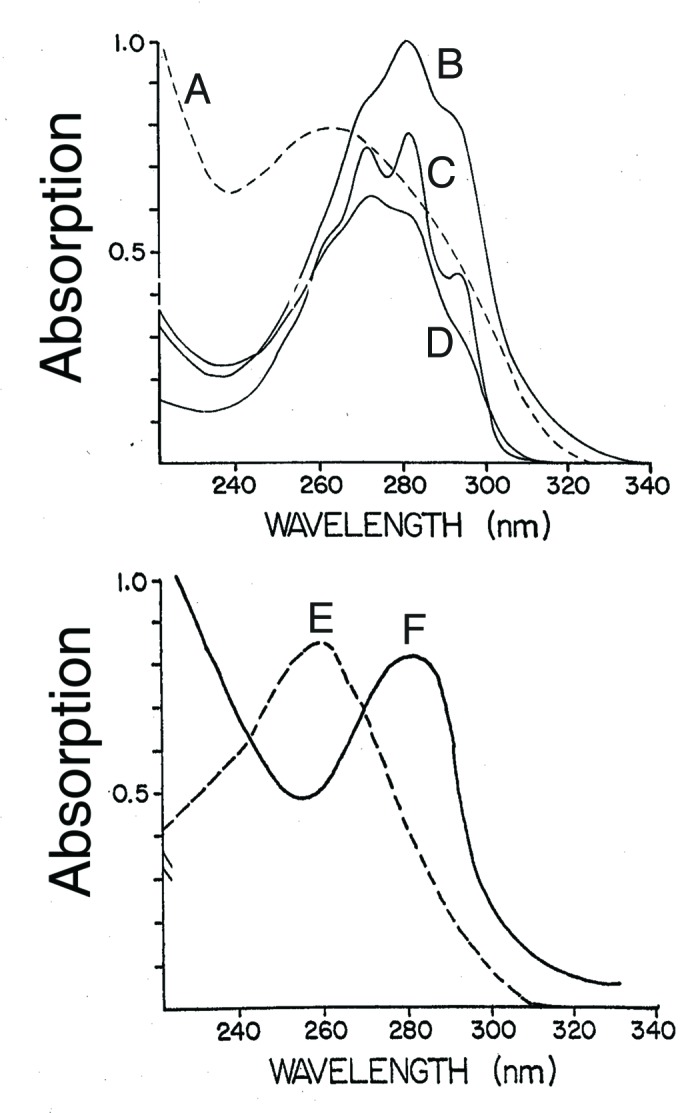
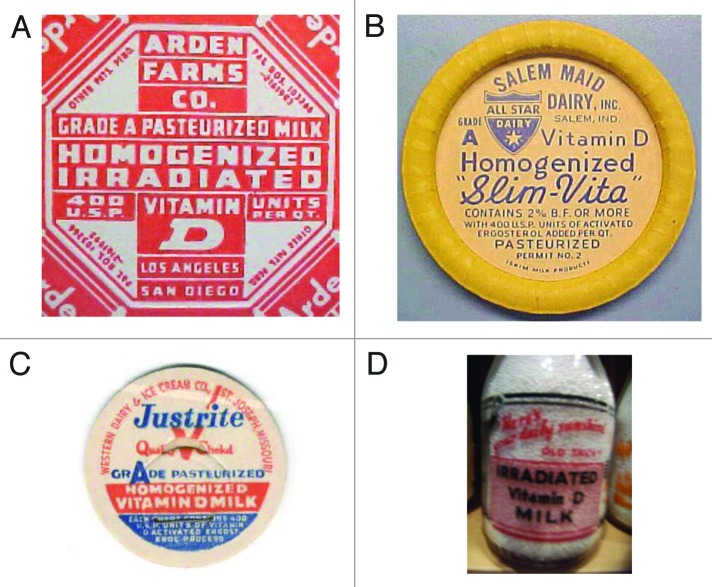
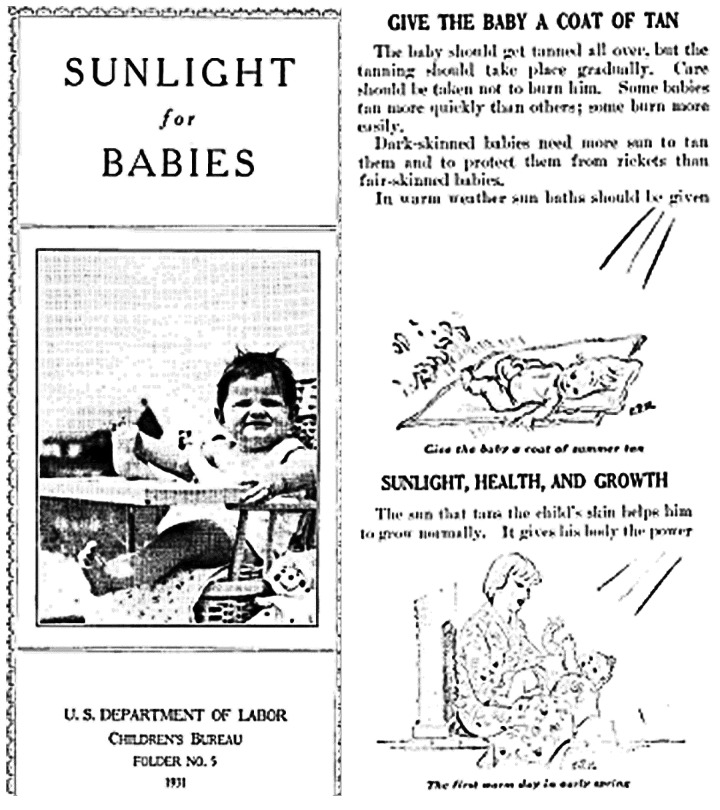
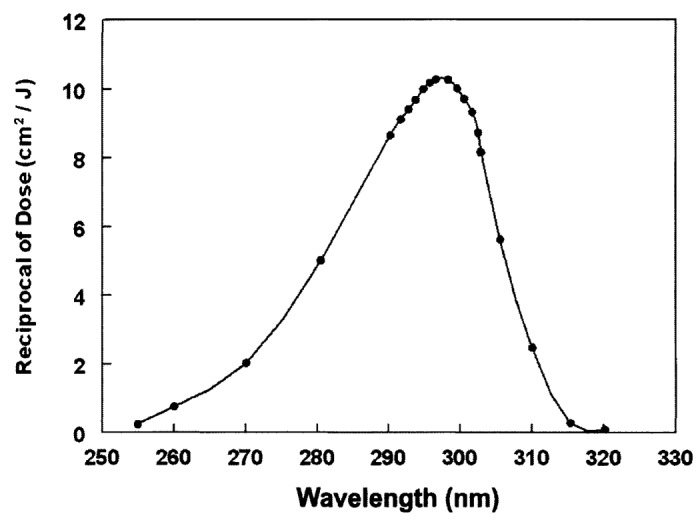
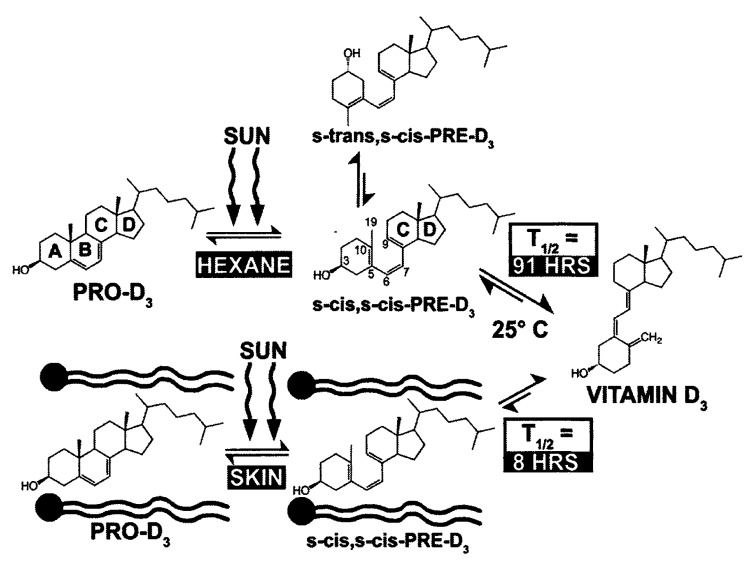
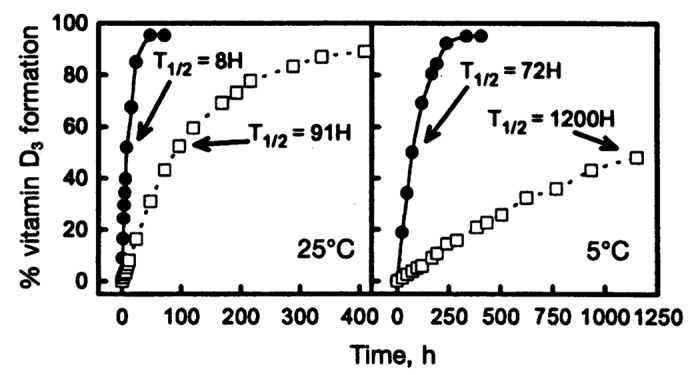
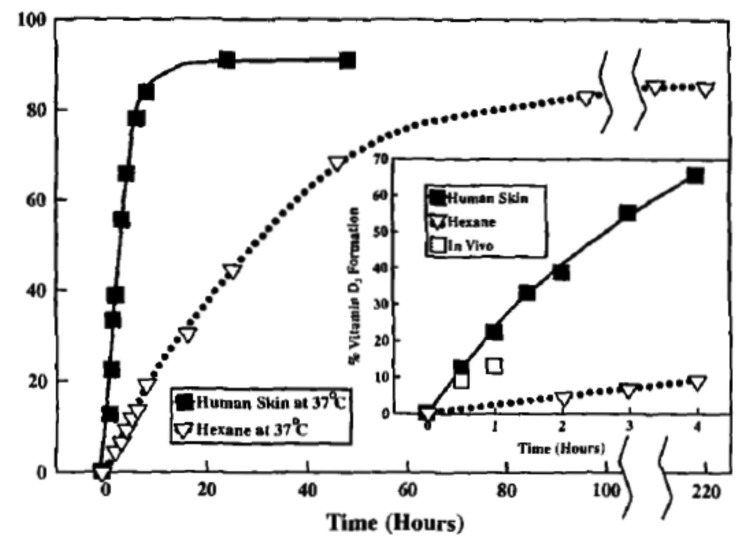
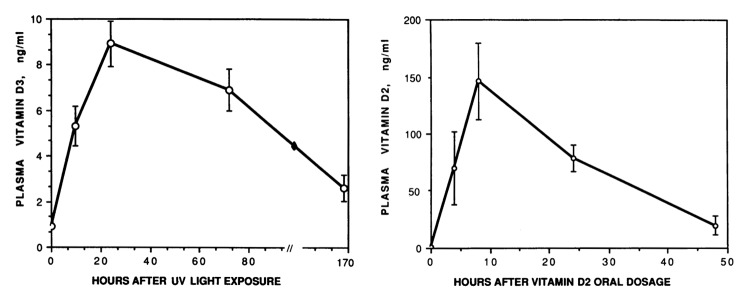
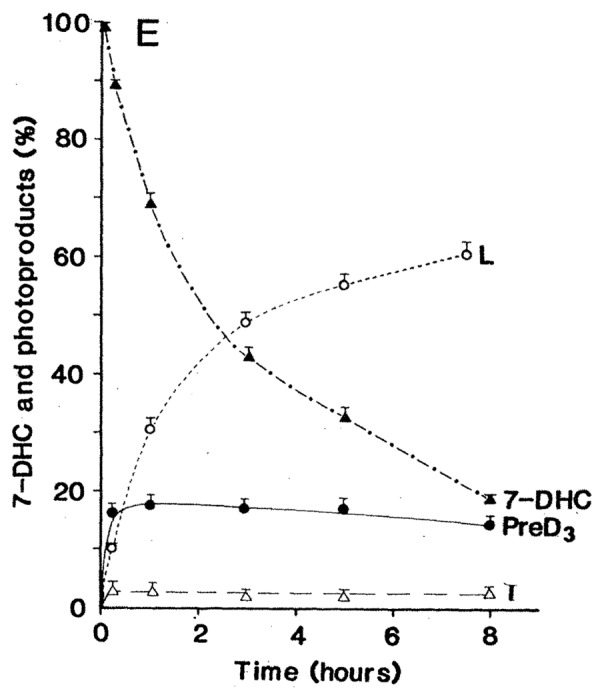
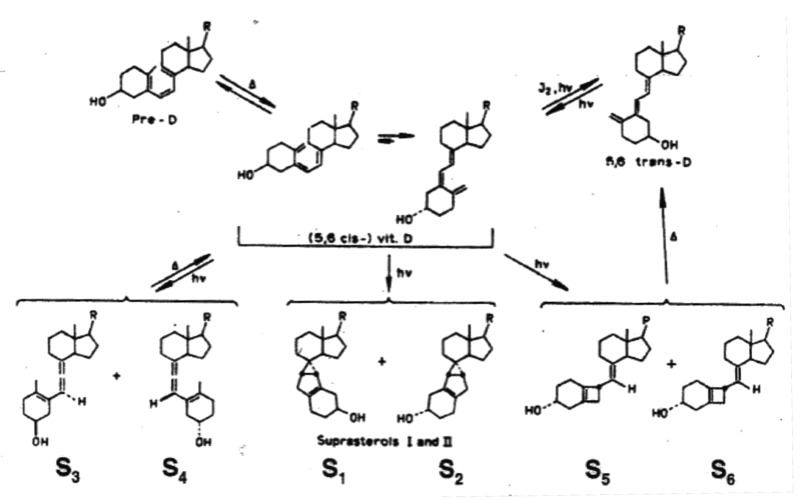
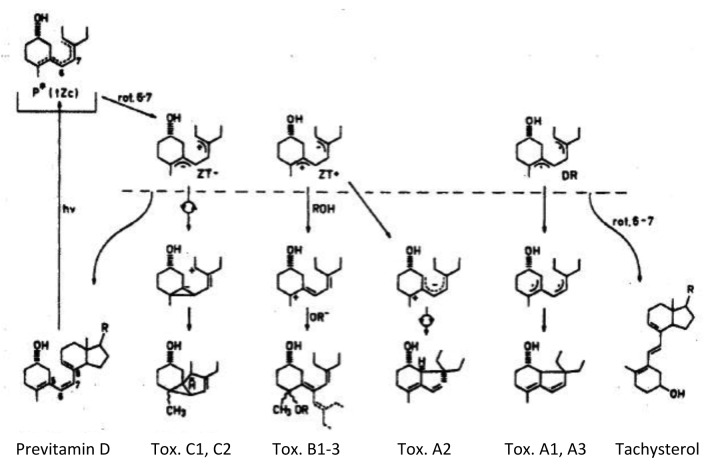
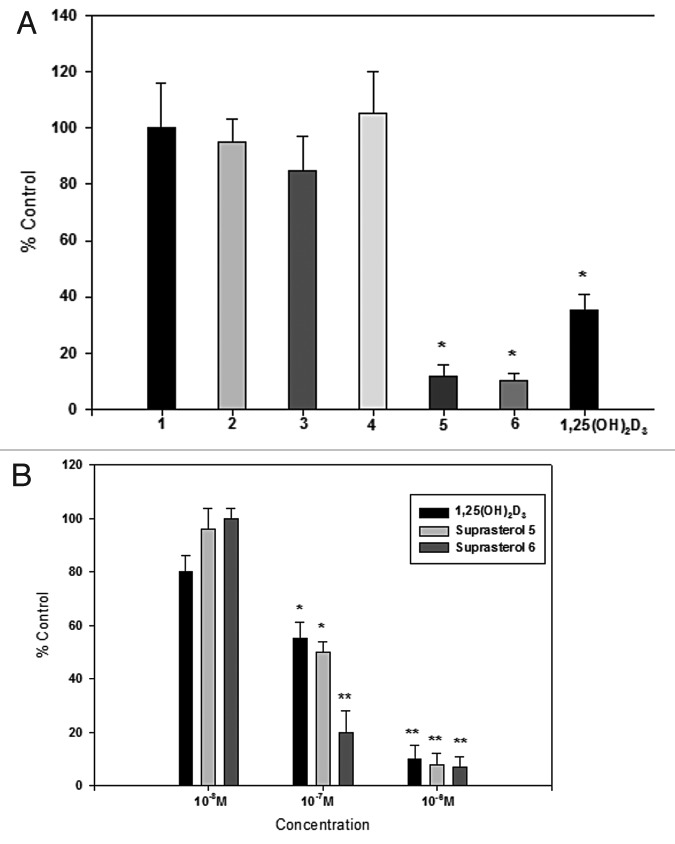
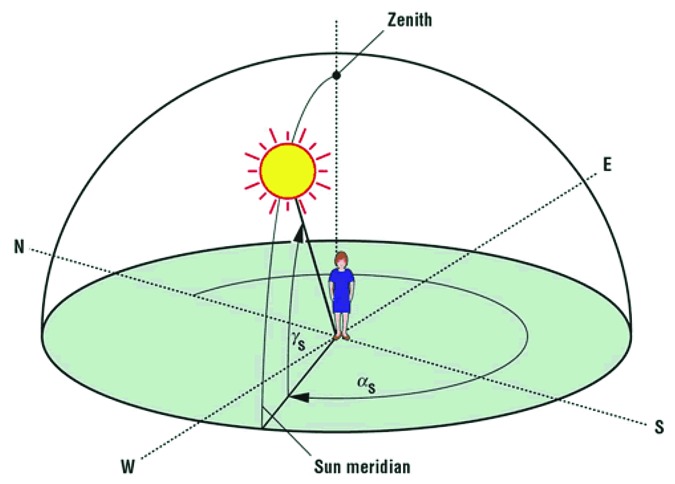
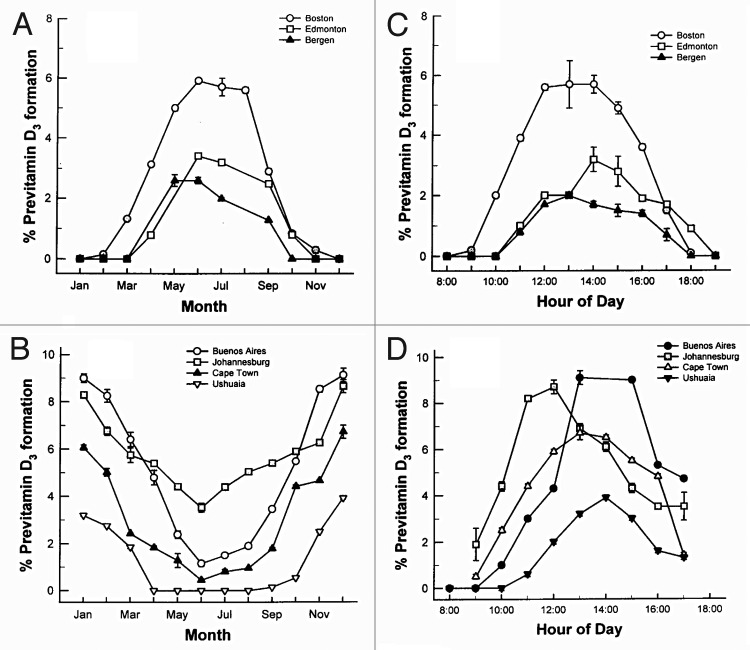
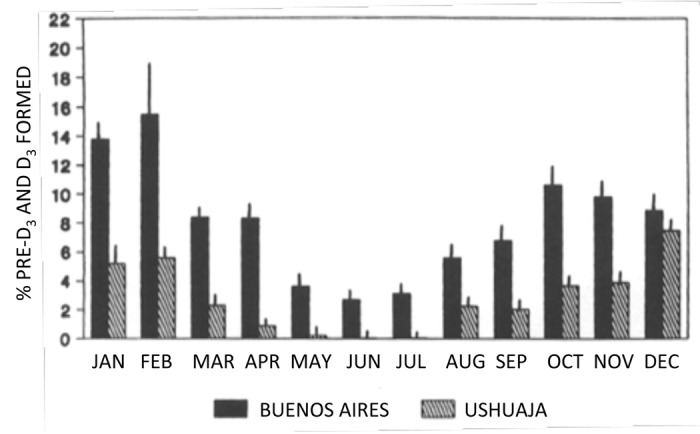
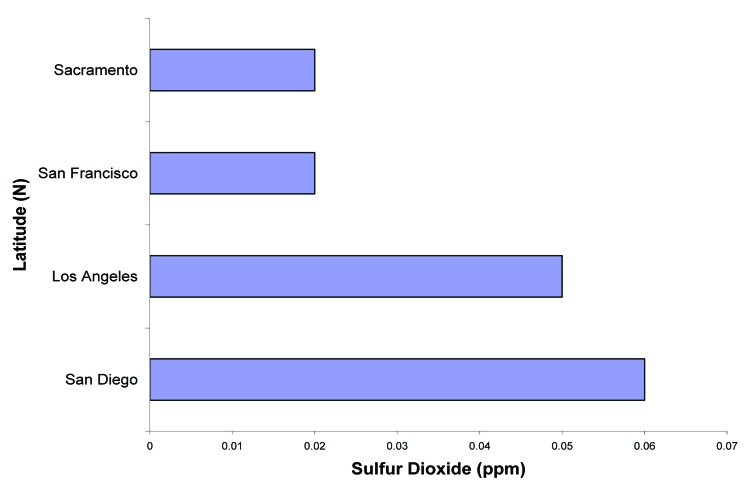
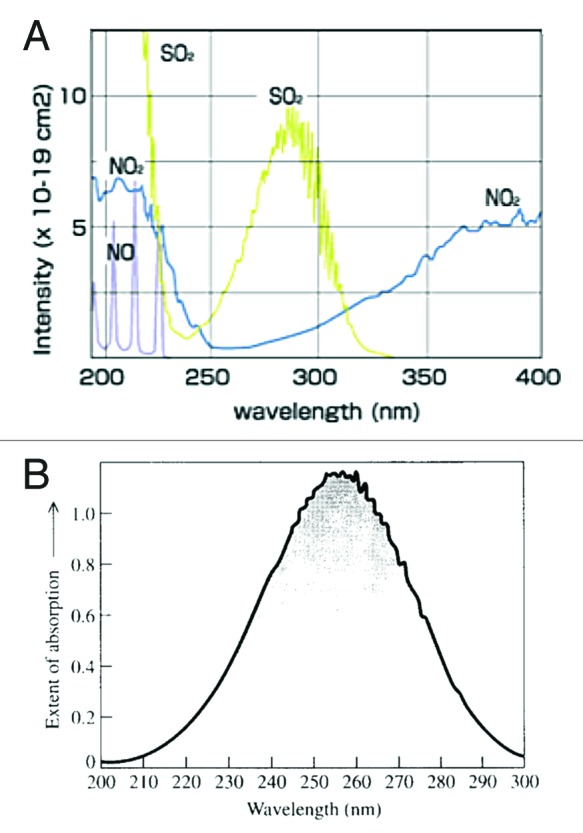
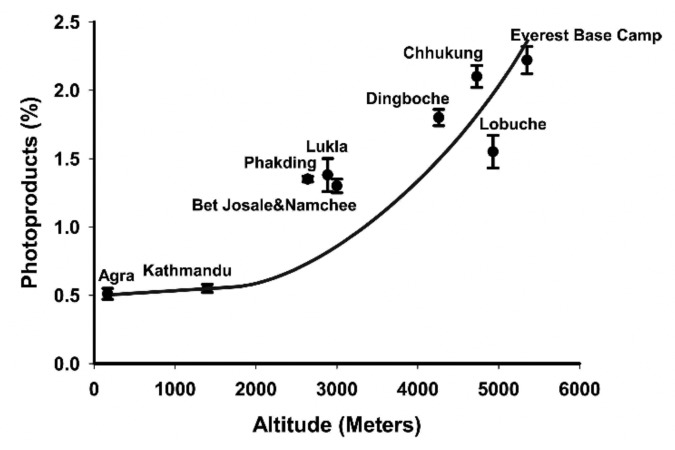
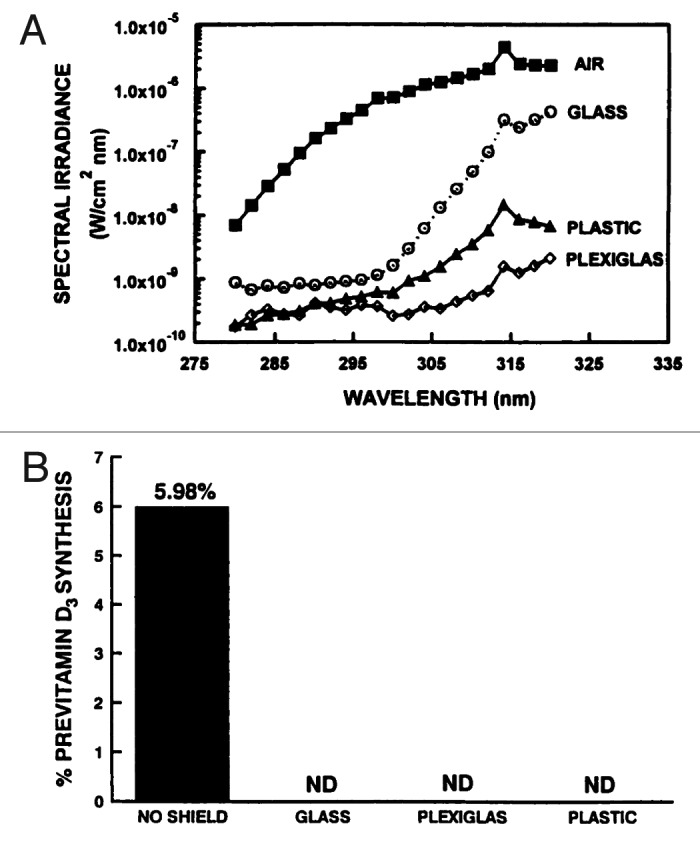
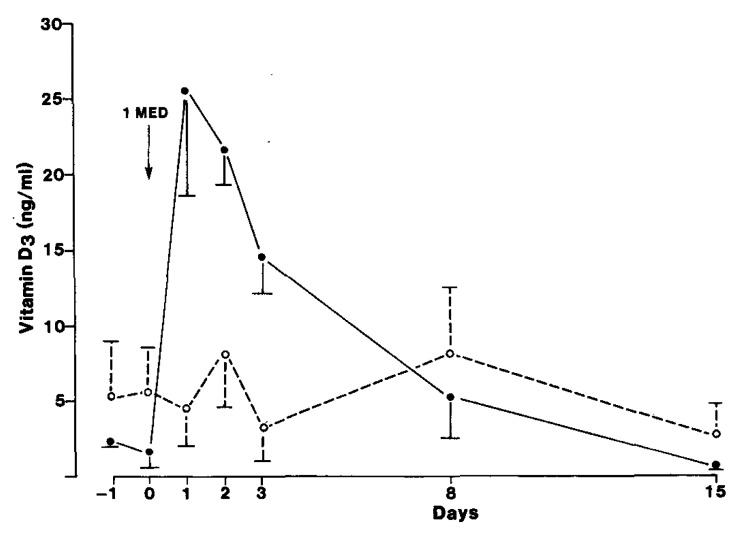
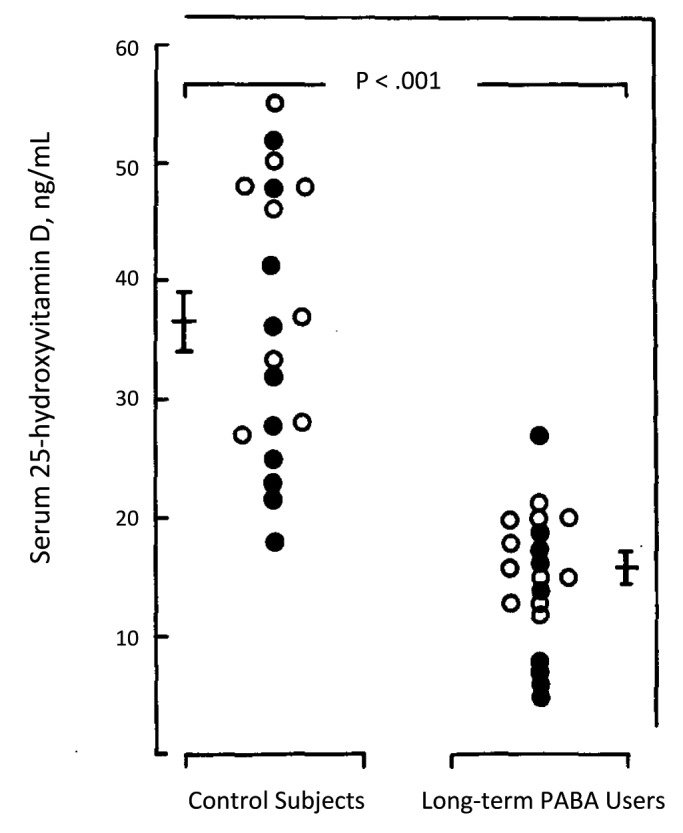
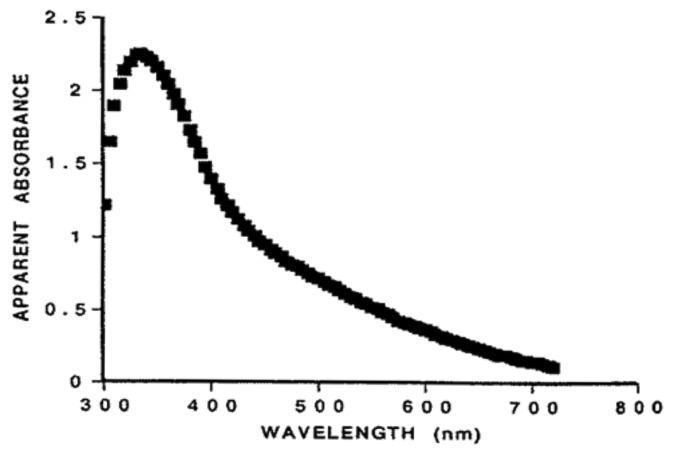
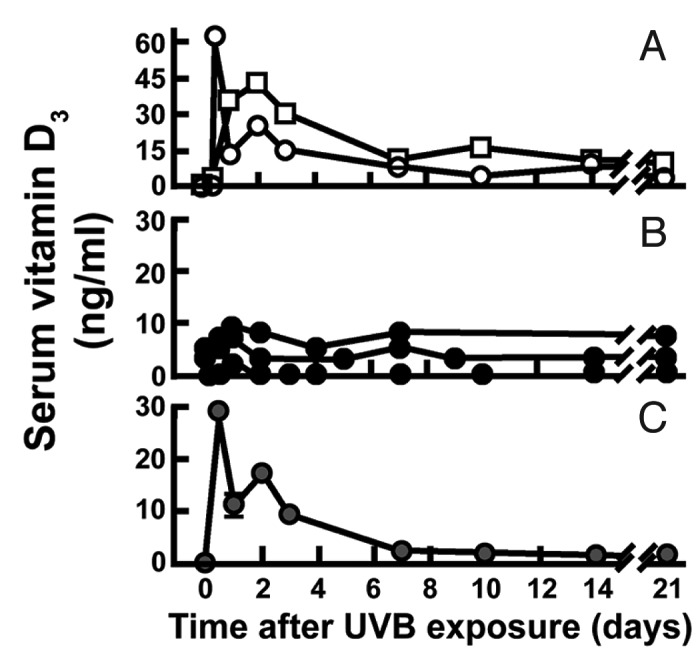
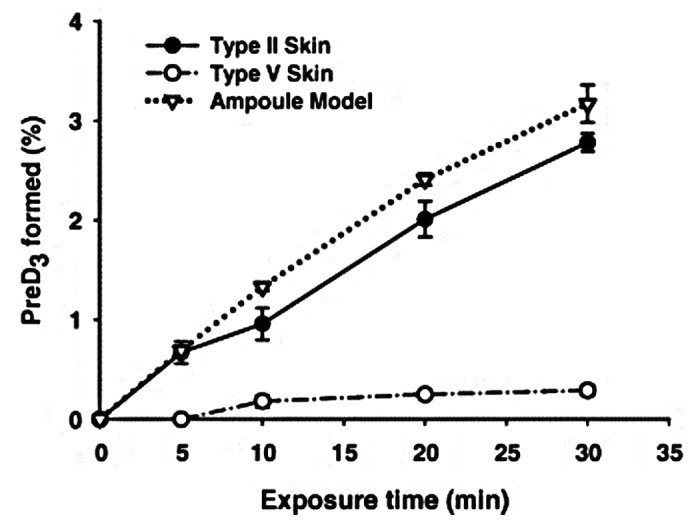
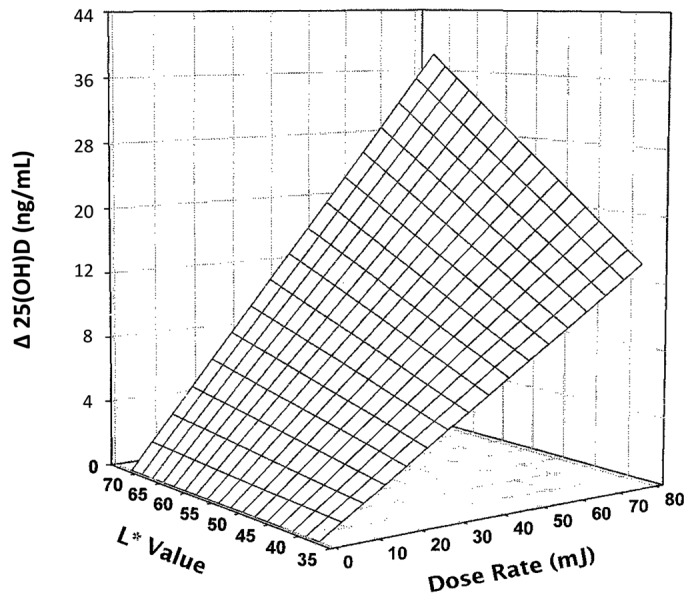
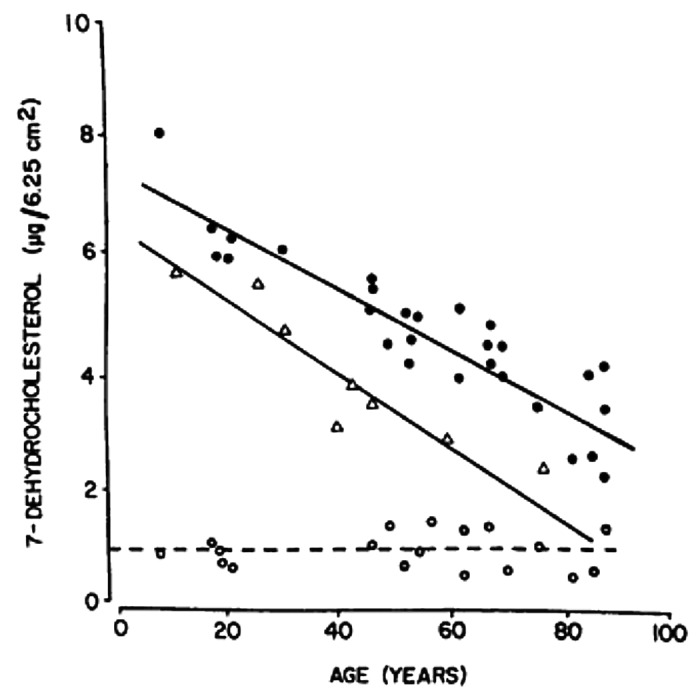
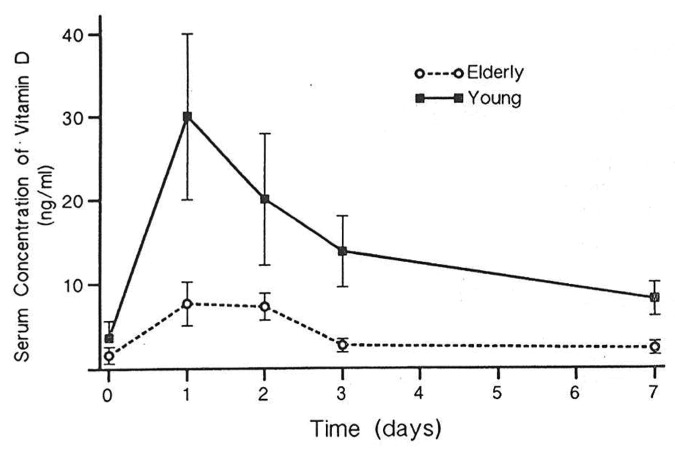
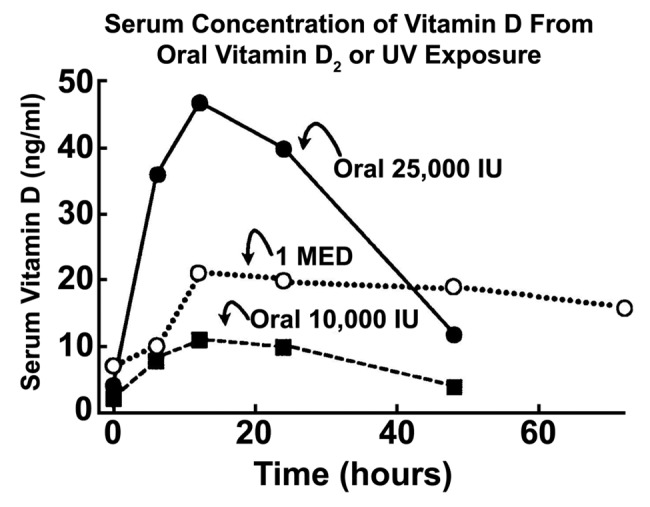
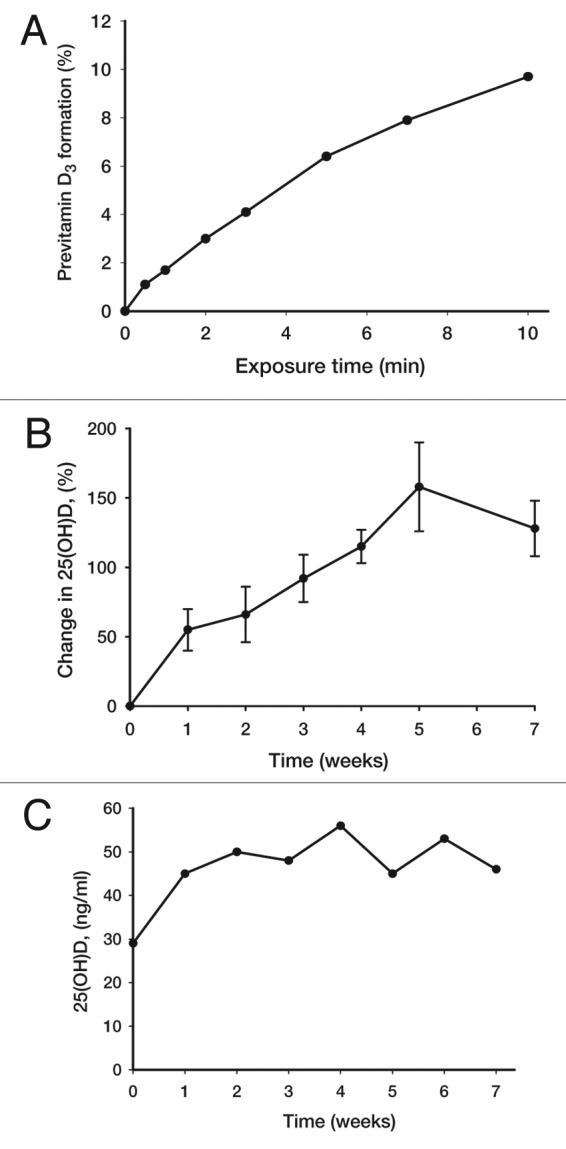
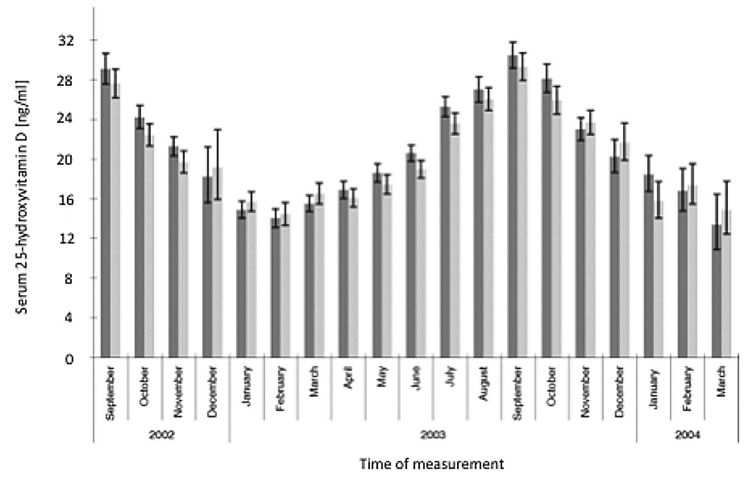
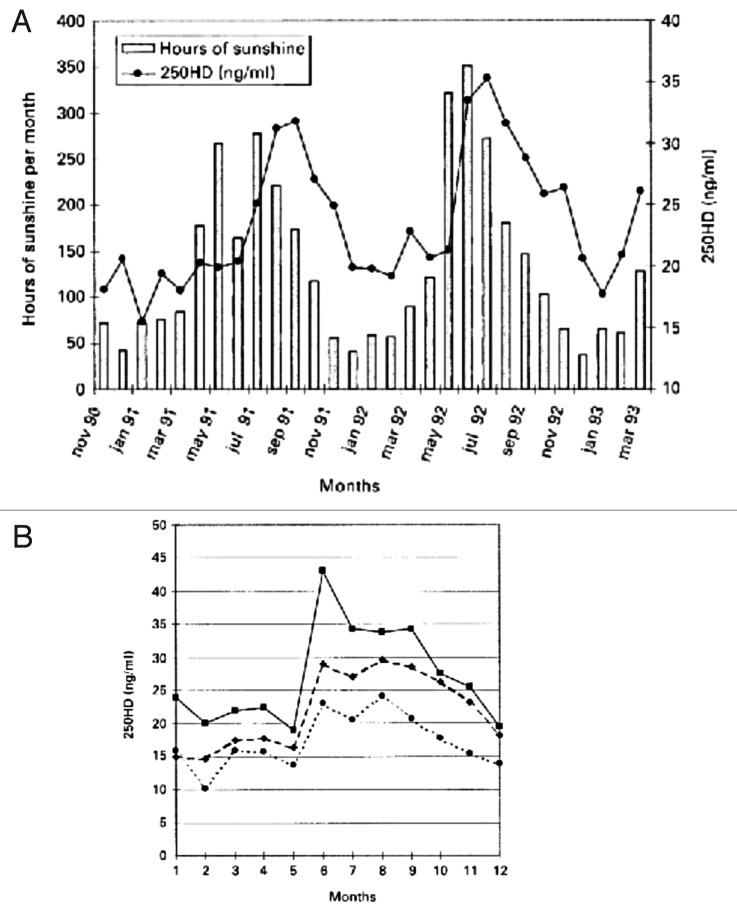
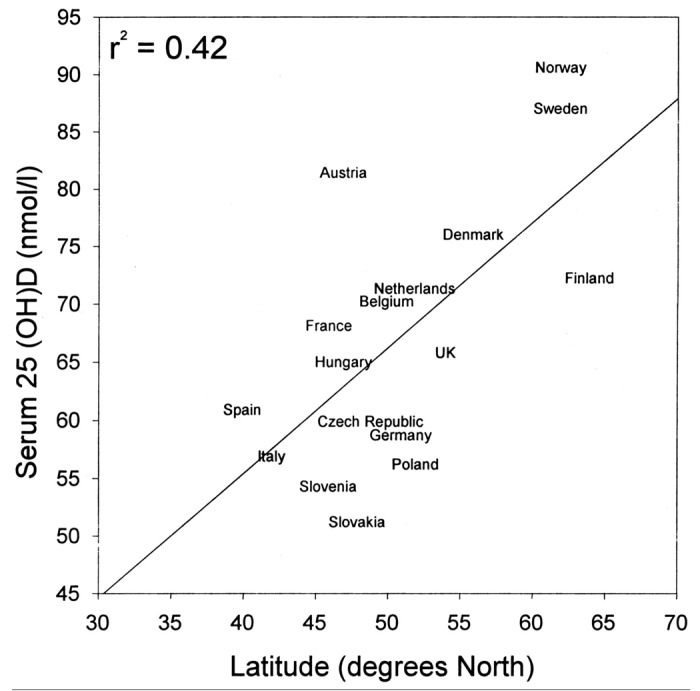
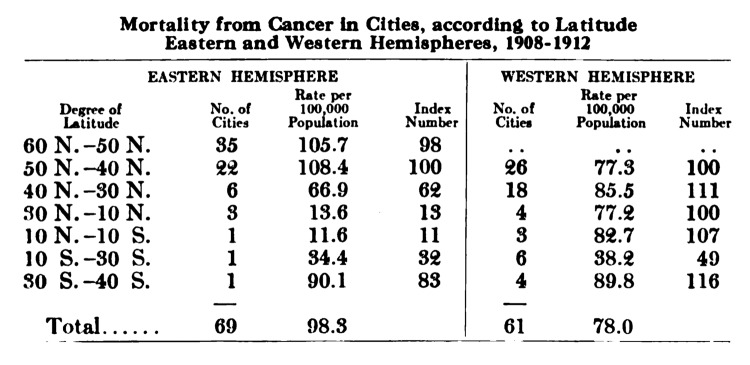
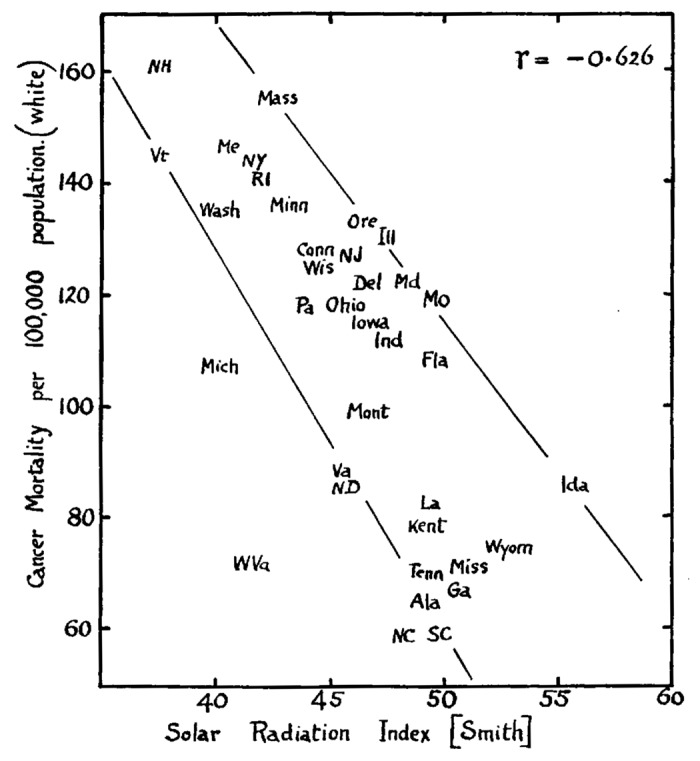
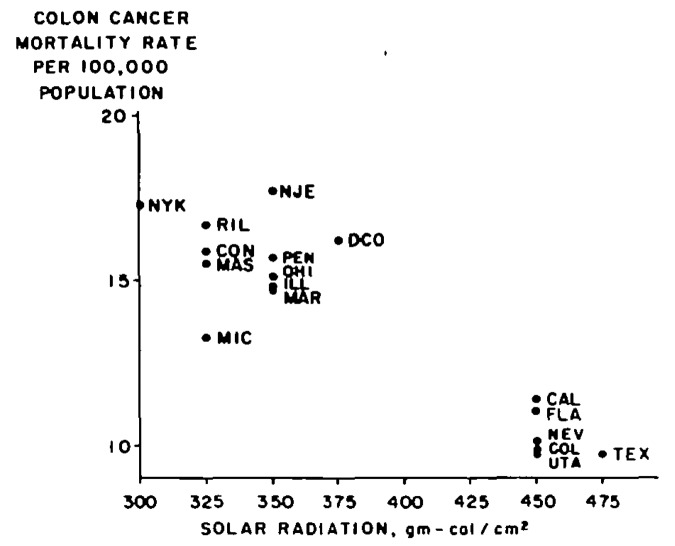
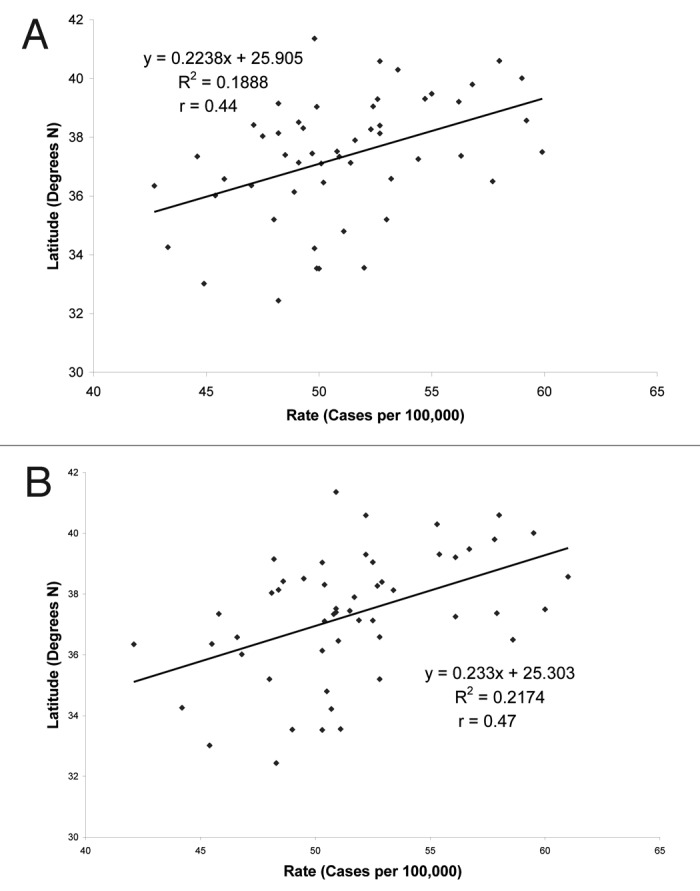
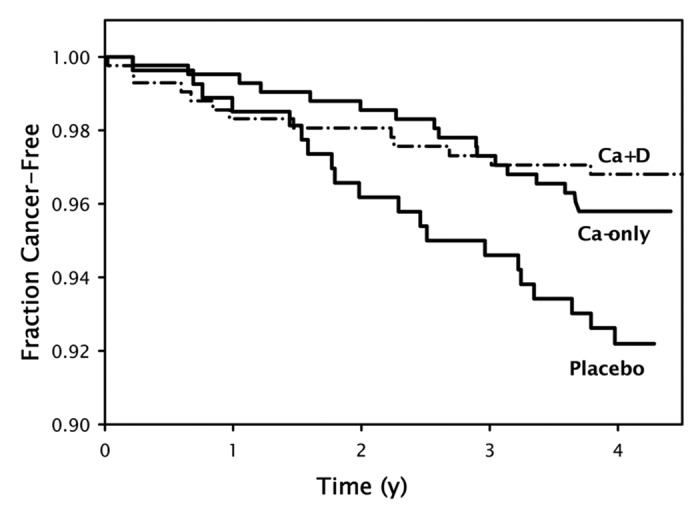
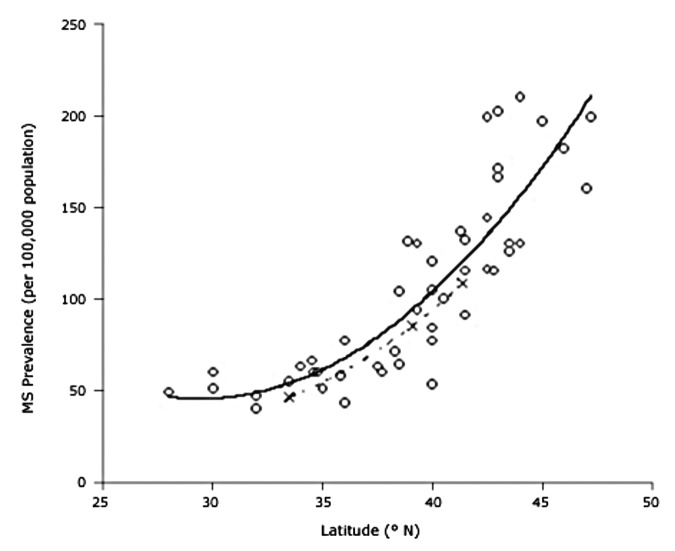
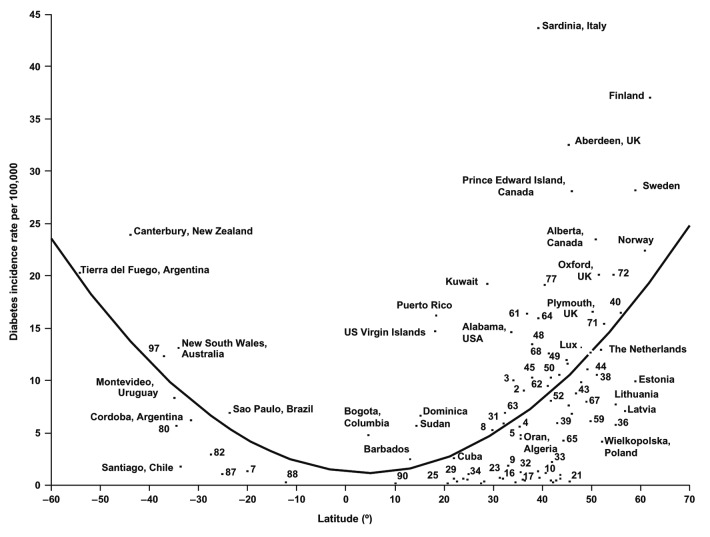
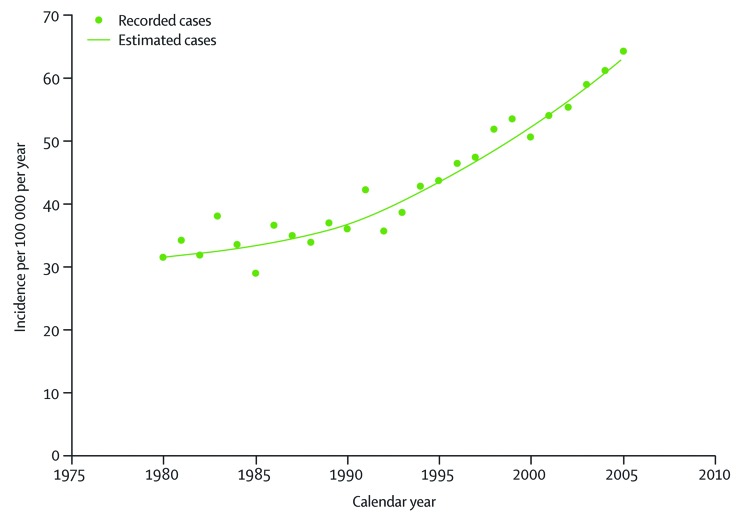
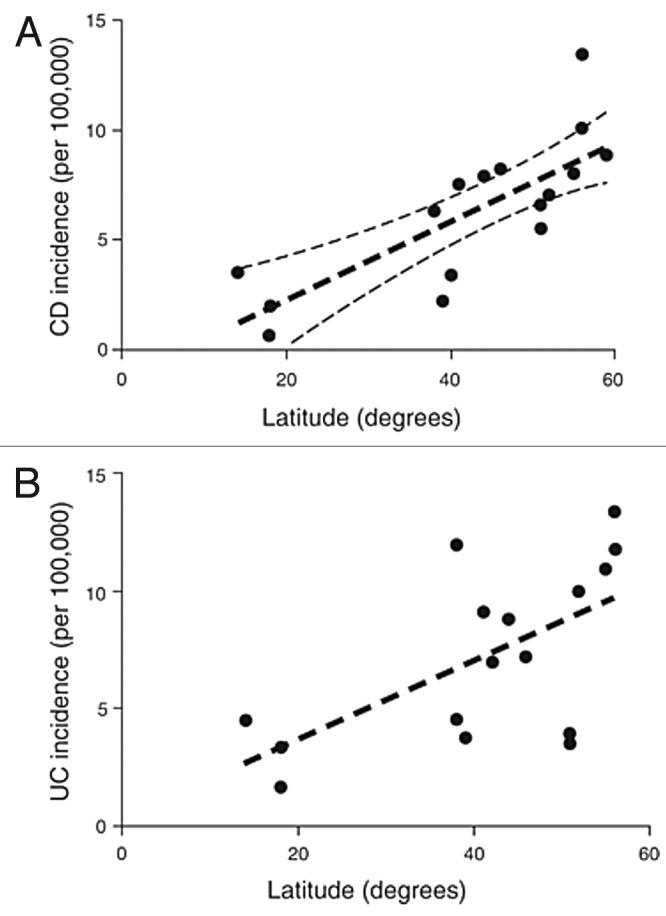
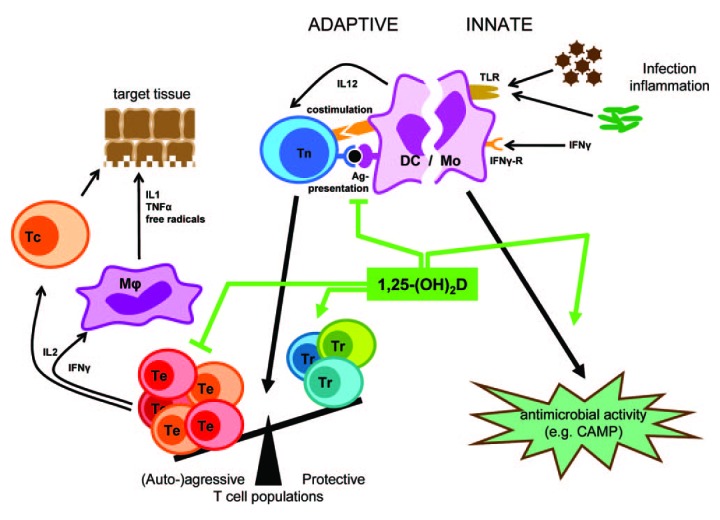
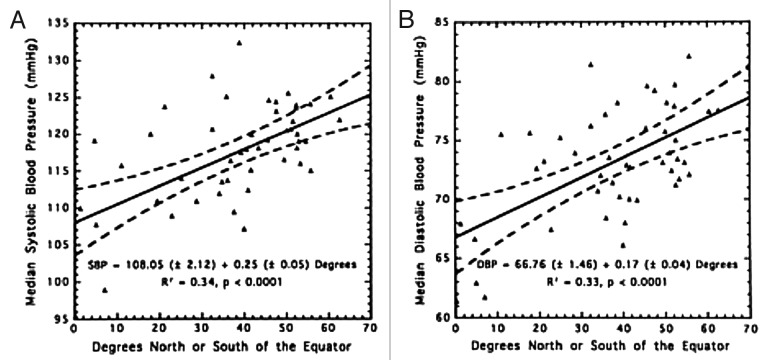
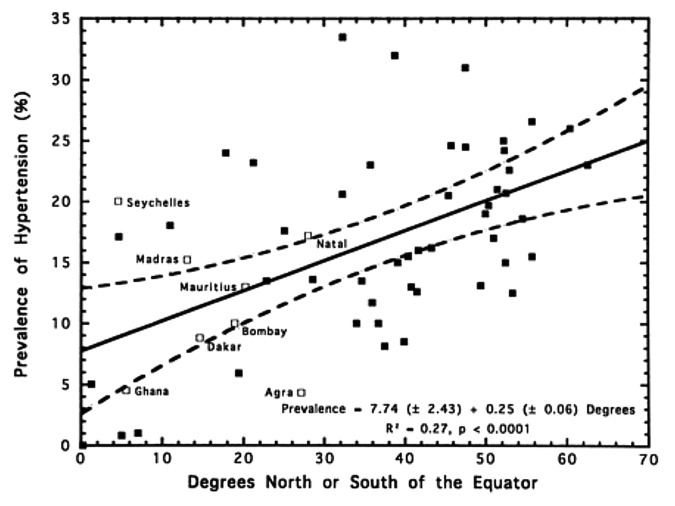
Vitamin D is the sunshine vitamin that has been produced on this earth for more than 500 million years. During exposure to sunlight 7-dehydrocholesterol in the skin absorbs UV B radiation and is converted to previtamin D3 which in turn isomerizes into vitamin D3. Previtamin D3 and vitamin D3 also absorb UV B radiation and are converted into a variety of photoproducts some of which have unique biologic properties. Sun induced vitamin D synthesis is greatly influenced by season, time of day, latitude, altitude, air pollution, skin pigmentation, sunscreen use, passing through glass and plastic, and aging. Vitamin D is metabolized sequentially in the liver and kidneys into 25-hydroxyvitamin D which is a major circulating form and 1,25-dihydroxyvitamin D which is the biologically active form respectively. 1,25-dihydroxyvitamin D plays an important role in regulating calcium and phosphate metabolism for maintenance of metabolic functions and for skeletal health. Most cells and organs in the body have a vitamin D receptor and many cells and organs are able to produce 1,25-dihydroxyvitamin D. As a result 1,25-dihydroxyvitamin D influences a large number of biologic pathways which may help explain association studies relating vitamin D deficiency and living at higher latitudes with increased risk for many chronic diseases including autoimmune diseases, some cancers, cardiovascular disease, infectious disease, schizophrenia and type 2 diabetes. A three-part strategy of increasing food fortification programs with vitamin D, sensible sun exposure recommendations and encouraging ingestion of a vitamin D supplement when needed should be implemented to prevent global vitamin D deficiency and its negative health consequences.

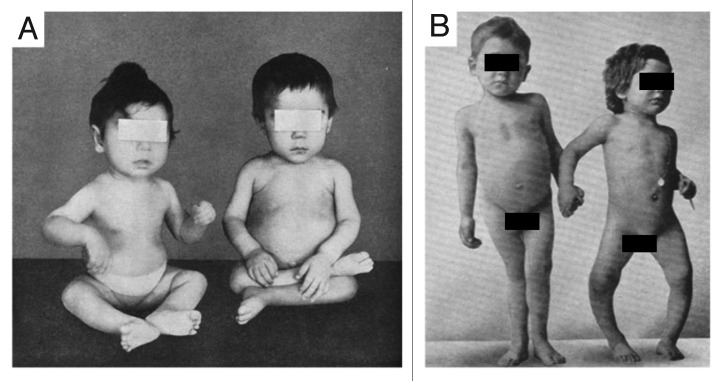
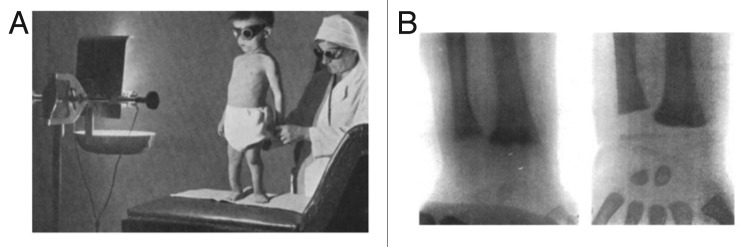
Keywords: 25-hydroxyvitamin D; UV lamp; UV radiation; UVB; autoimmune; cancer; latitude; rickets; sunlight; vitamin D.


Figures

None
Figure 1. Microscopic picture of Emiliana huxleyi, which is a cocolithophore i.e., has a calcium carbonate exoskeleton. Holick, copyright 2013. Reproduced with permission.
None
Figure 2. UV absorption spectra for (A) previtamin D3, (B) tachysterol, (C) provitamin D3 (7-dehydrocholesterol), (D) lumisterol, (E) DNA, and (F) albumin. Holick, copyright 2007. Reproduced with permission.
None
Figure 3. Photograph from Glasgow, Great Britain, in about 1870 showing that the buildings are built in close proximity to each other. Holick, copyright 1994. Reproduced with permission.
None
Figure 4. Skeletal deformities observed in rickets. (A) Photograph from the 1930s of a sister (left) and brother (right), aged 10 mo and 2.5 y, respectively, showing enlargement of the ends of the bones at the wrist, carpopedal spasm, and a typical “Taylorwise” posture of rickets. (B) The same brother and sister 4 y later, with classic knock-knees and bow legs, growth retardation, and other skeletal deformities. Holick, copyright 2006. Reproduced with permission.
None
Figure 5. Photographs of researchers who made crucial contributions to vitamin D and rickets research. (A) Jędrzej Śniadecki, (B) Kurt Huldschinsky, (C) Alfred Hess, (D) Harry Steenbock. Holick, copyright 2013. Reproduced with permission.
None
Figure 6. UV radiation therapy for rickets. (A) Photograph from the 1920s of a child with rickets being exposed to UV radiation. (B) Radiographs demonstrating florid rickets of the hand and wrist (left) and the same wrist and hand taken after treatment with 1 h UV radiation 2 times a week for 8 weeks. Note mineralization of the carpal bones and epiphyseal plates (right). Holick, copyright 2006. Reproduced with permission.
None
Figure 7. (A) Seal of a milk bottle that denoted that the milk was irradiated with UV radiation and contained vitamin D. (B) Cap of a milk bottle stating that activated ergosterol has been added to the milk. (C) Cap of milk bottle stating that the milk had been fortified with vitamin D. (D) Seal of a bottle of milk that denoted that the milk had been irradiated and contained vitamin D. Holick, copyright 2013. Reproduced with permission.
None
Figure 8. Brochure of the US. Department of Labor promoting sensible sun exposure in children in 1931.
None
Figure 9. (A) Seal denoting that this product was fortified with vitamin D. (B) Bottle of oil denoting that it contained irradiated ergosterol. (C) Beer can denoting that it was fortified with vitamin D. (D) Advertisement denoting that Bird’s custard contained vitamin D. Holick, copyright 2013. Reproduced with permission.
None
Figure 10. Action spectrum for the conversion of 7-dehydrocholesterol to previtamin D3 in human skin. Holick, copyright 2007. Reproduced with permission.
None
Figure 11. Photolysis of provitamin D3 (pro-D3. 7-dehydrocholesterol) into previtamin D3 (pre-D3) and its thermal isomerization to vitamin D3 in hexane and in lizard skin at 25°C. In hexane pro-D3 is photolyzed to s-cis,s-cis-pre-D3. Once formed, this energetically unstable conformation undergoes a conformational change to the s-trans,s-cis-pre-D3. Only the s-cis,s-cis-pre-D3 can undergo thermal isomerization to vitamin D3. The s-cis,s-cis conformer of pre-D3 is stabilized in the phospholipid bilayer by hydrophilic interactions between the 3β-hydroxl group and the polar head of the lipids, as well as by the van der Waals interactions between the steroid ring and side-chain structure and the hydrophobic tail of the lipids. These interactions significantly decrease the conversion of the s-cis,s-cis conformer to the s-trans,s-cis conformer, thereby facilitating the thermal isomerization of s-cis,s-cis-pre-D3 to vitamin D3. Holick, copyright 1995. Reproduced with permission.
None
Figure 12. Thermal isomerization of previtamin D3 to vitamin D3 as a function of time in lizard skin (●) and in hexane (☐) at 25°C (left) and 5°C (right). Each point represents the mean value from three separate analyses. Holick, copyright 1995. Reproduced with permission.
None
Figure 13. Thermoconversion of pre-D3 to vitamin D3 as a function of time in human skin and in n-hexane at 37°C. The inset depicts the thermoconversion of pre-D3 to vitamin D3 in human skin in vivo (☐) and compares them with those in n-hexane (▽) and in human skin in vitro (ν) at 37°C. Reproduced with permission from.
None
Figure 14. Proposed theoretical structural model for the localization of the cZc-previtamin D3 in the phospholipids of a membrane. Based on the amphipathic nature and conformational mobility of previtamin D3, we proposed the following model to show the spatial relationship between previtamin D3 and phospholipids. We postulated that in the membrane, the cholesterol like cZc-previtamin D3 is aligned parallel to its neighboring phospholipids, with its polar 3β-hydroxy interacting with the polar head groups of the phospholipids through hydrogen bonding, and the hydrophobic rings and side chain interacting with the nonpolar acyl chains of the lipids through hydrophobic and van der Waals interactions. A, phosphatidylcholine; B, cZc-previtamin D3. Reproduced with permission from.
None
Figure 15. Effects of phospholipid carbon chain length and saturation on the rate of pre-D3 to vitamin D3 isomerization in liposomes. k, rate constant; n, carbon number of phospholipid chain. Reproduced with permission from.
None
Figure 16. Plasma vitamin D3 or vitamin D2 after UV light exposure or vitamin D2 oral dosage. Reproduced with permission from.
None
Figure 17. A schematic representation of the photochemical and thermal events that result in the synthesis of vitamin D3 in the skin, and the photodegradation of previtamin D3 and vitamin D3 to biologically inert photoproducts. 7-dehydrocholesterol (7-DHC) in the skin is converted to previtamin D3 by the action of solar UV B radiation. Once formed, previtamin D3 is transformed into vitamin D3 by a heat-dependent (ΔH) process. Vitamin D3 exits the skin into the dermal capillary blood system and is bound to a specific vitamin D-binding protein (DBP). When previtamin D3 and vitamin D3 are exposed to solar UV B radiation, they are converted to a variety of photoproducts that have little or no activity on calcium metabolism. Holick, copyright 1995. Reproduced with permission.
None
Figure 18. An analysis of the photolysis of 7-dehydrocholesterol (7-DHC) in the basal-cell layer and the appearance of the photoproducts previtamin D3 (Pre-D3), lumisterol3 (L), and tachysterol3 (T) with increasing time of exposure to equatorial simulated solar UV radiation. Bars above data points show the standard error of the mean of three determinations. Holick, copyright 1981. Reproduced with permission.
None
Figure 19. When vitamin D3 is irradiated, it is converted to 5,6-trans-vitamin D3 and at least 6 photoproducts known as suprasterols. Holick, copyright 2013. Reproduced with permission.
None
Figure 20. Once previtamin D3 is formed, it has the ability to rotate around the 6–7 bond. Relaxation via rotation about the 6–7 bond followed by UV irradiation can give rise to a wide variety of toxisterols and tachysterol. Holick, copyright 2013. Reproduced with permission.
None
Figure 21. (A) Proliferation of human keratinocytes after incubation with different suprasterols compared with negative control (100%). Suprasterols 5 and 6 show a strong antiproliferative activity as well as the positive control 1,25(OH)2D3. (B) Dose dependent antiproliferative activity of suprasterols 5 and 6 compared with 1,25(OH)2D3 in keratinocytes. Mean ± SEM *p < 0.01, **p < 0.001 compared with control 100%. Holick, copyright 2013. Reproduced with permission.
None
Figure 22. The solar zenith angle is the angle made by the sun’s light with respect to the vertical (the sun being directly overhead). This angle is increased at higher latitudes, early morning and late afternoon when the sun is not directly overhead, and during the winter months. As the solar zenith angle increases, the amount of UVB radiation reaching the earth’s surface is reduced. Therefore, at higher latitudes, greater distance from the equator, more of the UVB radiation is absorbed by the ozone layer thereby reducing or eliminating the cutaneous production of vitamin D3. Holick, copyright 2006. Reproduced with permission.
None
Figure 23. Influence of season, time of day, and latitude on the synthesis of previtamin D3 in Northern (A and C) and southern hemispheres (B and D). The hour indicated in C and D is the end of the 1 h exposure time. Holick, copyright 1998. Reproduced with permission.
None
Figure 24. Photoproduction of previtamin D3 and vitamin D3 from 7-DHC throughout the year in Ushuaia, Argentinia (slashed bars, 55 degrees South) and Buenos Aires (closed bars, 34 degrees South). Values are percentages of initial 7-DHC. Each bar represents the mean ± SEM of three determinations of the sample ampules. Reproduced with permission from Ladizesky.
None
Figure 25. Conversion rate of 7-dehydrocholesterol (7-DHC) to vitamin D depending on time of the day and season in Boston (42° North). The measurements were conducted after exposing ampoules filled with 7-DHC to sunlight. Holick, copyright 2013, reproduced with permission.
None
Figure 26. The amount of sulfur dioxide (ppm) measured over a one hour period in San Diego, Los Angeles, San Francisco, and Sacramento on the same day. Reproduced with permission from.
None
Figure 27. (A) Absorption spectra for NO, NO2, and SO2. The absorption spectra show that SO2 and NO2 absorb UVB radiation (280–315 nm) required for cutaneous production of vitamin D. (B) Absorption spectrum of ozone which also absorbs UVB radiation. Reproduced with permission from.
None
Figure 28. Ampoules containing 7-dehydrocholesterol in ethanol were exposed for 1 h between 11:30 a.m. and 12:30 p.m. at 27° North in India at various altitudes. The conversion of 7-dehydrocholesterol to previtamin D3 and its photoproducts was determined by HPLC. Reproduced with permission from.
None
Figure 29. (A) Transmission of UV radiation through air, glass, plastic, and Plexiglas (Dupont Chemical Company, Memphis TN). Holick, copyright 2003. (B) Prevention of previtamin D3 formation as a result of glass, plastic, or plexiglass (Dupont Chemical Company, Memphis, TN) placed between the simulated-sunlight source and the provitamin D3 (7-DHC). Reproduced with permission from.
None
Figure 30. Mean (± SEM) serum vitamin D3 concentrations in eight normal subjects. Four subjects (o) applied PABA (para-aminobenzoic acid) with a SPF of 8 and four applied vehicle (●) to the entire skin before exposure to UVB. On day 0, all subjects underwent total body exposure to 1 MED (minimal erythema dose) UVR (UV radiation). To convert nanograms of vitamin D per mL to nanomoles per L, multiply by 2.599. Reproduced with permission from.
None
Figure 31. Serum concentration of 25-hydroxyvitamin D in longterm sunscreen users and in age- and sex-matched controls from same geographical area. Blood samples were obtained simultaneously from patients and controls. Mean serum 25-hydroxyvitamin D level was significantly lower in long-term sunscreen users (p < 0.001). Two long-term sunscreen users had absolute vitamin D deficiency, 25-hydroxyvitamin D level below 20 nmol/L. PABA indicates p-aminobenzoic acid; open circles, subjects from Philadelphia; closed circles, subjects from Springfield, III. Reproduced with permission from.
None
Figure 32. Absorption spectrum of melanin. Reproduced with permission from.
None
Figure 33. In two lightly pigmented Caucasian (A) and three heavily pigmented Afroamerican subjects (B) after total body exposure to 0.054 J/cm2 of UVR. (C) Serial change in circulating vitamin D after re-exposure of on Afroamerican subject (● in panel B) to a 0.32 J/cm2 dose of UVR. Reproduced with permission from.
None
Figure 34. The conversion of 7-dehydrocholesterol to previtamin D3 in an ampoule model, Type II and Type V skin after exposing to noon sunlight in June at Boston (42°N), Massachusetts. The data represent the means ± SEM of duplicate determinations. Reproduced with permission from.
None
Figure 35. Scatter plot of baseline serum 25-hydroxyvitamin D (25-OH-D) on skin lightness (L∗) score for unexposed skin, showing significant positive correlation of serum 25-OH-D and L∗ (r2 = 0.1856). Heaney, copyright 2006. Reproduced with permission.
None
Figure 36. Three-dimensional scatter plot of 4-week serum 25-hydroxyvitamin D response change above baseline expressed as function both of basic skin lightness (L∗) and UV-B dose rate. Surface is a hyperboloid, plotting equation and was fitted to data by least squares regression methods. Heaney, copyright 2006. Reproduced with permission.
None
Figure 37. Maasi men demonstrate their muscle strength who have been reported to have 25(OH)D ~46 ng/ml. Holick, copyright 2013, reproduced with permission.
None
Figure 38. Concentrations of 7-dehydrocholesterol (provitamin D3) per unit area of human epidermis (●), stratum basale (∆) and dermis (○) obtained from surgical speciments from donors of various ages. A linear regression analysis revealed slopes of -0.05, -0.06, and -0.0005 for the epidermis (r = -0.89), stratum basale (r = -0.92), and dermis (r = -0.04), respectively. The slopes of the epidermis and stratum basale are significantly different from the slope of the dermis (p < 0.001). Reproduced with permission from.
None
Figure 39. Circulating concentrations of vitamin D in healthy young and elderly volunteers exposed to UV radiation. Reproduced with permission from.
None
Figure 40. Comparison of serum vitamin D3 levels after a whole-body exposure (in a bathing suit; bikini for women) to 1 MED (minimal erythemal dose) of simulated sunlight compared with a single oral dose of either 10,000 or 25,000 IU of vitamin D2. Holick, copyright 2004. Reproduced with permission from.
None
Figure 41. Production of previtamin D3 and serum level of 25(OH)D after the exposure of 7-DHC solution in ampoules and human volunteers to a tanning bed lamp. (A) Ampoules containing 7-DHC were placed and exposed to a tanning bed lamp. At various times, an ampoule was removed and the conversion of 7-DHC to previtamin D3 was measured by HPLC. (B) Healthy young adults were exposed to 0.75 MED in a tanning bed three times a week for 7 weeks. Circulating concentrations of 25(OH)D were determined at baseline and once a week thereafter. (C) A healthy 76-y-old man was exposed to tanning bed radiation equivalent to 0.75 MED three times a week for 7 weeks. His circulating concentrations of 25(OH)D were obtained at weekly intervals. Holick copyright 2007, reproduced with permission from.
None
Figure 42. The UVB lamps and residents in a day room of a nursing home. Reproduced with permission from.
None
Figure 43. Mean (± 1 sd) 25(OH) vitamin D values pre-irradiation, 12–24 weeks and 56–72 weeks after irradiation in 7 subjects with abnormal baseline values (< 25 nmol/l). Reproduced with permission from.
None
Figure 44. Geometric mean (95% CI) monthly variation in serum 25-hydroxyvitamin D [25(OH)D] concentrations in men (■; n = 3725) and women (□; n = 3712) in the 1958 British birth cohort at age 45 y. The interaction between sex and month was significant [p = 0.02, linear regression analyses on log 25(OH)D]. n per sex and month ranged from 17 to 340: 98 in December 2003 for women and < 100 for both sexes in December 2002 (n = 40 M, 37 F), January 2004 (n = 95 M, 75 F), February 2004 (n = 58 M, 70 F), and March 2004 (n = 22 M, 17 F). Reproduced with permission from.
None
Figure 45. (A) Seasonal fluctuation of serum 25(OH)D in healthy perimenopausal Danish women and relationship between hours of sunshine and serum 25(OH)D. (B) Seasonal fluctuation of serum 25(OH)D according to frequency of sun exposure. ■, regular sun exposure; ◆, occasional sun exposure; ●, avoiding direct sun exposure. Reproduced with permission from.
None
Figure 46. Mean circulating 25-hydroxyvitamin D levels in children, adolescents, and adults according to geographic latitude. Reproduced with permission from.
None
Figure 47. Relationship between the serum 25OHD concentration and northern latitude in Europe. The relationship was very significant (p < 0.001). Reproduced with permission from.
None
Figure 48. Niels Ryberg Finsen, * December 15, 1860, Thorshavn, Faroe Islands; + 24 September 1904; Nobel Prize was awarded “in recognition of his contribution to the treatment of diseases, especially lupus vulgaris, with concentrated light radiation, whereby he has opened a new avenue for medical science.” Reproduced with permission from.
None
Figure 49. (A) 1901 Illustration from Scientific American showing phototherapy with the Finsen carbon-arc UV lamp Reproduced with permission from. (B) Sunbathing individuals at sanatorium Leysin in Switzerland. Reproduced with permission from.
None
Figure 50. Mortality from cancer in cities according to latitude, 1908–1912. Reproduced with permission from.
None
Figure 51. Showing the relation of total cancer mortality rates to Smith's Solar Radiation Index in the American states, (white population only). Reproduced with permission from.
None
Figure 52. Annual mean daily solar radiation (gm-cal/cm1) and annual age-adjusted colon cancer death rates per 100 000 population, white males, 17 metropolitan states. United States, 1959–61. Reproduced with permission from.
None
Figure 53. (A) Latitude vs. number of individuals diagnosed with colon cancer in California, independent of race. (B) Latitude vs. the number of Caucasian individuals diagnosed with colon cancer in the state of California. Reproduced with permission from.
None
Figure 54. (A) Premature mortality due to cancer with insufficient UVB in white males, US, 1970–1994, vs. July 1992 DNA-weighed UVB radiation. (B) Premature mortality due to cancer, white females, vs. TOMS July 1992 DNA-weighed UVB. Reproduced with permission from.
None
Figure 55. Relative risk of cancer incidence and mortality related to solar UV-B exposure, northern vs. southern United States boundary, non-Hispanic whites (95% CI in parentheses): Cancer sites with strongest evidence of an inverse association with solar UV-B exposure 86.
None
Figure 56. Multivariable relative risks and 95% confidence intervals for an increment of 25 nmol/L in predicted plasma 25-hydroxy-vitamin D level for individual cancers in the Health Professionals Follow-up Study (1986–2000). Number in parentheses = number of cases. Covariables included in the Cox proportional hazards model: age, height, smoking history, and intakes of total calories, alcohol, red meat, calcium, retinol, and total fruits and vegetables. Reproduced with permission from.
None
Figure 57. Kaplan-Meier plot showing association of UVR exposure and age at diagnosis with prostate cancer. Reproduced with permission from.
None
Figure 58. Effect of cholecalciferol on rate of rise of PSA. Median and quartiles of rate of PSA increase prior to starting cholecalciferol (visits –4 to –2 and visits –2 to 0) and after starting cholecalciferol (visits 0 onward). Reproduced with permission from.
None
Figure 59. Kaplan-Meier survival curves (i.e., free of cancer) for the 3 treatment groups randomly assigned in the entire cohort of 1179 women. Sample sizes are 288 for the placebo group, 445 for the calcium-only (Ca-only) group, and 446 for the calcium plus vitamin D (Ca + D) group. The survival at the end of study for the Ca + D group is significantly higher than that for placebo, by logistic regression. Copyright Robert P. Heaney, 2006. Reproduced with permission.
None
Figure 60. The seasonal and latitudinal distribution of outbreaks of type A influenza in the world, 1964–1975, summarized from the Weekly Epidemiological Record of the World Health Organization into major zones. The diagrams show for each calendar month the percentage of each zone's total outbreaks. In both north and south temperate zones the epidemics are distributed around the local midwinter, whereas the tropical zones show a transition, each approximating toward the distribution of its own temperate zone. The curve indicates the ‘midsummer’ path taken annually by vertical solar radiation. The ‘epidemic path’ seems to parallel it, but to lag 6 mo behind it. Reproduced with permission from.
None
Figure 61. Metabolism of 25-hydroxyvitamin D [25(OH)D] to 1,25-dihydroxyvitamin D 1,25(OH)2D for non-skeletal functions. When a monocyte/macrophage is stimulated through its toll-like receptor 2/1 (TLR2/1) by an infective agent such as Mycobacterium tuberculosis (TB), or its lipopolysaccharide (LPS) the signal upregulates the expression of vitamin D receptor (VDR) and the 25-hydroxyvitamin D-1-hydroxylase (1-OHase). 25(OH)D levels > 30 ng/mL provides adequate substrate for the 1-OHase to convert it to 1,25(OH)2D. 1,25(OH)2D returns to the nucleus where it increases the expression of cathelicidin which is a peptide capable of promoting innate immunity and inducing the destruction of infective agents such as TB. It is also likely that the 1,25(OH)2D produced in the monocytes/macrophage is released to act locally on activated T (AT) and activated B (AB) lymphocytes which regulate cytokine and immunoglobulin synthesis respectively. When 25(OH)D levels are ~30 ng/mL, it reduces risk of many common cancers.- It is believed that the local production of 1,25(OH)2D in the breast, colon, prostate, and other cells regulates a variety of genes that control proliferation. Once 1,25(OH)2D completes the task of maintaining normal cellular proliferation and differentiation, it induces the 25-hydroxyvitamin D-24-hydroxylase (24-OHase). The 24-OHase enhances the metabolism of 1,25(OH)2D to calcitroic acid which is biologically inert. Thus, the local production of 1,25(OH)2D does not enter the circulation and has no influence on calcium metabolism. The parathyroid glands have 1-OHase activity and the local production of 1,25(OH)2D inhibits the expression and synthesis of PTH. The production of 1,25(OH)2D in the kidney enters the circulation and is able to downregulate renin production in the kidney and to stimulate insulin secretion in the β-islet cells of the pancreas. Holick, copyright 2007. Reproduced with permission.
None
Figure 62. Prevalence of multiple sclerosis (MS) by latitude in the United States according to data from Noonan et al. ( × ) and Wallin et al. (o). The dashed line is a quadratic fit to the data from Noonan et al., and the solid line is a fit to the data from Wallin et al. Reproduced with permission from.
None
Figure 63. Age-standardized incidence rates of type 1 diabetes per 100,000 boys < 14 y of age, by latitude, in 51 regions worldwide, 2002. Data points are shown by dots; names shown adjacent to the dots denote location, where space allows. Where space was limited, numerical codes (below) designate location. Source: data from WHO DiaMond [3]. Lux., Luxembourg. Numerical codes for areas: 2. Beja, Tunisia; 3. Gafsa, Tunisia; 4. Kairoan, Tunisia; 5. Monastir, Tunisia; 7. Mauritius; 8. Wuhan, China; 9. Sichuan, China; 10. Huhehot, China; 16. Nanjing, China; 17. Jinan, China; 21. Harbin, China; 23. Changsha, China; 25. Hainan, China; 29. Hong Kong, China; 31. Israel; 32. Chiba, Japan; 33. Hokkaido, Japan; 34. Okinawa, Japan; 36. Novosibirsk, Russia; 38. Antwerp, Belgium; 39. Varna, Bulgaria; 40. Denmark; 43. France; 44. Baden, Germany; 45. Attica, Greece; 48. Sicily, Italy; 49. Pavia, Italy; 50. Marche, Italy; 52. Lazio, Italy; 59. Krakow, Poland; 61. Algarve, Portugal; 62. Coimbra, Portugal; 63. Madeira Island, Portugal; 64. Portalegre, Portugal; 65. Bucharest, Romania; 67. Slovakia; 68. Catalonia, Spain; 71. Leicestershire, UK; 72. Northern Ireland, UK; 77. Allegheny, PA, USA; 80. Avellaneda, Argentina; 82. Corrientes, Argentina; 87. Paraguay; 88. Lima, Peru; 90. Caracas, Venezuela; 97. Auckland, New Zealand. Data points not labeled because of space constraints (latitude in degrees, rate per 100,000): 11. Dalian, China (39, 1.1); 12. Guilin, China (24, 0.6); 13. Beijing, China (40, 0.7); 14. Shanghai, China (32. 0.7); 15. Chang Chun, China (44, 0.6); 18. Jilin, China (43, 0.4); 19. Shenyang, China (42, 0.4); 20. Lanzhou, China (36, 0.5); 22. Nanning, China (23, 0.3); 24. Zhengzhou, China (35, 0.2); 26. Tie Ling, China (42, 0.2); 27. Zunyi, China (28, 0.1); 28. Wulumuqi, China (44, 0.9); 35. Karachi, Pakistan (25, 0.5); 37. Austria (48, 9.8); 46. Hungary (47, 8.7); 51. Turin, Italy (45, 11.9); 53. Lombardia, Italy (46, 7.6); 66. Slovenia (46, 6.8); 79. Chicago, IL, USA (42, 10.2). R2 = 0.25, p < 0.001. Reproduced with permission from.
None
Figure 64. Incidence rate of type 1 diabetes diagnosed at or before 14 y of age in Finland. Reproduced with permission from.
None
Figure 65. Variation in inflammatory bowel disease incidence rates with degrees latitude from the equator. (a) Variation in Crohn's disease incidence rates. R2 = 0.62, p = 0.0002. (b) Variation in ulcerative colitis incidence rates. R2 = 0.38, p = 0.011. Reproduced with permission from.
None
Figure 66. This figure illustrates the geographic variation in rheumatoid arthritis risk and shows a clear North-South gradient. Odds ratios are relative to the whole study area. (A) Adjusted, optimal span of 0.55 (global p = 0.034); contour lines denote areas of significantly increased (red) and decreased (blue) risk at the 0.05 level. (B) Adjusted, span of 0.20. Small span size results in more spatial variation in risk. Results for addresses at time of censoring. Reproduced with permission from.
None
Figure 67. Overview of the pharmacological effects of 1,25(OH)2D in the immune system. 1,25(OH)2D inhibits the surface expression of MHC II-complexed antigen and of costimulatory molecules, as well as the production of the cytokine IL-12 in antgen presenting cells (such as dendritic cells), thereby shifting the polarization of T cells from an (auto-)aggressive effector (Te) toward a protective or regulatory (Tr) phenotype. 1,25(OH)2D exerts its immunomodulatory effects also directly on the level of T cells. Together, these immunomodulatory effects of 1,25(OH)2D onto players of the adaptive immune system can lead to the protection of target tissues in autoimmune diseases and transplantation. In the innate immune system on the other hand, 1,25(OH)2D strengthens the antimicrobial function of monocytes and macrophages, for example through enhanced expression of the CAMP, eventually leading to better clearance of pathogenic microorganisms. Reproduced with permission from.
None
Figure 68. (A) Relationship of mean systolic blood pressure (SBP) and distance north or south of the equator. Symbols represent north or latitudes of INTERSALT Centers. (B) Relationship of mean diastolic blood pressure (DBP) to distance north or south of the equator. For both figures, broken lines represent 95% confidence limits. Reproduced with permission from.
None
Figure 69. Relationship of prevalence of hypertension to distance north or south of the equator. Labeled open boxes represent non-INTERSALT centers; solid boxes are INTERSALT centers. Broken lines represent 95% confidence limits. Regression line and confidence limits are derived from INTERSALT centers only. Reproduced with permission from.
None
Figure 70. Effect of UV irradiation on ambulatory daytime and night-time blood pressures was non-significant. Thick line represents the mean. Reproduced with permission from.
None
Figure 71. 1,25(OH)2D3 prevents foam cell formation. Macrophages stained with Oil Red O. (A) Diabetic subjects (group A). Top, 1,25(OH)2D3-treated cells; bottom, vitamin D–deficient cells. Arrowheads indicate foam cells. (B) Cholesteryl ester formation in macrophages from diabetics (group A) incubated in vitamin D–deficient (black bars) or 1,25(OH)2D3-supplemented (white bars) media or in macrophages from nondiabetic, vitamin D–deficient nondiabetic controls (group C) (n = 8 per group) incubated in vitamin D–deficient (gray bars) or 1,25(OH)2D3-supplemented (white bars) media (*p < 0.01 vs vitamin D deficient). (C) Oil Red O stain. (D) Cholesterol. (E) Triglycerides from peritoneal macrophages from LDR−/− mice fed vitamin D–deficient or –sufficient high-fat diet (n = 5 per group) (*p < 0.05 vs vitamin D deficient). Reproduced with permission from.
None
Figure 72. Kaplan-Meier plots for all-cause (left) and cardiovascular mortality (right) according to 25(OH)D groups in those with the metabolic syndrome. Log-rank analysis indicated a significant difference between all 25(OH)D groups (p = 0.001). Reproduced with permission from.
None
Figure 73. Association between latitude and schizophrenia prevalence on several continents. Reproduced with permission from.
None
Figure 74. Recommendations of the Institute of Medicine and the Endocrine Society Practice Guidelines for daily vitamin D supplementation to prevent vitamin D deficiency. Reproduced with permission from.
None
Figure 75. Various UVB lamps including Sperti and Sun Kraft used for vitamin D production and rickets prevention. Holick, copyright 2013. Reproduced with permission.
None
Figure 76. Russian children who are being exposed to UVB radiation. Reproduced with permission from.
None
Figure 77. (A) Mean (SEM) serum levels of 25(OH)vitamin D in patients with cystic fibrosis, treated with UVB (▲) (n = 9), and non-treated CF patients as controls (●) (n = 14) at baseline and after 8, 16 and 24 weeks. There were significant differences between the groups at all time points except at baseline (ANOVA, p < 0.0001). (B) Mean (± SEM) serum 25-hydroxyvitamin D concentration (ng/mL) before and after 8 weeks of UV light to cystic fibrosis (CF) subjects. Serum 25-hydroxyvitamin D [25(OH)D] levels in the five CF subjects at baseline were 21 ± 3 ng/ml, which increased to 27 ± 4 ng/ml at the end of 8 weeks (p = 0.05). Reproduced with permission from.
None
Figure 78. Photograph of a current version of the Sperti lamp with four fluorescent lamps. Holick, copyright 2013. Reproduced with permission.
None
Figure 79. (A) The Sperti KBD D/UV-F lamp irradiance output overlaps with UV wavelengths necessary for cutaneous vitamin D3 production (290–315nm). (B) Relationship between UV irradiation time and conversion of 7-DHC to previtamin D3, lumisterol, and tachysterol in borosilicate glass ampoules containing 7-DHC. Conversion of 7-DHC to previtamin D3 in a type II human skin sample is represented by the open circle. Reproduced with permission from.
None
Figure 80. (A) Mean change in serum 25(OH)D3 levels (ng/mL) compared with baseline among the five subjects during the study, error bars represent standard deviation. (*) denotes p < 0.01 and (**) denotes p < 0.005 compared with baseline serum 25(OH)D3. (B) Changes in serum 25(OH)D3 (ng/mL) in each individual subject compared with baseline. Reproduced with permission from.
None
Figure 81. Serum 25(OH)D, PTH and calcium levels in a patient with Crohn’s disease who had whole-body UVB exposure for 10 min 3 times a week for 6 mo. Reproduced with permission from.
None
Figure 82. Mean (± SEM) serum 25-hydroxyvitamin D concentrations in tanners and nontanners. Single points for each category are means ± SEMS. *Significantly different from nontanners, p < 0.001. Reproduced with permission from.
None
Figure 83. Comparison of the percentage increase in serum 25(OH)D levels of healthy adults who were in a bathing suit and exposed to suberythemal doses (0.5 MED) of UV B radiation once a week for 3 mo with healthy adults who received either 1000 IU of vitamin D2 or 1000 IU of vitamin D3 daily during the winter and early spring for a period of 11 weeks. Fifty percent increase represented approximately 10 ng/ml from baseline 18 ± 3 to 28 ± 4 ng/ml. Skin type is based on the Fitzpatrick scale: Type II always burns, sometimes tans; type III always burns, always tans; type IV sometimes burns, always tans; type V never burns, always tans. Data are means ± SEM. Holick, copyright 2008. Reproduced with permission.
None
Figure 84. Mean (± SEM) serum 25(OH)D levels after oral administration of vitamin D2 and/or vitamin D3. Healthy adults recruited at the end of the winter received placebo (•; n = 14), 1000 IU vitamin D3 (D3, ■; n = 20), 1000 IU vitamin D2 (D2, ▴; n = 16), or 500 IU vitamin D2 and 500 IU vitamin D3 [D2 and D3, ♦; n = 18) daily for 11 weeks. The total 25(OH)D levels are demonstrated over time. *, p = 0.027 comparing 25(OH)D over time between vitamin D3 and placebo; **, p = 0.041 comparing 25(OH)D over time between 500 IU vitamin D3 plus 500 IU vitamin D2 and placebo; ***, p = 0.023 comparing 25(OH)D over time between vitamin D2 and placebo. Reproduced with permission from.
None
Figure 85. Mean serum 25-hydroxyvitamin D (25[OH]D) and calcium levels. Results are given as mean (SEM) values averaged over 6-mo intervals. Time 0 is initiation of treatment. (A) Mean 25(OH)D levels in all patients treated with 50 000 IU of ergocalciferol (vitamin D2) every 2 weeks (maintenance therapy, n = 86). Forty-one of the patients were vitamin D insufficient or deficient and first received 50 000-IU ergocalciferol weekly for 8 weeks before being placed on maintenance therapy of 50 000 IU of ergocalciferol every 2 weeks. The mean 25(OH)D level of each 6-mo interval was compared with initial mean 25(OH)D level and showed a significant difference of p < 0.001 for all time points. To convert 25(OH)D to nanomoles per liter, multiply by 2.496. (B) Mean serum 25(OH)D levels in patients receiving maintenance therapy only. There were 38 patients who were vitamin D insufficient (25[OH]D levels < 21–29 ng/mL and 7 patients who were vitamin D sufficient (25[OH]D levels ≥ 30 ng/mL) who were treated only with maintenance therapy of 50 000 IU of ergocalciferol (vitamin D2) every 2 weeks. The mean 25(OH)D levels in each 6-mo interval were compared with mean initial 25(OH)D levels and showed a significant difference of p < 0.001 for all time points up to 48 mo. The data for interval months 60 and 72 were pooled, and there was a significant difference of p < 0.01 compared with the baseline value. (C) Serum calcium levels. Results for all 86 patients who were treated with 50 000 IU of ergocalciferol (vitamin D2). The reference range for serum calcium level is 8.5 to 10.2 mg/dL (to convert to millimoles per liter, multiply by 0.25). Reproduced with permission from.
None
Figure 86. Egyptian painting showing the pharao and the queen being exposed to sunshine.
None
Figure 87. This graph shows the association between mother’s increasing 25(OH)D level in nmol/L, and decreasing predicted probability of having a Cesarean section vs. vaginal delivery, with a quadratically fit line. The predicted probabilities of Cesarean section are derived from a multivariate logistic regression model controlling for mother’s age, education, insurance status, and race. Additionally, the model controls for reporting ever drinking alcohol during pregnancy, as this was statistically significant in univariate analysis and remained statistically significant at the p < 0.05 level in multivariate analysis. Reproduced with permission from.
None
Figure 88. Schlitz Beer advertisement with the slogan “keep sunny energy all winter long drink vitamin D fortified Schlitz beer” from 1936.
None
Figure 89. A Schematic representation of the major causes for vitamin D deficiency and potential health consequences. Holick, copyright 2007. Reproduced with permission.

Similar articles

Cited by

References

    1. Holick M. Phylogenetic and evolutionary aspects of vitamin D from phytoplankton to humans. In: PKT Pang and MP Schreibman (eds), Verebrate Endocrinology: Fundamentals and Biomedical Implications Academic Press, Inc (Harcourt Brace Jovanovich) Orlando, FL 1989;3:7-43.
    1. Holick MF. Vitamin D: A millenium perspective. J Cell Biochem. 2003;88:296–307. doi: 10.1002/jcb.10338. - DOI - PubMed
    1. Pasanen AL, Yli-Pietila K, Pasanen P, Kalliokoski P, Tarhanen J. Ergosterol content in various fungal species and biocontaminated building materials. Appl Environ Microbiol. 1999;65:138–42. - PMC - PubMed
    1. Kalaras MD, Beelman RB, Holick MF, Elias RJ. Generation of potentially bioactive ergosterol-derived products following pulsed ultraviolet light exposure of mushrooms (Agaricus bisporus) Food Chem. 2012;135:396–401. doi: 10.1016/j.foodchem.2012.04.132. - DOI - PubMed
    1. Holick MF, Chen TC, Lu Z, Sauter E. Vitamin D and skin physiology: a D-lightful story. J Bone Miner Res. 2007;22(Suppl 2):V28–33. doi: 10.1359/jbmr.07s211. - DOI - PubMed