. 2014 Apr;13(4):394-408.
doi: 10.1111/gbb.12120. Epub 2014 Mar 7.

Deletion of the Kv2.1 delayed rectifier potassium channel leads to neuronal and behavioral hyperexcitability

Affiliations

Deletion of the Kv2.1 delayed rectifier potassium channel leads to neuronal and behavioral hyperexcitability

D J Speca et al. Genes Brain Behav. 2014 Apr.

Abstract

The Kv2.1 delayed rectifier potassium channel exhibits high-level expression in both principal and inhibitory neurons throughout the central nervous system, including prominent expression in hippocampal neurons. Studies of in vitro preparations suggest that Kv2.1 is a key yet conditional regulator of intrinsic neuronal excitability, mediated by changes in Kv2.1 expression, localization and function via activity-dependent regulation of Kv2.1 phosphorylation. Here we identify neurological and behavioral deficits in mutant (Kv2.1(-/-) ) mice lacking this channel. Kv2.1(-/-) mice have grossly normal characteristics. No impairment in vision or motor coordination was apparent, although Kv2.1(-/-) mice exhibit reduced body weight. The anatomic structure and expression of related Kv channels in the brains of Kv2.1(-/-) mice appear unchanged. Delayed rectifier potassium current is diminished in hippocampal neurons cultured from Kv2.1(-/-) animals. Field recordings from hippocampal slices of Kv2.1(-/-) mice reveal hyperexcitability in response to the convulsant bicuculline, and epileptiform activity in response to stimulation. In Kv2.1(-/-) mice, long-term potentiation at the Schaffer collateral - CA1 synapse is decreased. Kv2.1(-/-) mice are strikingly hyperactive, and exhibit defects in spatial learning, failing to improve performance in a Morris Water Maze task. Kv2.1(-/-) mice are hypersensitive to the effects of the convulsants flurothyl and pilocarpine, consistent with a role for Kv2.1 as a conditional suppressor of neuronal activity. Although not prone to spontaneous seizures, Kv2.1(-/-) mice exhibit accelerated seizure progression. Together, these findings suggest homeostatic suppression of elevated neuronal activity by Kv2.1 plays a central role in regulating neuronal network function.

Keywords: Hyperactivity; Kcnb1; Kcnb1tm1Dgen; long-term potentiation; seizure.


Figures

Figure 1
Figure 1. Lack of apparent compensatory changes in Kv channel expression in Kv2.1−/− mice
Multiple immunofluorescence labeling of adult hippocampus for (a–d). Panels (a, c) are from Kv2.1+/+ mice, and panels (b, d) from Kv2.1−/− littermates. Sections were labeled for Kv2.1 (green) and (a–b) Kv1.4 (red), or (c–d) Kv2.2 (red), and directly labeled with a nuclear dye (blue), as indicated. Note that Kv2.1 staining is absent in Kv2.1−/− brain sections and that the expression and localization of Kv1.4 and Kv2.2 seen in the Kv2.1+/+ section is maintained in the Kv2.1−/− section. Scale bar: 200 μm. (e) Representative immunoblots of Kv channel α subunit expression in whole brain of Kv2.1+/+ and Kv2.1−/− adult mice. (f) Quantitation of protein expression levels from nine Kv2.1+/+ (filled bars) and ten Kv2.1−/− (open bars) MBM fractions. The graph depicts the average intensity normalized to Kv2.1+/+ for each antibody used. Data are expressed as mean ± SEM. ****P < 0.00001.
Figure 2
Figure 2. A slowly deactivating delayed rectifier current is reduced in Kv2.1−/− neurons
Representative current traces from (a) Kv2.1+/+ and (b) Kv2.1−/− mouse hippocampal neurons. Cell capacitance was 22pF and 20pF respectively. Voltage clamp command indicated above. Black traces, currents in BSA vehicle. Gray traces, currents in presence of 100 nM GxTX. Blue and red traces, subtraction of GxTX from vehicle trace. Box indicates region of slow tail currents used for analysis. (c) Peak currents normalized to cell capacitance from Kv2.1+/+ and Kv2.1−/− neurons during step to 10 mV. Black circles, vehicle. Gray circles, 100nM GxTX. Lines connect data from individual neurons. Thick bar is mean, error bars SEM. (d) Magnification of subtraction currents normalized to cell capacitance from panels a and b. Smooth lines are single exponential decays fit to currents. τ+/+ = 57.9 ± 0.2 ms, τ−/− = 31.7 ± 0.5, mean ± SD. (e) Stimulus dependence of slow tail currents from Kv2.1+/+, blue, and Kv2.1−/− neurons, red. Values plotted are mean current normalized to cell capacitance from 20 to 100 ms after start of step to −40 mV from indicated stimulus voltage. Smooth lines are Boltzmann distributions fit to currents. V1/2+/+ = −26 ± 2 mV, z+/+ = 4 ± 1 e, V1/2−/−, = −17 ± 7 mV, z+/+ = 3 ± 2 e, mean ± SD. (f) Circles are mean of GxTX-sensitive slow tail currents from individual neurons following step from 10 mV. Values were normalized to vehicle tail following 80 mV stimulus. Kv2.1+/+ n = 6, Kv2.1−/− n = 9. ***P < 0.001.
Figure 3
Figure 3. Kv2.1−/− hippocampal brain slices have altered excitability and neuronal network function
(a and b) Bicuculline-induced excitability is enhanced in hippocampal slices from Kv2.1−/− mice in ACSF (5 mM KCl). (a) Representative evoked field potential traces from the CA1 region of hippocampal slices prepared from Kv2.1+/+ and Kv2.1−/− littermate mice before (control) and after bicuculline (5 μm bicuculline) application. Bicuculline application led to bursting in response to Schaffer collateral orthodromic stimulation in both genotypes; however, the response was more prolonged in the slices from Kv2.1−/− compared to littermate Kv2.1+/+ mice. (b) Summary of the increase in duration and amplitude of the evoked response after bicuculline application (as a percent of control) for slices from both Kv2.1+/+ (n = 9 slices from 3 mice) and Kv2.1−/− (n = 8 slices from 3 mice). (c, d and e) Excitability differences during the theta burst stimulation (TBS). (c) A representative trace of evoked epileptiform activity (E.A.) observed in Kv2.1−/− slices (this trace 60 min after TBS). (d) Representative traces during TBS from Kv2.1+/+ and Kv2.1−/−, and Kv2.1−/− slices with spontaneous epileptiform activity (EA). Each trace superimposes 5 bursts (5 pulses, 100 Hz). (e) Summary bar graph of the negative field potential area during TBS (calculated as the field potential area beneath the dotted lines in Fig. 3d). The area of the Kv2.1+/+ (23.5±1.6 mV · ms, n=9 slices from 7 mice) was significantly larger than the area from of the Kv2.1−/− (18.5±1.5 mV · ms, n=8 slices from 5 mice). The area of the Kv2.1−/− slices with epileptiform activity (EA) (44.1±4.4 mV · ms, n=8 slices from 4 mice) is significantly larger than the area of Kv2.1+/+ and Kv2.1−/− slices. (f and g) LTP induced by TBS in Kv2.1+/+ and Kv2.1−/− slices in ACSF (5mM KCl). Upper traces of (f) show representative traces before TBS (control, gray line) and 55 min. after TBS (black line) from Kv2.1+/+ and Kv2.1−/− hippocampal slices. Bottom of (f) indicates the time course of normalized fEPSP slope as mean ± SEM (Kv2.1+/+, n = 9 slices; Kv2.1−/−, n = 8 slices). LTP at the CA3-CA1 synapse was induced by TBS at time point 0 (indicated by black arrow), and monitored for 60 min. after induction. TBS induced LTP in both Kv2.1+/+ and Kv2.1−/− hippocampal slices. However, LTP amplitude was smaller in Kv2.1−/− slices at 45–55 min after TBS. (g) Summary bar graph indicates that TBS induced LTP in Kv2.1+/+ and Kv2.1−/− hippocampal slices. The magnitude of LTP was significantly different between Kv2.1+/+ (195%±10%, n=9 slices from 7 mice) and Kv2.1−/− (151%±4%, n=8 slices from 5 mice). Data are expressed as mean ± SEM. *P < 0.05; ****P<0.0001.
Figure 4
Figure 4. Basic assessment of Kv2.1−/− mice
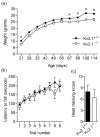
(a) Kv2.1+/+ and Kv2.1−/− male mice were weighed weekly. Kv2.1+/+ male mice weighed significantly more than Kv2.1−/− at all time points, particularly after three months of age (n=7/genotype). Note that the SEM (error bars) is included in these graphs; there was very little variation in weight within a genotype. (b) Rotarod performance is unaffected in Kv2.1+/+ and Kv2.1−/− male mice (n=10/genotype). (c) Optokinetic head tracking response is unaffected Kv2.1−/− female mice (n=7) relative to Kv2.1+/+ littermates (n=8). Data are expressed as mean ± SEM. *P < 0.01.
Figure 5
Figure 5. Kv2.1−/− mice are hyperactive
(a) 24 hour locomotor activity was elevated in Kv2.1−/− female mice (n=7) relative to Kv2.1+/+ littermates (n=8). Each data point represents seven minutes of activity (cm/7 minutes). (b) Spontaneous locomotor activity is significantly higher Kv2.1−/− male mice than in Kv2.1+/+ littermates (n=10/genotype). Each data point represents three minutes of activity (cm/3 minutes). (c) Cumulative Distance Traveled (Cumulative DT) over the sixty-minute period in B showed a nearly Mendelian separation between the genotypes. (d) Female mice were transferred to a new cage bottom and the number of jumps on the wall of the cage was counted over a one hour time period. Data are expressed as mean ± SEM. ***P < 0.0001.
Figure 6
Figure 6. Decreased anxiety-like behavior in Kv2.1−/− mice
Percent time spent in open arms of elevated plus maze (a and c) and number of entries into the open arms of the maze (b and d) are significantly increased in Kv2.1−/− mice compared to Kv2.1+/+ littermates for both male mice (a and b; n=10/genotype) and female mice (c and d; n=8 Kv2.1+/+ and n=6 Kv2.1−/− mice). Data are expressed as mean ± SEM. *P < 0.05; **P < 0.01; ***P < 0.0001.
Figure 7
Figure 7. Kv2.1−/− mice are defective in learning in a Morris Water Maze
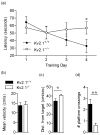
(a) Latency to find the hidden platform did not decrease significantly over the testing days in Kv2.1−/− male mice but did in Kv2.1+/+ littermates. During the probe trial on Day 5, swim velocity did not differ between Kv2.1+/+ and Kv2.1−/− male mice (b) However, the distance from the target platform was significantly higher for Kv2.1−/− mice (c), and the number of platform crossings was significantly lower (d) (n=8/genotype for all experiments). Data are expressed as mean ± SEM. *P < 0.05; **P < 0.01.
Figure 8
Figure 8. Kv2.1−/− mice are susceptible to chemically induced seizures
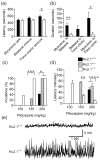
(a) Latency to flurothyl-induced seizures was not significantly different between Kv2.1+/+ and Kv2.1−/− male mice, except for latency to tonic-clonic seizure (n=7/genotype). (b) Transition duration from one seizure stage to another was significantly faster in Kv2.1−/− male mice relative to Kv2.1+/+ littermates (n=7/genotype). (c) Incidence to pilocarpine-induced seizures (Stage 4, see Methods) was significantly increased in Kv2.1−/− and Kv2.1+/− male mice relative to Kv2.1+/+ littermates at all doses (n=8/dose/genotype). (d) Latency to pilocarpine-induced seizures (Stage 4) was significantly decreased in Kv2.1−/− and Kv2.1+/− male mice relative to Kv2.1+/+ littermates at all doses (n=8/dose/genotype). (e) Representative EEG recordings from Kv2.1+/+ and Kv2.1−/− male mice confirmed that pilocarpine (170mg/kg) induced ictal patterns of activity in Kv2.1−/− animals. Data are expressed as mean ± SEM. *P < 0.05; **P < 0.01; ***P < 0.001; ****P < 0.001.

Similar articles

Cited by

References

    1. Antonucci DE, Lim ST, Vassanelli S, Trimmer JS. Dynamic localization and clustering of dendritic Kv2.1 voltage-dependent potassium channels in developing hippocampal neurons. Neuroscience. 2001;108:69–81. - PubMed
    1. Ariano MA, Cepeda C, Calvert CR, Flores-Hernandez J, Hernandez-Echeagaray E, Klapstein GJ, Chandler SH, Aronin N, DiFiglia M, Levine MS. Striatal potassium channel dysfunction in Huntington’s disease transgenic mice. J Neurophysiol. 2005;93:2565–2574. - PubMed
    1. Baranauskas G, Tkatch T, Surmeier DJ. Delayed rectifier currents in rat globus pallidus neurons are attributable to Kv2.1 and Kv3.1/3.2 K(+) channels. J Neurosci. 1999;19:6394–6404. - PMC - PubMed
    1. Beaudoin GM, 3rd, Lee SH, Singh D, Yuan Y, Ng YG, Reichardt LF, Arikkath J. Culturing pyramidal neurons from the early postnatal mouse hippocampus and cortex. Nature protocols. 2012;7:1741–1754. - PubMed
    1. Bekkers JM. Distribution and activation of voltage-gated potassium channels in cell- attached and outside-out patches from large layer 5 cortical pyramidal neurons of the rat. J Physiol. 2000;525:611–620. - PMC - PubMed

Publication types

MeSH terms