. 2014 Mar;21(3):269-86.
doi: 10.1089/cmb.2013.0099. Epub 2014 Feb 4.

A Bayesian sampler for optimization of protein domain hierarchies

Affiliations

A Bayesian sampler for optimization of protein domain hierarchies

Andrew F Neuwald. J Comput Biol. 2014 Mar.

Abstract

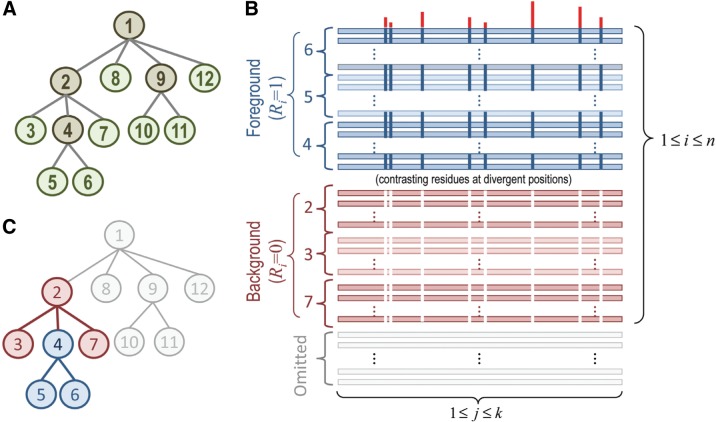
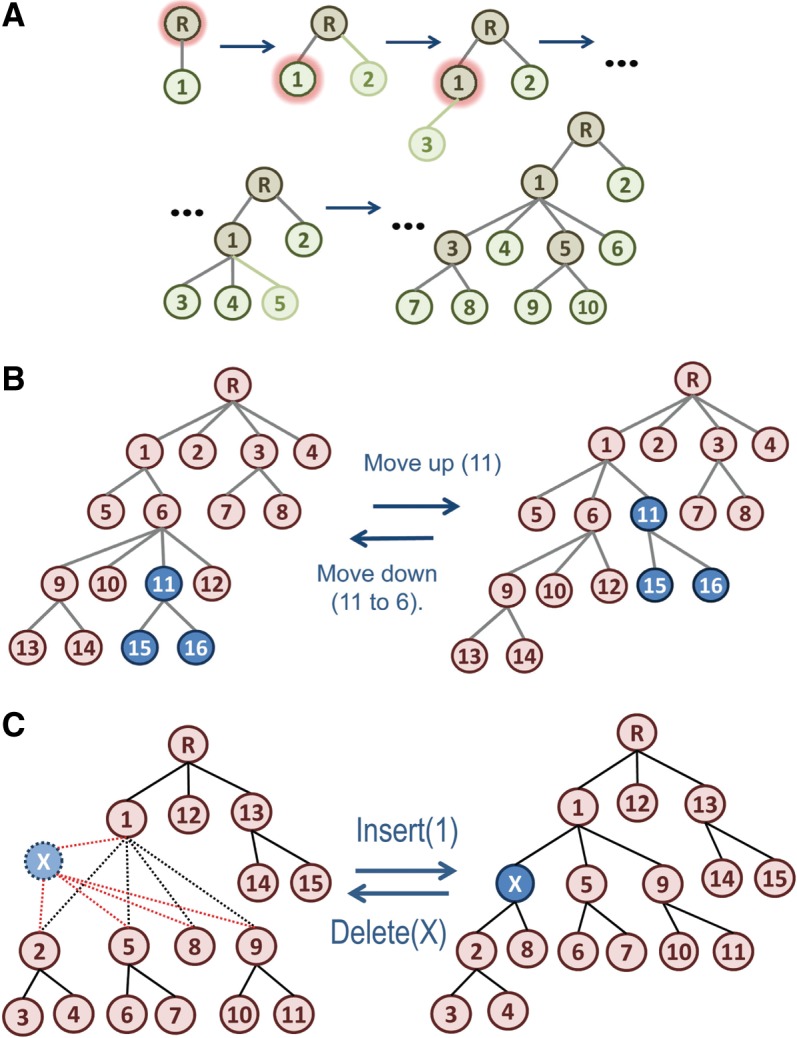
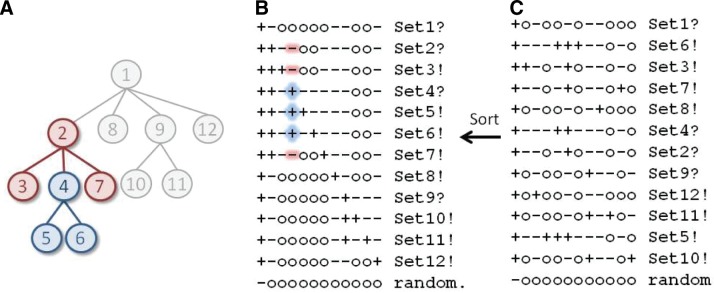
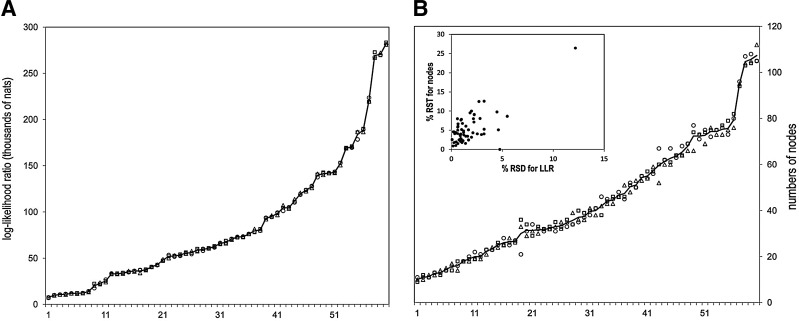
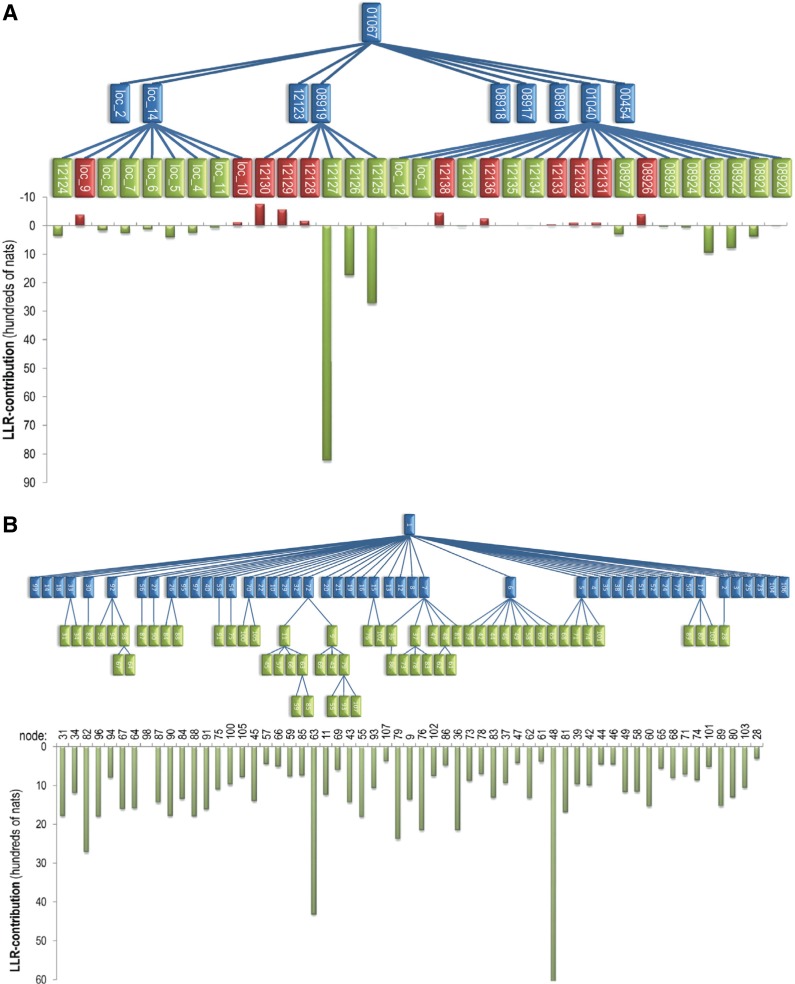
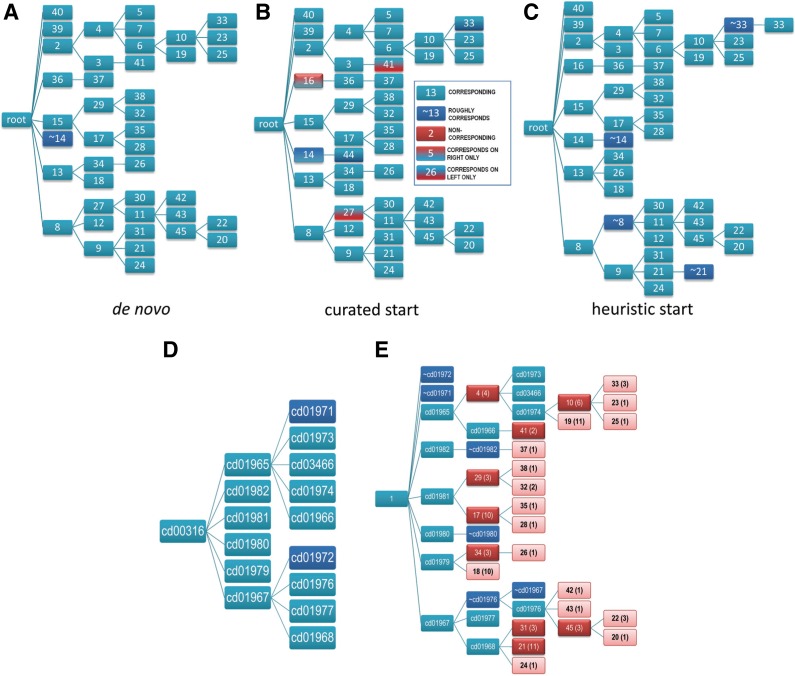
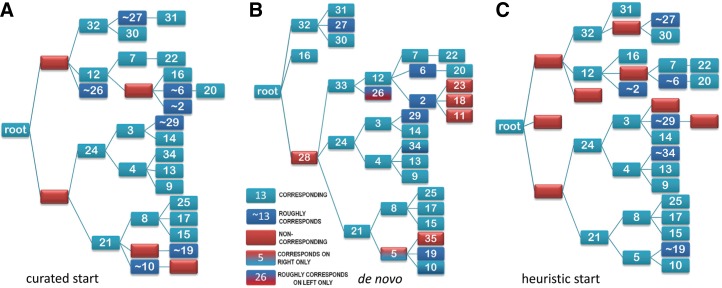
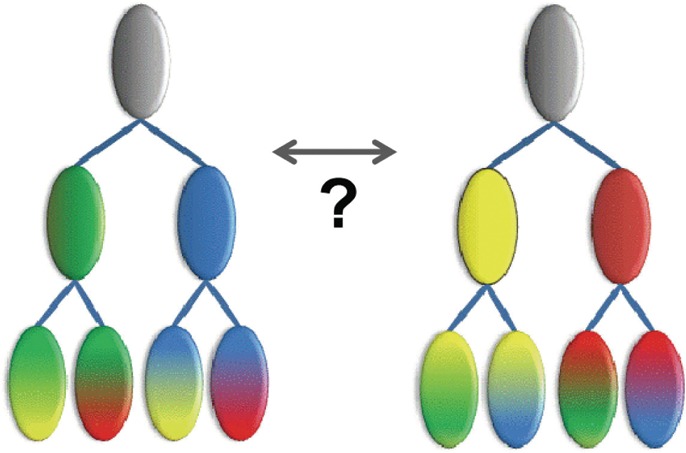
The process of identifying and modeling functionally divergent subgroups for a specific protein domain class and arranging these subgroups hierarchically has, thus far, largely been done via manual curation. How to accomplish this automatically and optimally is an unsolved statistical and algorithmic problem that is addressed here via Markov chain Monte Carlo sampling. Taking as input a (typically very large) multiple-sequence alignment, the sampler creates and optimizes a hierarchy by adding and deleting leaf nodes, by moving nodes and subtrees up and down the hierarchy, by inserting or deleting internal nodes, and by redefining the sequences and conserved patterns associated with each node. All such operations are based on a probability distribution that models the conserved and divergent patterns defining each subgroup. When we view these patterns as sequence determinants of protein function, each node or subtree in such a hierarchy corresponds to a subgroup of sequences with similar biological properties. The sampler can be applied either de novo or to an existing hierarchy. When applied to 60 protein domains from multiple starting points in this way, it converged on similar solutions with nearly identical log-likelihood ratio scores, suggesting that it typically finds the optimal peak in the posterior probability distribution. Similarities and differences between independently generated, nearly optimal hierarchies for a given domain help distinguish robust from statistically uncertain features. Thus, a future application of the sampler is to provide confidence measures for various features of a domain hierarchy.


Figures

<b>FIG. 1.</b>
FIG. 1.
(A) Idealized hierarchical model of protein sequence divergence. In this example, potentially thousands of sequences within a large protein class are modeled as 12 subgroups. Intermediate and leaf nodes are shown in brown and green, respectively. (B) Schematic drawing of a partitioned alignment (termed a contrast alignment) corresponding to the BPPS statistical model. Aligned sequences are assigned to either a “foreground” or a “background” partition (blue and maroon horizontal bars, respectively). Partitioning is based on the conservation of foreground residues (blue vertical bars) that diverge from (or contrast with) the background residues at those positions (white vertical bars). Red vertical bar heights quantify the selective pressure imposed on divergent residue positions. Note that the probability distribution in Equation 1 sums over k aligned columns and over n foreground and background sequences, as indicated. (C) Foreground subtree (blue nodes) corresponding to the foreground of the contrast alignment in (B). The rest of the subtree rooted at the parent of the foreground subtree corresponds to the background (maroon nodes). Thus, the collection of such hierarchically arranged contrast alignments (one for each subtree with the tree) identifies the distinguishing patterns associated with functional divergence of the protein class. The sequences associated with node 5, for example, conserve distinguishing patterns corresponding to their membership in the subfamily, family, superfamily, and class represented by the subtrees rooted at nodes 5, 4, 2, and 1, respectively. For the contrast alignment corresponding to the main root (node 1), the background partition is defined by random sequences (not shown). BPPS, Bayesian Partitioning with Pattern Selection.
<b>FIG. 2.</b>
FIG. 2.
Operations for adding, moving, and deleting nodes. (A) The AddLeaf() operation. This operation is applied to both internal nodes (brown) and existing leaf nodes (green) and can construct a complex hierarchy by repeatedly sampling new leaf nodes. In each step, the resultant hierarchy is subsequently optimized by omcBPPS sampling over sequence assignments and patterns. Nodes selected for spawning off a new leaf node (in the first three steps) are haloed in red. (B) The MoveUp() and MoveDown() operations. The nodes in the subtree being moved are shown in blue. (C) The Insert() and Delete() operations. Insert() adds a new internal node (shown in blue) into an existing hierarchy. Delete() can remove either an internal node (as shown) or a leaf node.
<b>FIG. 3.</b>
FIG. 3.
Correspondence between a tree and an H-table. (A) The tree from Figure 1C representing the hierarchical relationships between protein subgroups highlighting the foreground (blue nodes) and background (maroon nodes) nodes for the subtree rooted at node 4. Nonparticipating nodes are shown in gray. (B) The corresponding H-table in standard tree format. Names of leaf and internal nodes are terminated by exclamation and question marks respectively. The node 4 subtree is highlighted in the table to correspond to the tree in (A). (C) A scrambled version of the table shown in (B), which the Sort() operation unscrambles.
<b>FIG. 4.</b>
FIG. 4.
(A) Plot of hierarchy LLRs for the 60 domains listed in Table 1. Hierarchies were created by the omcBPPS sampler initialized from three different starting points: de novo, □; from a hierarchy created heuristically (Neuwald et al., 2012), ◯; and from a manually curated CDD hierarchy, △. The line corresponds to the average for the three methods. (B) Plot of the numbers of nodes obtained for each hierarchy. A scatter plot (inset) of the RSD for the LLR versus the RSD for the numbers of nodes reveals an outlier (top right corner) corresponding to cd08304. CDD, Conserved Domain Database; LLRs, log-likelihood ratios; omcBPPS, optimal multiple-category BPPS; RSD, relative standard deviation.
<b>FIG. 5.</b>
FIG. 5.
Contributions of individual nodes to the second level of the curated versus optimal hierarchies for globin-like domains (cd01067). Nodes shown in green and red contribute (positively or negatively, respectively) to the LLR at the second or lower levels of the hierarchy, as plotted below each hierarchy. Other nodes are shown in blue. (A) Manually curated hierarchy (LLR score: 126,945 nats; 43 nodes). Numbers are labeled with their CD identifiers. (B) Optimized hierarchy obtained using the curated CDD hierarchy as a starting point (223,561 nats; 55 nodes).
<b>FIG. 6.</b>
FIG. 6.
Example of a robust hierarchy; the oxidoreductase/nitrogenase domain (cd00316). (A) Hierarchy generated de novo (96,708 nats; 43 nodes). (B) Hierarchy obtained using the curated CDD hierarchy as a starting point (99,377 nats; 45 nodes). The correspondence between nodes of the hierarchies in (A) and in (C) to nodes in the hierarchy in (B) is indicated using the color code defined in the box. (C) Hierarchy obtained using a heuristic hierarchy as the starting point (98,708 nats; 46 nodes). (D) The CDD manually curated hierarchy (71482 nats; 16 nodes). (E) The hierarchy shown in (B) but re-colored for comparison with the NCBI manually curated hierarchy in (D). The light-red nodes are nodes that fail to correspond to a node in (D) and that are less diverse than the least diverse node in (D). Numbers in parentheses correspond to the number of phyla represented by the sequences assigned to those nodes. For comparison, the nodes in the manually curated hierarchy all have sequences from at least four phyla. NCBI, National Center for Biotechnology Information.
<b>FIG. 7.</b>
FIG. 7.
Comparison of the hierarchies obtained for the catalytic domain of phosphoinositide 3-kinase (PI3Kc)-like proteins. (A) Hierarchy obtained using the curated CDD hierarchy (cd00142) as a starting point (51,784 nats; 33 nodes). Node numbering likewise corresponds to the node numbering in (B). (B) A hierarchy generated de novo (52,990 nats; 36 nodes). (C) Optimal hierarchy obtained using a heuristic hierarchy as the starting point (52,650 nats; 36 nodes).
<b>FIG. 8.</b>
FIG. 8.
Hypothetical illustration of patterns inconsistent with a single tree. The same four leaf nodes, each of which harbor two out of four properties (green, yellow, blue, and red), may be arranged in two different ways, where, for each tree, intermediate nodes model only one of the conserved properties.

Similar articles

Cited by

References

    1. Abascal F., and Valencia A.2002. Clustering of proximal sequence space for the identification of protein families. Bioinformatics 18, 908–921 - PubMed
    1. Engelhardt B.E., Jordan M.I., Srouji J.R., et al. . 2011. Genome-scale phylogenetic function annotation of large and diverse protein families. Genome Res. 21, 1969–1980 - PMC - PubMed
    1. Finn R.D., Tate J., Mistry J., et al. . 2008. The Pfam protein families database. Nucleic Acids Res. 36, D281–D288 - PMC - PubMed
    1. Hastings W.K.1970. Monte Carlo sampling methods using Markov Chains and their applications. Biometrika 57, 97–109
    1. Kirkpatrick S., Gelatt C.D., and Vecchi M.P.1983. Optimization by simulated annealing. Science 220, 671–680 - PubMed

Publication types

LinkOut - more resources