. 2014 Mar 5;136(9):3560-71.
doi: 10.1021/ja412001e. Epub 2014 Feb 11.

Construction and validation of nano gold tripods for molecular imaging of living subjects

Affiliations

Construction and validation of nano gold tripods for molecular imaging of living subjects

Kai Cheng et al. J Am Chem Soc. .

Abstract

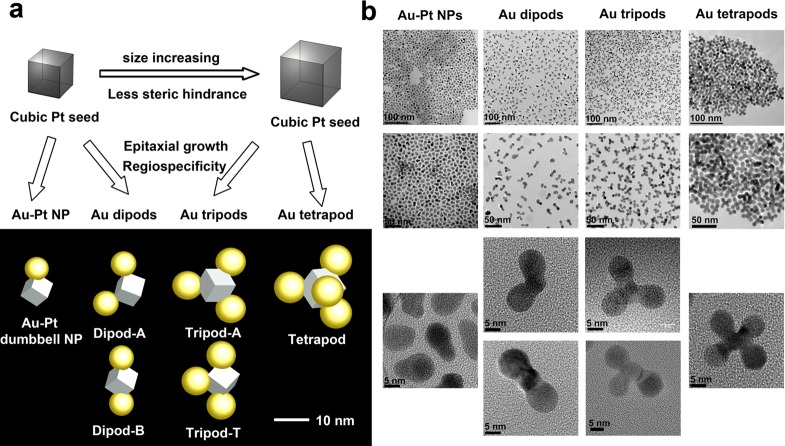
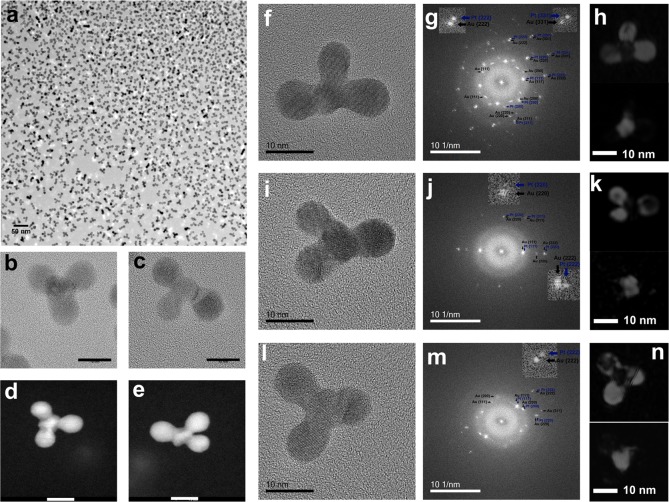
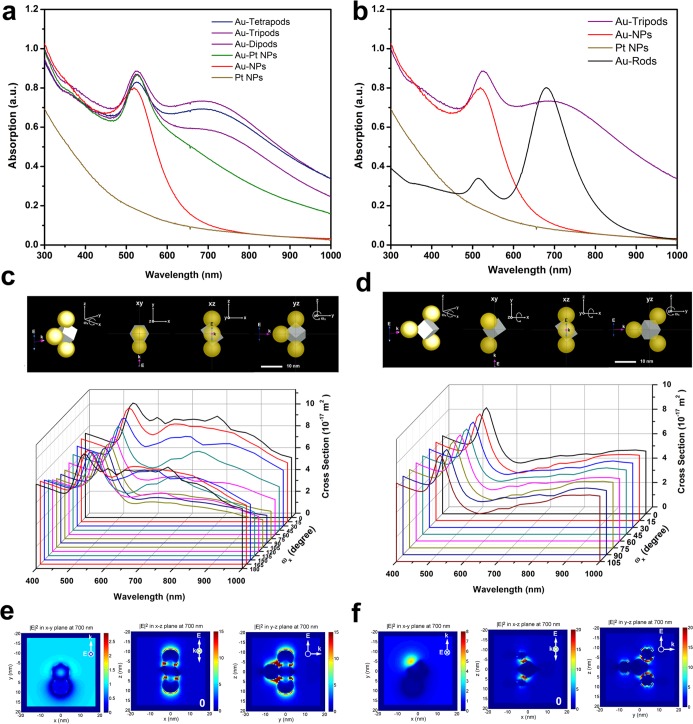
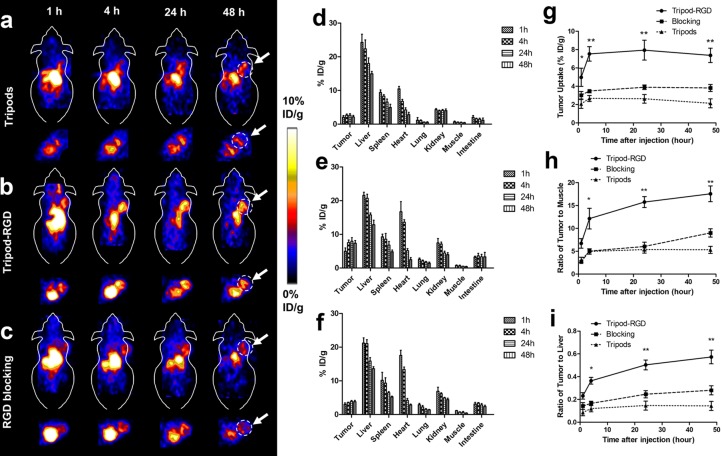
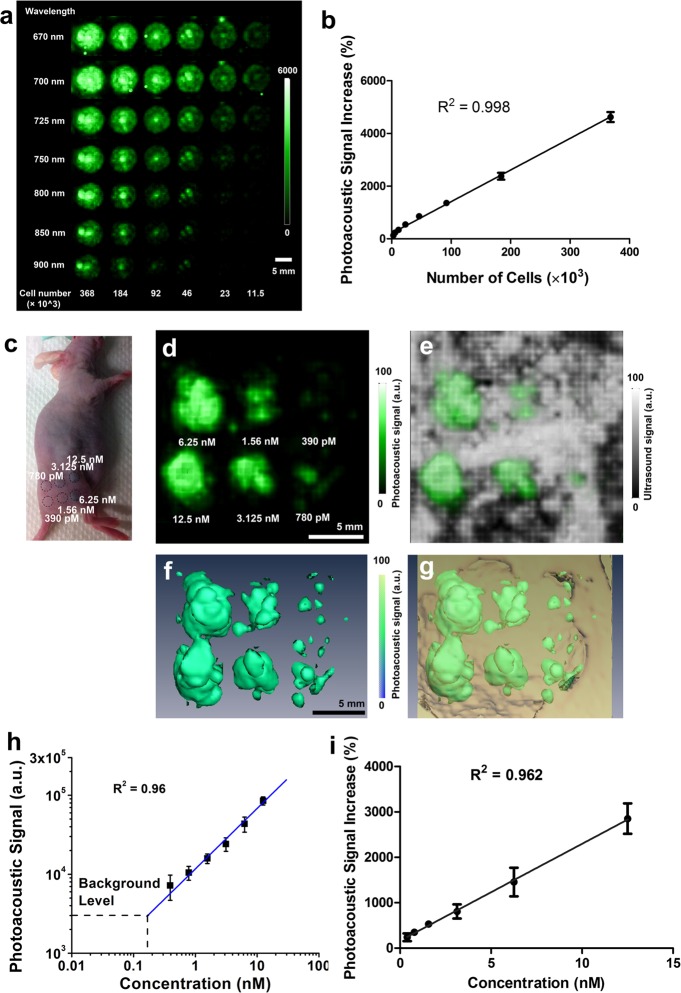
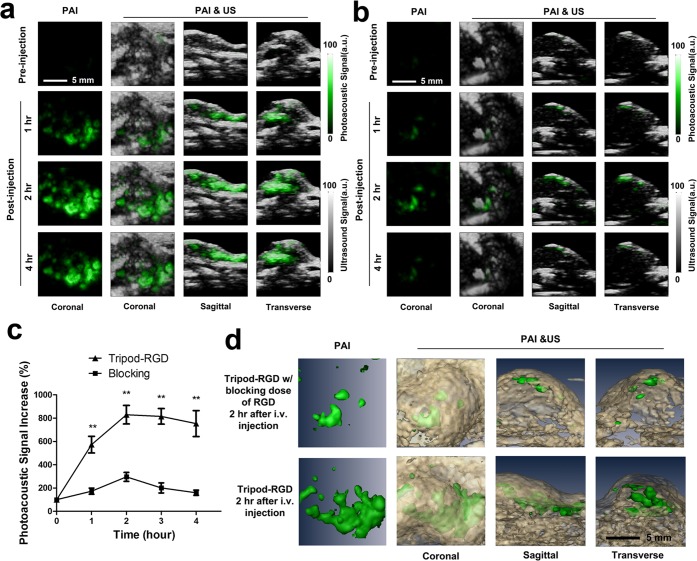
Anisotropic colloidal hybrid nanoparticles exhibit superior optical and physical properties compared to their counterparts with regular architectures. We herein developed a controlled, stepwise strategy to build novel, anisotropic, branched, gold nanoarchitectures (Au-tripods) with predetermined composition and morphology for bioimaging. The resultant Au-tripods with size less than 20 nm showed great promise as contrast agents for in vivo photoacoustic imaging (PAI). We further identified Au-tripods with two possible configurations as high-absorbance nanomaterials from various gold multipods using a numerical simulation analysis. The PAI signals were linearly correlated with their concentrations after subcutaneous injection. The in vivo biodistribution of Au-tripods favorable for molecular imaging was confirmed using small animal positron emission tomography (PET). Intravenous administration of cyclic Arg-Gly-Asp-d-Phe-Cys (RGDfC) peptide conjugated Au-tripods (RGD-Au-tripods) to U87MG tumor-bearing mice showed PAI contrasts in tumors almost 3-fold higher than for the blocking group. PAI results correlated well with the corresponding PET images. Quantitative biodistribution data revealed that 7.9% ID/g of RGD-Au-tripods had accumulated in the U87MG tumor after 24 h post-injection. A pilot mouse toxicology study confirmed that no evidence of significant acute or systemic toxicity was observed in histopathological examination. Our study suggests that Au-tripods can be reliably synthesized through stringently controlled chemical synthesis and could serve as a new generation of platform with high selectivity and sensitivity for multimodality molecular imaging.


Figures

Figure 1
Figure 1
Construction of gold multipods (including Au–Pt dumbbell NPs, Au-dipods, Au-tripods and Au-tetrapods). (a) Schematic showing the stepwise syntheses of various gold multipods via a set of known nucleation reactions and epitaxial growth processes. Various gold multipods are modeled by Lumerical FDTD Solution (Lumerical Solution Inc.). Considering the regioselectivity, several possible regioisomers are shown in the bottom-left panel. (b) TEM images of the resultant gold multipods at different magnifications. HRTEM images of representative gold multipods are shown in the bottom-right panels.
Figure 2
Figure 2
HRTEM and STEM images of Au-tripods, and their Fourier transform and inverse Fourier transform analyses. (a) TEM image of typical Au-tripods. There are two types of tripods: tripod-A (b) and tripod-T (c). (d,e) STEM images of two types of tripods. (f–h) HRTEM images of typical tripod-T and its fast Fourier transform (FFT) and inverse fast Fourier transform (inverse FFT) analyses. The insets in (g) show the splits of the (222) and (331) peaks into two spots: one for Pt and the other for Au crystal. Inverse FFT reconstructions of the Pt (bottom) or Au (top) NPs using only the superlattice reflections, [222], [331], [220], and [111], are shown in (h). (i–k) HRTEM, FFT, and inverse FFT reconstruction of the other tripod-T with different orientation. Inverse FFT reconstruction of the Pt (bottom) or Au (top) NPs using the superlattice reflections [222], [331], [220], and [111]. (l–n) HRTEM, FFT, and inverse FFT reconstruction of tripod-A. The split of the (222) peaks is attributed to the difference between Pt and Au crystals and is shown in the inset of (m). Inverse FFT reconstructions of the Pt (bottom) or Au (top) NPs using only the superlattice reflections [222], [220], and [111] are shown in (n).
Figure 3
Figure 3
Optical properties of Au-tripods, and measurement and simulation of optical absorption cross sections of tripods. (a) UV–vis extinction curves of various gold multipods (including Au–Pt dumbbell NPs, Au-dipods, Au-tripods, and Au-tetrapods) at the same sample weight (based on ICP-MS). (b) UV–vis extinction curves of gold nanospheres, cubic platinum NPs, and gold nanorods (54 nm length and 18 nm diameter, more information in the SI, sections C.2 and C.3). (c) The calculated absorption cross section of tripod-T as a function of ωx (the incident beam is polarized along the z-axis, and the tripod-T is rotated around the x-axis. ωx is the angle between the e-field and the long axis of tripod-T. (d) The calculated absorption cross section of tripod-A as a function of ωx (the incident beam is polarized along the z-axis, and the tripod-A is rotated around the x-axis. ωx is the angle between the e-field and the side of tripod-A. Polarization dependence of the average electric field intensity of tripod-T (e) and tripod-A (f). Electric field intensity contours in xz plane, xy plane, and yz plane at 700 nm were obtained from the FDTD calculations on both tripod-T and tripod-A. The long axis of tripod-T is parallel to the z-axis; one side of tripod-A is parallel to the z-axis. The excitation polarization relative to the z-axis is 0°. x and y represent the horizontal and vertical lengths of the calculated area.
Figure 4
Figure 4
Small animal PET images and PET quantification of intravenous injected tripods with different surface functionalization in mice bearing the U87MG human glioblastroma tumor. (a–c) Targeting of integrin αvβ3-postitive U87MG tumor in mice by RGD-functionalized tripods. Decay-corrected whole-body coronal PET images of nude mice bearing human U87MG tumors at 1, 4, 24, and 48 h after injection of 3.7 MBq of 64Cu-RGD-Au-tripod, 64Cu-RGD-Au-tripod with a blocking dose of c(RGDfC) (21 μmol of c(RGDfC)/kg of mouse body weight), and 64Cu–Au-tripod (200 pmol/kg of mouse body weight, or 2 mg/kg of mouse body weight). (d,f) PET quantification of tumors and major organs after intravenous injection to mice bearing subcutaneous U87MG glioma xenografts (n = 4 per group, data represent means ± SD). (g–i), Comparison of tumor and major organ uptake of 64Cu-RGD-Au-tripod, 64Cu-RGD-Au-tripod with a blocking dose of c(RGDfC), and 64Cu–Au-tripod for a time period up to 48 h after intravenous injection to U87MG tumor-bearing mice (n = 4 per group). Data represent mean ± SD ** P < 0.01, *P < 0.05 (two-sided Student’s t-test).
Figure 5
Figure 5
High sensitivity of Au-tripods for photoacoustic molecular imaging. (a) The top view of three-dimensional (3D) volume rendering of photoacoustic images of an agarose phantom containing decreasing number of U87MG cancer cells exposed to RGD-Au-tripod at different wavelengths (670, 700, 725, 750, 800, 850, 900 nm). The inhomogeneous signal inside wells is due to possible aggregation of cells. (b) Quantitative analysis of the photoacoustic signal (relative to the background signal) from the phantom (n = 3). (c) RGD-Au-tripod ranging in concentrations from 390 pM to 12.5 nM were injected subcutaneously into the flank of living mice (n = 3) and scanned with photoacoustic instrument. (d,e) Picomolar photoacoustic detection of tripods in living mice. The coronal view (d) of 3D volume rendering of photoacoustic images of subcutaneous inclusions. The skin is visualized in the ultrasound image (gray-scale images), which is overlaid with photoacoustic images (green-scale images). (f,g) Three-dimensional volume rendering of photoacoustic images (green) and ultrasound images (brown) of subcutaneous inclusion. a.u. = arbitrary units. (h) Photoacoustic signals recorded in vivo increased linearly with the tripod concentration (R2 = 0.96, n = 3 mice, data represent mean ± SD). The background level represents the endogenous signal measured from tissues. (i) Quantitative analysis of the photoacoustic signal (relative to the background signal) (mice n = 3).
Figure 6
Figure 6
Targeting of integrin αvβ3-postitive U87MG tumors in mice by RGD-Au-tripod. (a) The coronal, sagittal, and transverse views of 3D volume rendering of photoacoustic images and ultrasound images of nude mice bearing U87MG tumors were obtained before injection or at 1, 4, 24, and 48 h after intravenous injection of RGD-Au-tripod (200 pmol/kg of mouse body weight, or 2 mg/kg of mouse body weight). (b) The coronal, sagittal, and transverse views of 3D volume rendering of photoacoustic images and ultrasound images of nude mice bearing U87MG tumors were obtained before injection or at 1, 4, 24, and 48 h after coinjection of a blocking dose of c(RGDfC) (21 μmol of c(RGDfC)/kg of mouse body weight) and RGD-Au-tripod (200 pmol/kg of mouse body weight, or 2 mg/kg of mouse body weight). Subtraction images were calculated at the 2-h post-injection image minus the preinjection image (SI Figure S34). (c) Mice injected with RGD-Au-tripod showed significantly higher photoacoustic signal than mice with coinjection of a blocking dose of c(RGDfC) and the same amount of RGD-Au-tripod (p < 0.001, two-sided Student’s t-test). The error bars represent standard error (n = 3 per group). (d) The perspective views of 3D volume rendering of photoacoustic images (green) and ultrasound images (brown) of tumors.

References

    1. Rudin M.; Weissleder R. Nat. Rev. Drug Discovery 2003, 2, 123. - PubMed
    1. Ferrari M. Nat. Rev. Cancer 2005, 5, 161. - PubMed
    1. Weissleder R. Science 2006, 312, 1168. - PubMed
    1. Willmann J. K.; van Bruggen N.; Dinkelborg L. M.; Gambhir S. S. Nat. Rev. Drug Discovery 2008, 7, 591. - PubMed
    1. James M. L.; Gambhir S. S. Physiol. Rev. 2012, 92, 897. - PubMed

Publication types