. 2014 Feb 4;15(2):R31.
doi: 10.1186/gb-2014-15-2-r31.

Accounting for cellular heterogeneity is critical in epigenome-wide association studies

Accounting for cellular heterogeneity is critical in epigenome-wide association studies

Andrew E Jaffe et al. Genome Biol. .

Abstract

Background: Epigenome-wide association studies of human disease and other quantitative traits are becoming increasingly common. A series of papers reporting age-related changes in DNA methylation profiles in peripheral blood have already been published. However, blood is a heterogeneous collection of different cell types, each with a very different DNA methylation profile.

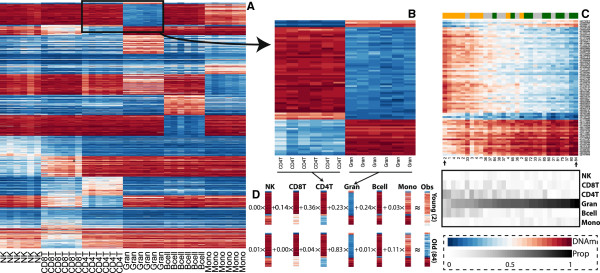
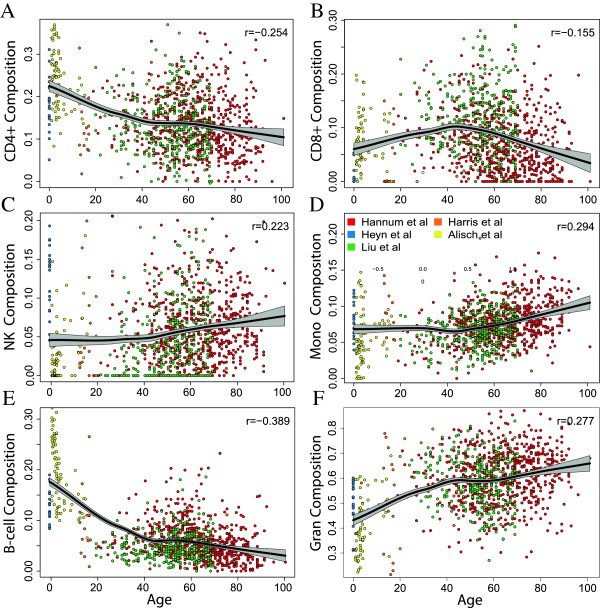
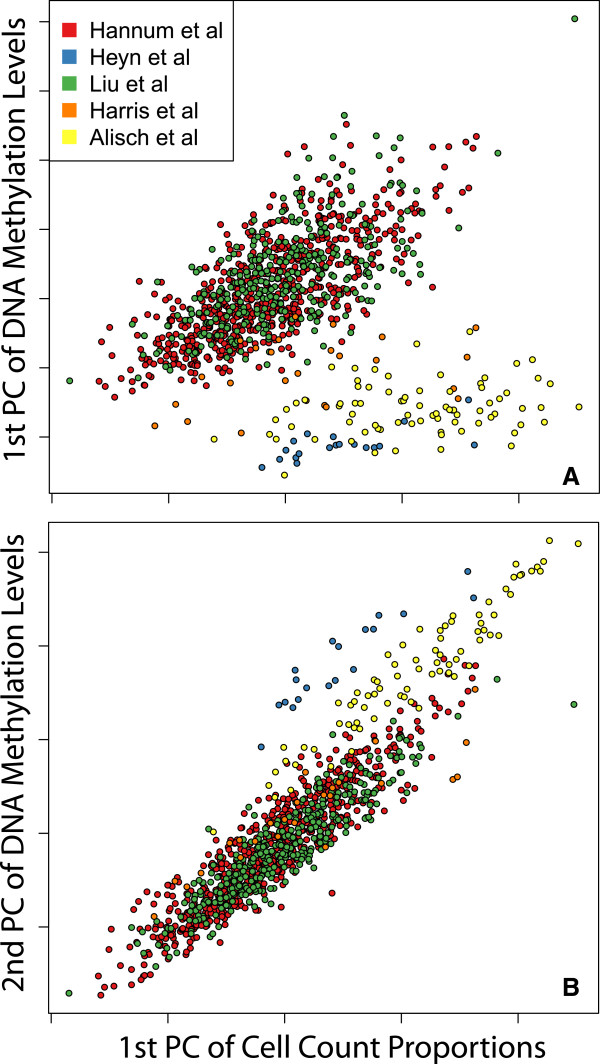
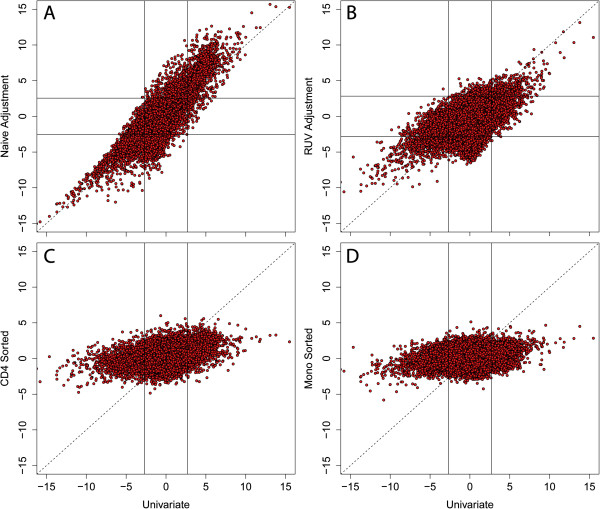
Results: Using a statistical method that permits estimating the relative proportion of cell types from DNA methylation profiles, we examine data from five previously published studies, and find strong evidence of cell composition change across age in blood. We also demonstrate that, in these studies, cellular composition explains much of the observed variability in DNA methylation. Furthermore, we find high levels of confounding between age-related variability and cellular composition at the CpG level.

Conclusions: Our findings underscore the importance of considering cell composition variability in epigenetic studies based on whole blood and other heterogeneous tissue sources. We also provide software for estimating and exploring this composition confounding for the Illumina 450k microarray.


Figures

Figure 1
Figure 1
Illustration of how blood composition drives observed age differences. (A) Heatmap of the cell sorted data shows very clear and consistent DNAm profiles for each cell type. We show 600 probes selected for estimating composition proportions used to demonstrate differences here. (B) To simplify the illustration we selected a section of (A) displaying only the two most abundant cell types: CD4+ T cells and granulocytes. (C) Heatmap of a randomly selected sample of 30 whole blood samples (from the data in Additional file 1) across three age groups (10 per group): between 1 and 5 years of age, between 30 and 40, greater than 60 years. The same probes as in (B) are used. When the samples are ordered by their estimated granulocyte proportion, the samples roughly cluster by age and a similar pattern to (B) is observed. The estimated cell count proportions for each of the samples are shown below. Note the strong confounding between age and cell composition. (D) For the two samples highlighted with an arrow in (C), we show how a weighted average of the cell type profiles can reconstruct the observed DNAm profiles. The numbers shown are the estimated proportions. Note how different weights (cell counts) for old and young result in very different observed DNAm patterns. Note that the differences in CD4+ T cells and granulocytes drive much of the differences in DNAm. NK, CD56+ natural killer cells; CD8T, CD8+ T cells; CD4T, CD4+ T cells, Gran, granulocytes; Bcell, CD19+ B cells; Mono, CD14+ monocytes; DNAm, proportion of DNA methylation at individual CpGs (Illumina 'beta' values, bound between 0 and 1); Prop, cell count proportion, between 0 and 1 for each component, such that they sum to 1.
Figure 2
Figure 2
Cellular composition changes across the lifespan. Estimated cellular composition proportions are plotted against age for (A) CD4+ T cells, (B) CD8+ T cells, (C) natural killer (NK) cells, (D) monocytes (Mono), (E) B cells, and (F) granulocytes (Gran). Color indicates the data source, which are described in Additional file 1. The black lines are curves fit to data with local weighted regression (loess) with confidence intervals in grey. Spearman correlation coefficients are reported for each composition proportion estimate and age.
Figure 3
Figure 3
Cellular composition is a major source of variability in DNAm datasets in whole blood. Principal components (PCs) (A) 1 and (B) 2 of the 456,655 DNAm probes (y-axis) and the first PC of the empirical cell counts (x-axis) are highly correlated. The first PC of the DNAm data explains 10.9% of the variance, and the second explains 9.3% of the variance. Color indicates data source, which are described in Additional file 1.
Figure 4
Figure 4
Confounding between cellular composition and age at the CpG level. Comparisons between resulting t-statistics for age on DNA methylation levels in Hannum et al. [10] using (A) naïve (for example, including cell composition estimates as covariates in regression models), (B) two-step Remove Unwanted Variation (RUV), (C) flow-sorted CD4+ T cells and (D) flow-sorted monocytes compared to the effect of age on DNAm in a univariate model. The univariate and naïve models also adjusted for processing plate, which was a very strong confounder. Here, analysis with RUV attenuates the association between DNAm and age. The solid lines indicate the resulting t-statistic cutoff for false discovery rate <5% - no probes were significant at this threshold in the cell sorted data. All panels contain probes present on both the Illumina 450k and 27k (n = 24,692) to facilitate comparisons to age associations in the flow-sorted cellular populations.

References

    1. Rakyan VK, Down TA, Balding DJ, Beck S. Epigenome-wide association studies for common human diseases. Nat Rev Genet. 2011;12:529–541. - PMC - PubMed
    1. Jaffe AE, Murakami P, Lee H, Leek JT, Fallin MD, Feinberg AP, Irizarry RA. Bump hunting to identify differentially methylated regions in epigenetic epidemiology studies. Int J Epidemiol. 2012;41:200–209. - PMC - PubMed
    1. Teschendorff AE, Menon U, Gentry-Maharaj A, Ramus SJ, Gayther SA, Apostolidou S, Jones A, Lechner M, Beck S, Jacobs IJ, Widschwendter M. An epigenetic signature in peripheral blood predicts active ovarian cancer. PLoS One. 2009;4:e8274. - PMC - PubMed
    1. Rakyan VK, Beyan H, Down TA, Hawa MI, Maslau S, Aden D, Daunay A, Busato F, Mein CA, Manfras B, Dias KR, Bell CG, Tost J, Boehm BO, Beck S, Leslie RD. Identification of type 1 diabetes-associated DNA methylation variable positions that precede disease diagnosis. PLoS Genet. 2011;7:e1002300. - PMC - PubMed
    1. Liu Y, Aryee MJ, Padyukov L, Fallin MD, Hesselberg E, Runarsson A, Reinius L, Acevedo N, Taub M, Ronninger M, Shchetynsky K, Scheynius A, Kere J, Alfredsson L, Klareskog L, Ekstrom TJ, Feinberg AP. Epigenome-wide association data implicate DNA methylation as an intermediary of genetic risk in rheumatoid arthritis. Nat Biotechnol. 2013;31:142–147. - PMC - PubMed

Publication types