. 2014 Feb 4;15(2):R32.
doi: 10.1186/gb-2014-15-2-r32.

KDM5B focuses H3K4 methylation near promoters and enhancers during embryonic stem cell self-renewal and differentiation

KDM5B focuses H3K4 methylation near promoters and enhancers during embryonic stem cell self-renewal and differentiation

Benjamin L Kidder et al. Genome Biol. .

Abstract

Background: Pluripotency of embryonic stem (ES) cells is controlled in part by chromatin-modifying factors that regulate histone H3 lysine 4 (H3K4) methylation. However, it remains unclear how H3K4 demethylation contributes to ES cell function.

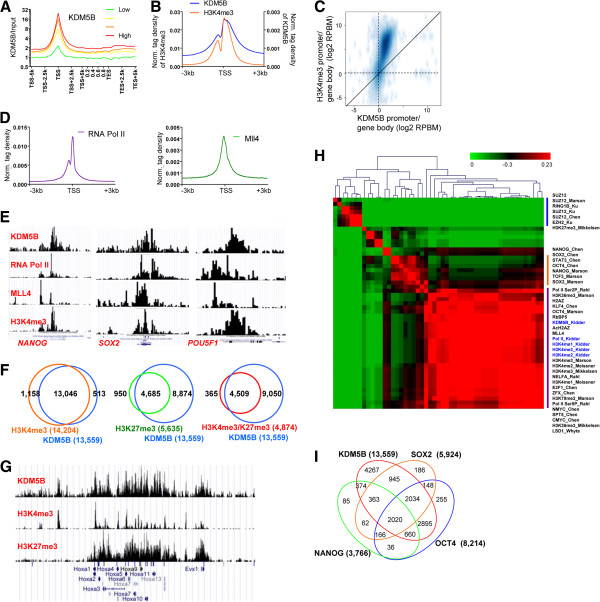
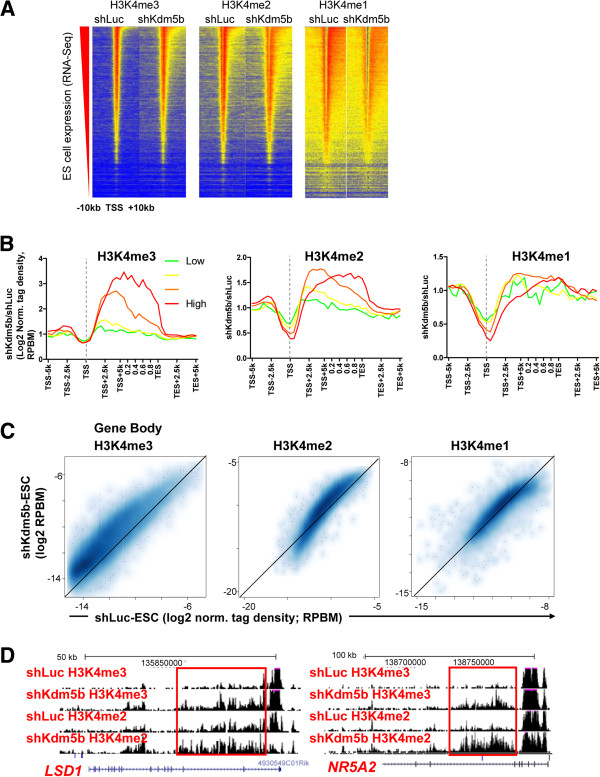
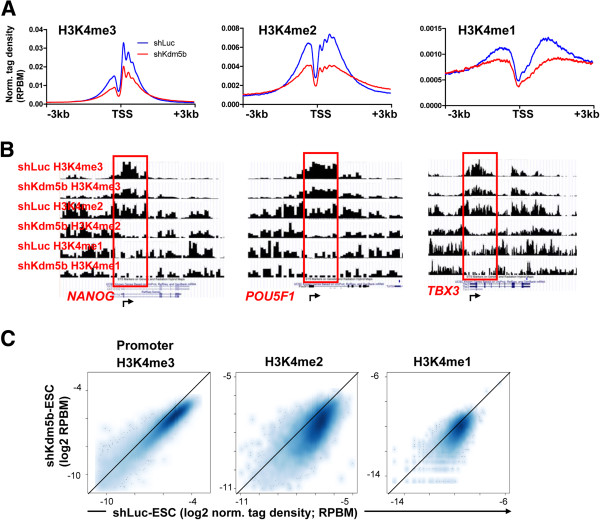
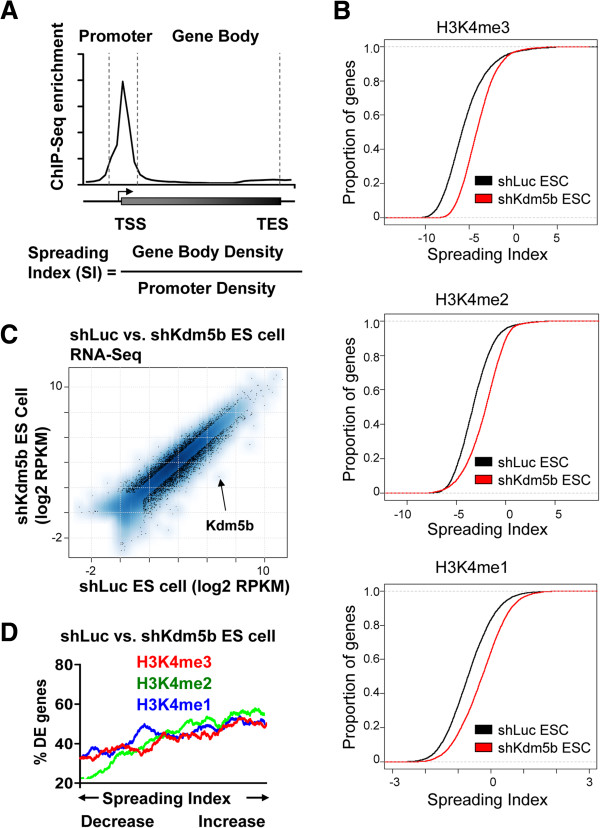
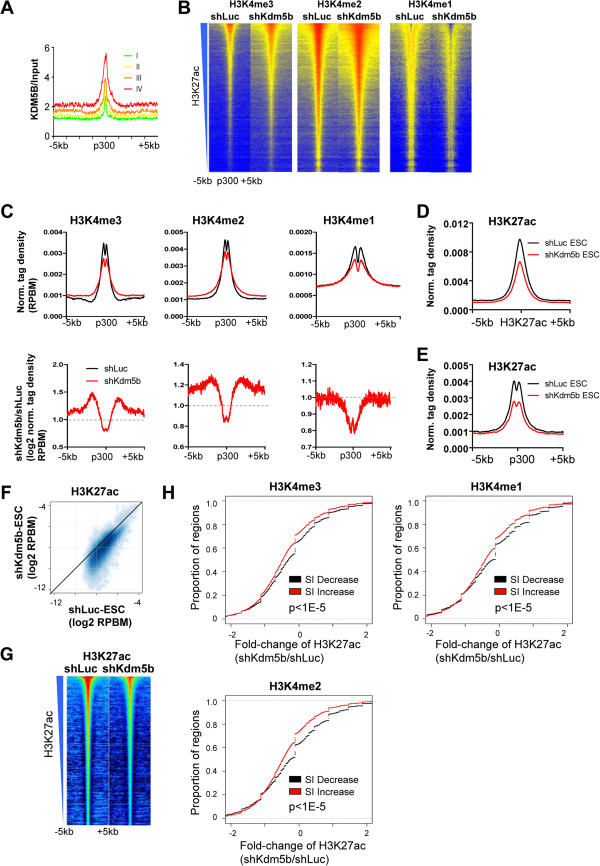
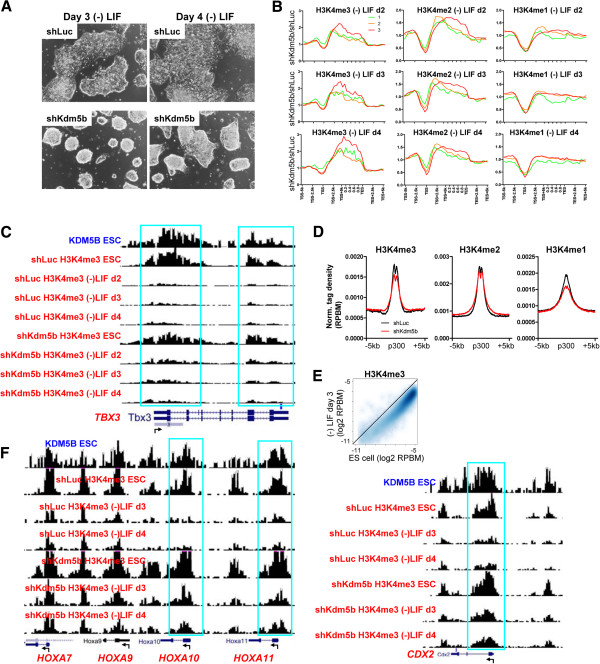
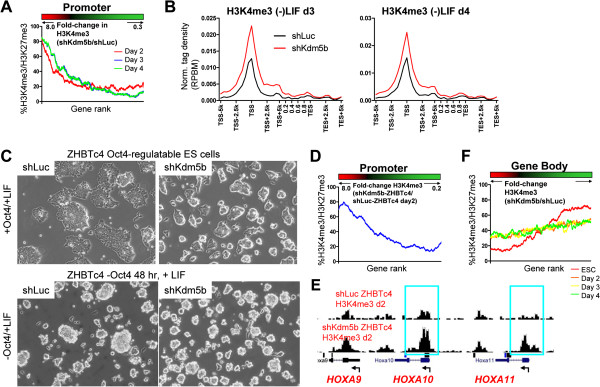
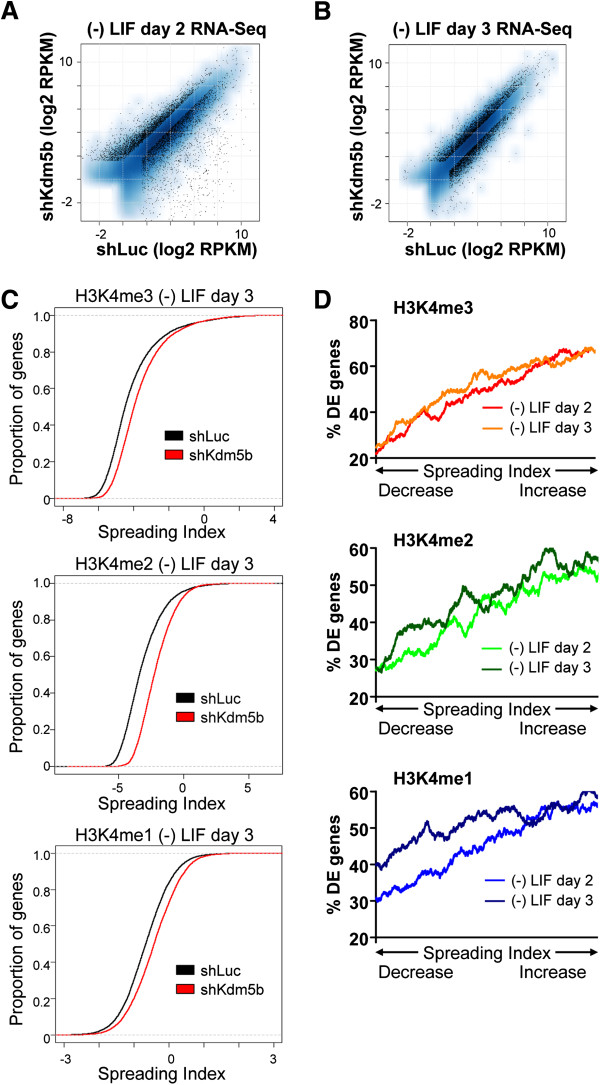
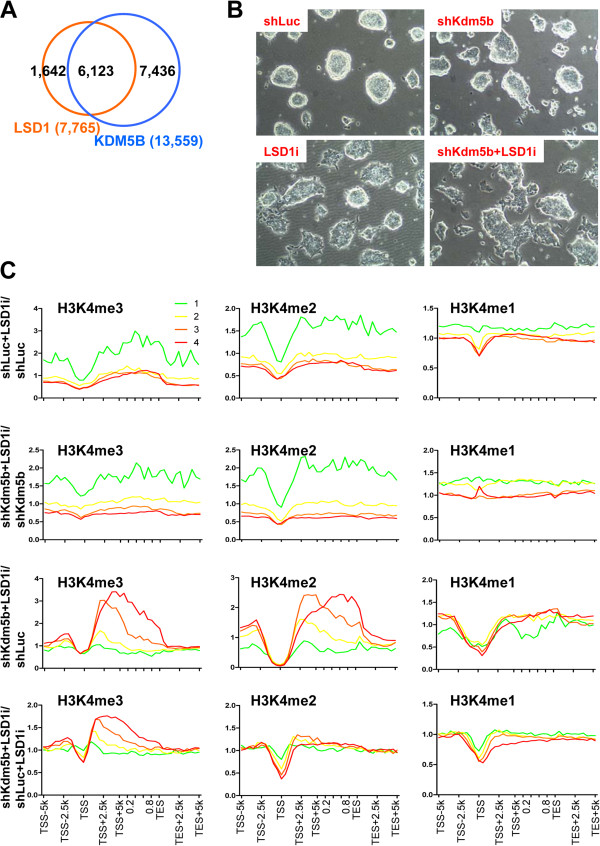
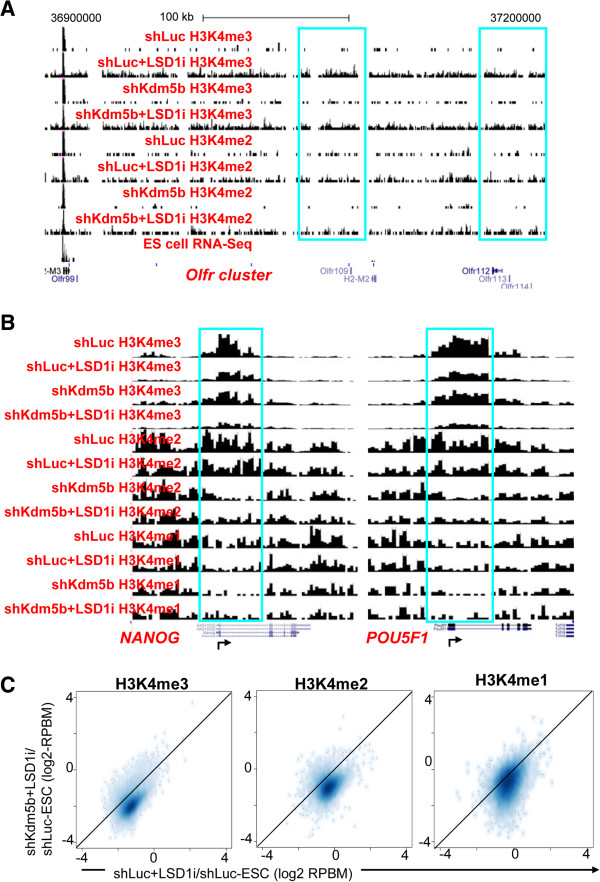
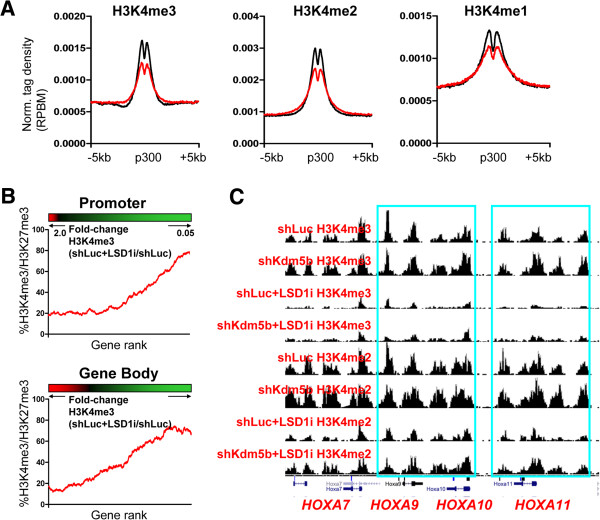
Results: Here, we show that KDM5B, which demethylates lysine 4 of histone H3, co-localizes with H3K4me3 near promoters and enhancers of active genes in ES cells; its depletion leads to spreading of H3K4 methylation into gene bodies and enhancer shores, indicating that KDM5B functions to focus H3K4 methylation at promoters and enhancers. Spreading of H3K4 methylation to gene bodies and enhancer shores is linked to defects in gene expression programs and enhancer activity, respectively, during self-renewal and differentiation of KDM5B-depleted ES cells. KDM5B critically regulates H3K4 methylation at bivalent genes during differentiation in the absence of LIF or Oct4. We also show that KDM5B and LSD1, another H3K4 demethylase, co-regulate H3K4 methylation at active promoters but they retain distinct roles in demethylating gene body regions and bivalent genes.

Conclusions: Our results provide global and functional insight into the role of KDM5B in regulating H3K4 methylation marks near promoters, gene bodies, and enhancers in ES cells and during differentiation.


Figures

Figure 1
Figure 1
KDM5B occupies active genes, pluripotency regulators, and bivalent genes in ES cells. KDM5B is associated with transcriptional start sites (TSSs) and gene body regions of highly expressed genes in ES cells. (A) ChIP-Seq tag density of KDM5B binding at TSS normalized by input (log2 scale) of all refseq genes sorted into quartiles based on their mRNA expression level in ES cells. (B) ChIP-Seq tag densities of KDM5B and H3K4me3 around TSSs in ES cells. KDM5B binding profiles are similar to H3K4me3 marks near TSS regions, while KDM5B occupancy is enriched more in gene body regions relative to H3K4me3. (C) Scatter plot of the ratio of relative tag densities of KDM5B and H3K4me3 in promoter versus gene body regions. (D) RNA polymerase II and MLL4 are also enriched at TSS regions. (E) KDM5B occupies promoters of pluripotency-related genes in ES cells (Pou5f1/Oct4, Sox2, and Nanog). ChIP-Seq binding profiles of KDM5B, H3K4me3, RNA polymerase II, and Mll4 at core pluripotency genes. (F) Venn diagrams showing the co-occupancy of KDM5B and H3K4me3 (left panel), H3K27me3 (middle panel), and both modifications (right panel) at promoter regions. (G) Example of KDM5B binding at promoters marked with H3K4me3 and H3K27me3 (for example, HoxA cluster). (H) Correlation matrix of KDM5B binding with an assortment of TFs and epigenetic modifiers that are highly expressed in ES cells. Hierarchical clustering heat map generated by evaluating pair-wise affinities at promoters between ChIP-Seq datasets generated from this study (KDM5B, H3K4me3, RNAPII) and from published datasets [3,35-39]. AutoSOME [40] was used to generate pair-wise affinity values. (I) Venn diagrams showing co-occupancy of KDM5B, OCT4, SOX2, and NANOG at promoter regions.
Figure 2
Figure 2
KDM5B regulates H3K4 methylation at gene body regions. Knockdown of Kdm5b transcripts results in altered H3K4 methylation profiles at promoters and enhancers and within gene body regions. (A) Heat map density of ChIP-Seq data at refseq genes sorted according to their absolute expression in ES cells. shKdm5b ES cells exhibit increased H3K4me3/2 methylation in gene body regions and decreased H3K4me3/2/1 methylation at promoter regions. (B) Correlation between changes in gene body histone methylation and expression level. Log2 fold change normalized tag density ratios (shKdm5b/shLuc) of H3K4me3, H3K4me2, and H3K4me1 at all refseq genes, which were sorted into four groups based on their absolute expression level in ES cells (red line, highest 25% expressed; green line, lowest 25% expressed). (C) Scatter plot of gene body densities of H3K4me3/2/1 in shLuc and shKdm5b ES cells. (D) UCSC genome browser examples of altered profiles of H3K4me3/2 within gene bodies of pluripotency-related genes such as Lsd1 and Nr5a2 in shKdm5b ES cells.
Figure 3
Figure 3
KDM5B regulates H3K4 methylation at promoters. (A) Log2 normalized tag density ratios (reads per base pair per million reads (RPBM)) of H3K4me3, H3K4me2, and H3K4me1 at TSSs of all refseq genes. (B) Browser view of altered profiles of H3K4me3/2/1 at promoters of genes such as Nanog, Pou5f1, and Tbx3. (C) Scatter plot of ChIP-Seq tag densities of H3K4me3/2/1 peaks in promoter regions in shLuc and shKdm5b ES cells.
Figure 4
Figure 4
Spreading of H3K4me3 to gene bodies leads to defects in gene expression in ES cells. (A) Schematic representation describing the calculation used to determine the SI of genes marked by H3K4 methylation. The promoter bin is defined as a 1 kb, 1.5 kb, or 3 kb window around the TSS of genes marked by H3K4me3, H3K4me2, and H3K4me1, respectively, while the transcribed region (gene body) is defined as the region extending to the TES. The SI is calculated from the ratio of the density of H3K4 methylation in the gene body bin to the density of H3K4 methylation in the promoter bin. (B) Empirical cumulative distribution for the SI of H3K4me3 (top panel), H3K4me2 (middle panel), and H3K4me1 (bottom panel) across all genes for shLuc (black) and shKdm5b (red) ES cells. Y-axis shows the percentage of genes that exhibit a SI less than the value specified by the x-axis. A line shifted to the right means a systematic increase in the spreading index. P-value for all <1E-5 (Kolmogorov-Smirnov test). Note the increased SI for genes marked by H3K4me3, H3K4me2, and H3K4me1 in shKdm5b ES cells. (C) Scatter plot of gene expression measured by RPKM (reads per kilobases of exon model per million reads). Log2-adjusted differentially expressed (DE) genes (>1.5-fold; false discovery rate <0.001; RPKM >11) are shown in black. (D) Spreading of H3K4 methylation into gene bodies is associated with defects in gene expression in Kdm5b knockdown ES cells. Genes are ordered on the x-axis from left to right based on the fold change in their SI (shKdm5b/shLuc; ES cells) from low to high. A sliding window of 1,000 genes was used to calculate the percentage of DE genes (y-axis). The analysis was performed independently using SIs calculated for H3K4me3 (red), H3K4me2 (green), and H3K4me1 (blue) marks.
Figure 5
Figure 5
KDM5B controls enhancer activity by regulating H3K4 methylation. (A) KDM5B binding at p300 enhancer sites sorted by enrichment level of acetylated H3K27 (H3K27ac). (B) Heat map density profiles of H3K4me3/2/1 around intergenic p300 binding sites, sorted by H3K27ac levels. (C) Top: average profile of H3K4me3/2/1 density at intergenic p300 sites in shLuc and shKdm5b ES cells. Bottom: log2 fold change normalized tag density ratios (shKdm5b/shLuc) of H3K4me3, H3K4me2, and H3K4me1 at p300 enhancers. RPBM, reads per base pair per million reads. (D) Average profiles of H3K27ac tag densities around H3K27ac peaks in shLuc and shKdm5b ES cells. (E) Average profiles of H3K27ac tag densities of H3K27ac around p300 binding sites (proxies of enhancers) in shLuc and shKdm5b ES cells. (F) Scatter plot of H3K27ac tag densities in shLuc and shKdm5b ES cells. (G) Heat map density profiles of H3K27ac peaks, sorted by H3K27ac levels. (H) Spreading of H3K4 methylation into enhancer shores in Kdm5b knockdown ES cells is associated with a decrease in H3K27ac levels. Shown are empirical cumulative distributions for the change in H3K27ac (shKdm5b/shLuc) across two groups of enhancers sorted by changes in spreading indices, calculated independently for H3K4me3 (left panel), H3K4me2 (middle panel) or H3K4me1 (right panel). Y-axis shows the percentage of enhancers that exhibit a change in H3K27ac density less than the value specified by the x-axis. A line shifted to the left means a systematic decrease in H3K27ac levels. P-value for all <1E-5 (Kolmogorov-Smirnov test).
Figure 6
Figure 6
KDM5B regulates H3K4 methylation during differentiation. (A) ES cells cultured in the absence of LIF for 3 to 4 days to induce differentiation. Note the loss of normal three-dimensional colony morphology of shLuc ES cells at day 3 of differentiation, while shKdm5b ES cells maintained their normal three-dimensional colony morphology in the absence of LIF. (B) Correlation between changes in histone methylation and expression level. Fold change normalized tag density ratios (shKdm5b/shLuc) of H3K4me3, H3K4me2, and H3K4me1 at all refseq genes, which were sorted into three groups based on their expression level (red line, highest expressed; green line, lowest expressed). (C) UCSC genome browser view of H3K4me3/2/1 marks at the self-renewal gene Tbx3 during differentiation. shKdm5b ES cells have altered H3K4me3/2/1 levels relative to shLuc ES cells. (D) Average profile of H3K4me3/2/1 densities at p300 enhancer regions following 4 days of shLuc and shKdm5b ES cell differentiation. RPBM, reads per base pair per million reads. (E) Promoter density of H3K4me3 in ES cells and day 3 differentiated ES cells. (F) UCSC browser view of H3K4me3 density at HoxA cluster genes during differentiation. Note the delayed decrease of H3K4me3 levels during shKdm5b ES cell differentiation relative to shLuc ES cells.
Figure 7
Figure 7
KDM5B regulates H3K4 methylation at bivalent genes during differentiation without LIF and Oct4. (A) Relationship between changes in promoter H3K4me3 density during differentiation and the percentage of genes with bivalent marks (H3K4me3/H3K27me3), using a sliding window of 500 genes (red, increased H3K4me3; black, no-change in H3K4me3; green, decreased H3K4me3). (B) Average profile of H3K4me3 density at genes with increased H3K4me3 during shKdm5b differentiation. RPBM, reads per base pair per million reads. (C)  Oct4-regulatable ES cells (ZHBTc4) infected with shLuc or shKdm5b lentiviral particles were (D) cultured in the presence of doxycycline to downregulate OCT4 levels and induce differentiation. Relationship between changes in promoter H3K4me3 density during differentiation in the absence of OCT4 and KDM5B and the percentage of genes with bivalent marks (red, increased H3K4me3; black, no-change in H3K4me3; green, decreased H3K4me3). (E) Browser view of H3K4me3 density following differentiation of shKdm5b ZHBTc4 ES cells. (F) Relationship between changes in gene body H3K4me3 density during differentiation and the percentage of genes with bivalent marks.
Figure 8
Figure 8
Spreading of H3K4me3 to gene bodies leads to defects in gene expression during ES cell differentiation. Scatter plot of gene expression measured by RPKM for shLuc and shKdm5b ES cells differentiated in the absence of LIF for (A) 48 h (day 2) and (B) 72 h (day 3). Log2-adjusted differentially expressed genes (>1.5-fold; FDR <0.001; RPKM >1) are shown in black. (C) Empirical cumulative distribution for the spreading index of H3K4me3 (top panel), H3K4me2 (middle panel), and H3K4me1 (bottom panel) across all genes for shKdm5b knockdown cells (red line) and shLuc control cells (black line) following differentiation for three days after LIF withdrawal. Y-axis shows the percentage of genes that exhibit a spreading index less than the value specified by the x-axis. A line shifted to the right means a systematic increase in the spreading index. P-value for all <1E-5 (Kolmogorov-Smirnov test). (D) Spreading of H3K4me into gene body regions is associated with defects in gene expression during differentiation of KDM5B-depleted ES cells. Genes were ordered on the x-axis from left to right based on the fold change in their SI (shKdm5b/shLuc) from low to high. A sliding window of 1,000 genes was used to calculate the percentage of differentially expressed (DE) genes (y-axis) in KDM5B-depleted cells. The analyses were performed independently using SIs calculated from H3K4me3 (top panel), H3K4me2 (middle panel), and H3K4me1 (bottom panel) marks following two and three days of ES cell differentiation after LIF withdrawal.
Figure 9
Figure 9
KDM5B and LSD1 co-regulate H3K4 methylation in ES cells. (A) Venn diagram showing overlap of KDM5B- and LSD1-bound genes in ES cells. (B) Bright field microscopy of shLuc and shKdm5b ES cells cultured in the presence of 2 μM of the LSD1 inhibitor tranylcypromine/parnate (LSD1i) for 4 days. (C) Correlation between changes in histone methylation and expression level. Fold change normalized tag density ratios of H3K4me3, H3K4me2, and H3K4me1 at refseq genes were sorted into four groups based on their absolute expression level. Note that the lowest expressed genes have increased H3K4me3/2/1 levels in LSD1i-treated ES cells (red line, highest 25% expressed; green line, lowest 25% expressed).
Figure 10
Figure 10
H3K4 methylation profiles in KDM5B-depleted and LSD1-inhibited ES cells. Browser views of H3K4me3/2/1 densities at (A) olfactory receptor and (B) pluripotency genes (Nanog, Pou5f1). (C) Fold change densities of H3K4me3/2/1 peaks in shLuc?+?LSD1i and shKdm5b?+?LSD1i ES cells relative to shLuc ES cells. RPBM, reads per base pair per million reads.
Figure 11
Figure 11
KDM5B and LSD1 regulate H3K4 methylation at promoters and enhancers in ES cells. (A) Average profile of H3K4me3/2/1 density at p300 enhancer regions in LSD1i-treated ES cells (red line) relative to shLuc ES cells (black line). RPBM, reads per base pair per million reads. (B) Relationship between changes in promoter and gene body H3K4me3 density and the percentage of genes with bivalent marks (red, increased H3K4me3; black, no-change in H3K4me3; green, decreased H3K4me3). (C) Genome browser view of H3K4me3 levels at HoxA cluster bivalent genes upon inhibition of LSD1 in ES cells.

References

    1. Boyer LA, Lee TI, Cole MF, Johnstone SE, Levine SS, Zucker JP, Guenther MG, Kumar RM, Murray HL, Jenner RG, Gifford DK, Melton DA, Jaenisch R, Young RA. Core transcriptional regulatory circuitry in human embryonic stem cells. Cell. 2005;122:947–956. doi: 10.1016/j.cell.2005.08.020. - DOI - PMC - PubMed
    1. Loh YH, Wu Q, Chew JL, Vega VB, Zhang W, Chen X, Bourque G, George J, Leong B, Liu J, Wong KY, Sung KW, Lee CW, Zhao XD, Chiu KP, Lipovich L, Kuznetsov VA, Robson P, Stanton LW, Wei CL, Ruan Y, Lim B, Ng HH. The Oct4 and Nanog transcription network regulates pluripotency in mouse embryonic stem cells. Nat Genet. 2006;38:431–440. doi: 10.1038/ng1760. - DOI - PubMed
    1. Chen X, Xu H, Yuan P, Fang F, Huss M, Vega VB, Wong E, Orlov YL, Zhang W, Jiang J, Loh YH, Yeo HC, Yeo ZX, Narang V, Govindarajan KR, Leong B, Shahab A, Ruan Y, Bourque G, Sung WK, Clarke ND, Wei CL, Ng HH. Integration of external signaling pathways with the core transcriptional network in embryonic stem cells. Cell. 2008;133:1106–1117. doi: 10.1016/j.cell.2008.04.043. - DOI - PubMed
    1. Ivanova N, Dobrin R, Lu R, Kotenko I, Levorse J, DeCoste C, Schafer X, Lun Y, Lemischka IR. Dissecting self-renewal in stem cells with RNA interference. Nature. 2006;442:533–538. doi: 10.1038/nature04915. - DOI - PubMed
    1. Ang YS, Tsai SY, Lee DF, Monk J, Su J, Ratnakumar K, Ding J, Ge Y, Darr H, Chang B, Wang J, Rendl M, Bernstein E, Schaniel C, Lemischka IR. Wdr5 mediates self-renewal and reprogramming via the embryonic stem cell core transcriptional network. Cell. 2011;145:183–197. doi: 10.1016/j.cell.2011.03.003. - DOI - PMC - PubMed

Publication types

MeSH terms

Associated data