. 2014 Feb 4:14:6.
doi: 10.1186/1471-2342-14-6.

Application of mean-shift clustering to blood oxygen level dependent functional MRI activation detection

Affiliations

Application of mean-shift clustering to blood oxygen level dependent functional MRI activation detection

Leo Ai et al. BMC Med Imaging. .

Abstract

Background: Functional magnetic resonance imaging (fMRI) analysis is commonly done with cross-correlation analysis (CCA) and the General Linear Model (GLM). Both CCA and GLM techniques, however, typically perform calculations on a per-voxel basis and do not consider relationships neighboring voxels may have. Clustered voxel analyses have then been developed to improve fMRI signal detections by taking advantages of relationships of neighboring voxels. Mean-shift clustering (MSC) is another technique which takes into account properties of neighboring voxels and can be considered for enhancing fMRI activation detection.

Methods: This study examines the adoption of MSC to fMRI analysis. MSC was applied to a Statistical Parameter Image generated with the CCA technique on both simulated and real fMRI data. The MSC technique was then compared with CCA and CCA plus cluster analysis. A range of kernel sizes were used to examine how the technique behaves.

Results: Receiver Operating Characteristic curves shows an improvement over CCA and Cluster analysis. False positive rates are lower with the proposed technique. MSC allows the use of a low intensity threshold and also does not require the use of a cluster size threshold, which improves detection of weak activations and highly focused activations.

Conclusion: The proposed technique shows improved activation detection for both simulated and real Blood Oxygen Level Dependent fMRI data. More detailed studies are required to further develop the proposed technique.


Figures

Figure 1
Figure 1
Effect of kernel size on true positive rates for various activation sizes with simulated data. The statistical threshold was held constant at z = 3. A range of kernel sizes was used from 0.05 to 0.50. CNRs used are 0.20, 0.40, 0.60, and 0.80. A: 20 × 20 activation size. B: 10 × 10 activation size. C: 2 × 2 activation size.
Figure 2
Figure 2
Change of false positive rates at different z thresholds using various activation sizes with simulated data. Kernel size was held constant at 0.20. The z thresholds were varied from 0 to 5. CNRs used are 0.20, 0.40, 0.60, and 0.80. A: 20 × 20 activation size. B: 10 × 10 activation size. C: 2 × 2 activation size. D: Activation map consisting of noise only.
Figure 3
Figure 3
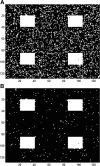
Activation map of CCA and CCA + MSC. A threshold of Z = 1 was applied. CNR of 0.80 was used with kernel size of 0.20. A: CCA activation map. B: CCA + MSC activation map
Figure 4
Figure 4
ROC curves for CCA, CCA + CA, CCA + MSC with different kernel sizes and different activation sizes using simulated data. Kernel sizes are 0.10, 0.20, and 0.50. Activation sizes used are 20 × 20, 10 × 10, and 2 × 2. CNRs used are 0.20, 0.40, 0.60, and 0.80. A: 20 × 20 activation size, kernel size = 0.10 B: 20 × 20 activation size, kernel size = 0.20 C: 20 × 20 activation size, kernel size = 0.50 D: 10 × 10 activation size, kernel size = 0.10 E: 10 × 10 activation size, kernel size = 0.20 F: 10 × 10 activation size, kernel size = 0.50 G: 2 × 2 activation size, kernel size = 0.10 H: 2 × 2 activation size, kernel size = 0.20 I: 2 × 2 activation size, kernel size = 0.50.
Figure 5
Figure 5
Activation of median nerve stimulation detected with CCA, CCA + CA, CCA + MSC. Significance levels were controlled at p = 0.01 for all images. Z thresholds were changed for each technique based on the significance level. A: CCA, Z = 4.8, FWHM = 4 mm B: CCA + CA, Z = 2.6, cluster size threshold = 6 voxels, FWHM = 4 mm C: CCA + MSC, Z = 2, kernel size = 0.05, FWHM = 4 mm D: CCA + MSC, Z = 2, kernel size = 0.10, FWHM = 4 mm E: CCA + MSC, Z = 2, kernel size = 0.15, FWHM = 4 mm F: CCA + MSC, Z = 2, kernel size = 0.20, FWHM = 4 mm G: CCA, Z = 4.8, no filter applied H: CCA + CA, Z = 2.6, cluster size threshold = 4 voxels, no filter applied I: CCA + MSC, Z = 2, kernel size = 0.05, no filter applied J: CCA + MSC, Z = 2, kernel size = 0.10, no filter applied K: CCA + MSC, Z = 2, kernel size = 0.15, no filter applied L: CCA + MSC, Z = 2, kernel size = 0.20, no filter applied.

References

    1. Bandettini P, Jesmanowicz A, Wong E, Hyde J. Processing strategies for time-course data sets in functional MRI of the human brain. Magn Reson Med. 1993;30(2):161–173. doi: 10.1002/mrm.1910300204. - DOI - PubMed
    1. Boynton G, Engel S, Glover G, Heeger D. Linear systems analysis of functional magnetic resonance imaging in human. J Neurosci. 1996;16(13):4207–4221. - PMC - PubMed
    1. Bullmore E, Brammer M, Williams SCR, Rabe-Hesketh S, Janot N, David A, Mellers J, Howard R, Sham P. Statistical methods of estimation and inference for functional MR image analysis. Magn Reson Med. 1996;35(2):261–277. doi: 10.1002/mrm.1910350219. - DOI - PubMed
    1. Calhoun V, Adali T, McGinty V, Pekar J, Watson T, Pearlson G. fMRI Activation in a Visual-Perception Task. Network of Areas Detected Using the General Linear Model and Independent Components Analysis. NeuroImage. 2001;14(5):1080–1088. doi: 10.1006/nimg.2001.0921. - DOI - PubMed
    1. Cohen M. Parametric Analysis of fMRI Data Using Linear Systems Methods. NeuroImage. 1997;6(2):93–103. doi: 10.1006/nimg.1997.0278. - DOI - PubMed

Publication types