. 2014 Apr;196(4):1303-19.
doi: 10.1534/genetics.114.161661. Epub 2014 Feb 4.

Complex craniofacial changes in blind cave-dwelling fish are mediated by genetically symmetric and asymmetric loci

Affiliations

Complex craniofacial changes in blind cave-dwelling fish are mediated by genetically symmetric and asymmetric loci

Joshua B Gross et al. Genetics. 2014 Apr.

Abstract

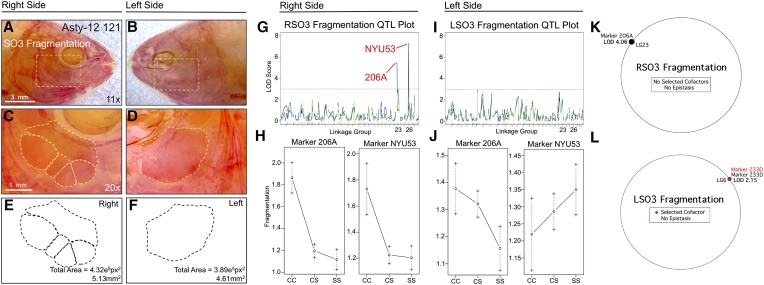
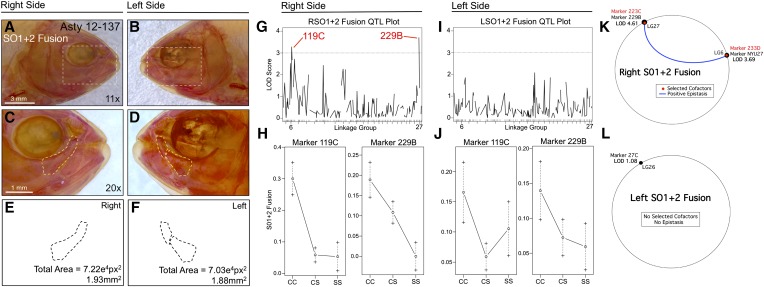
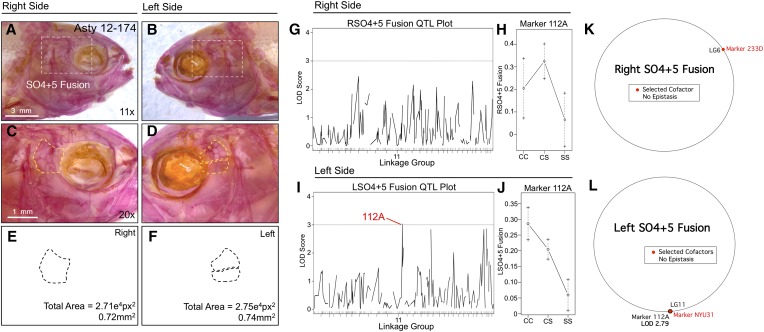
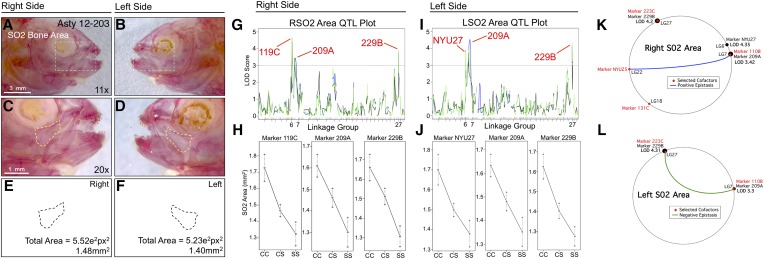
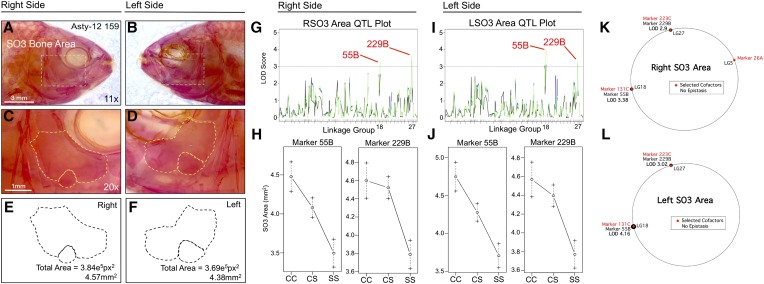
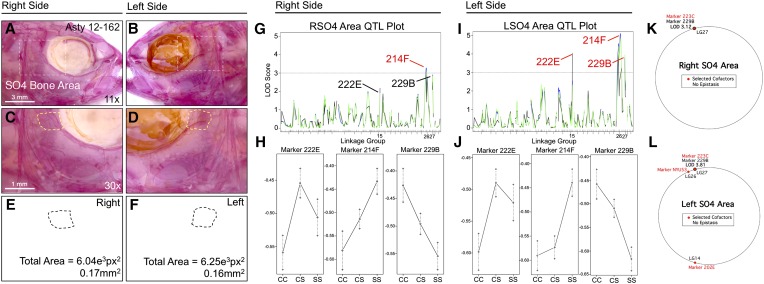
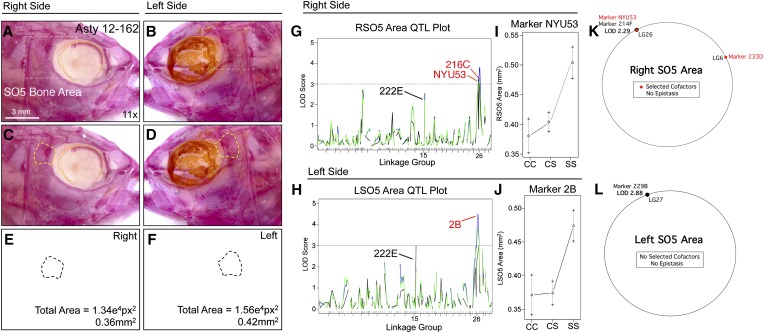
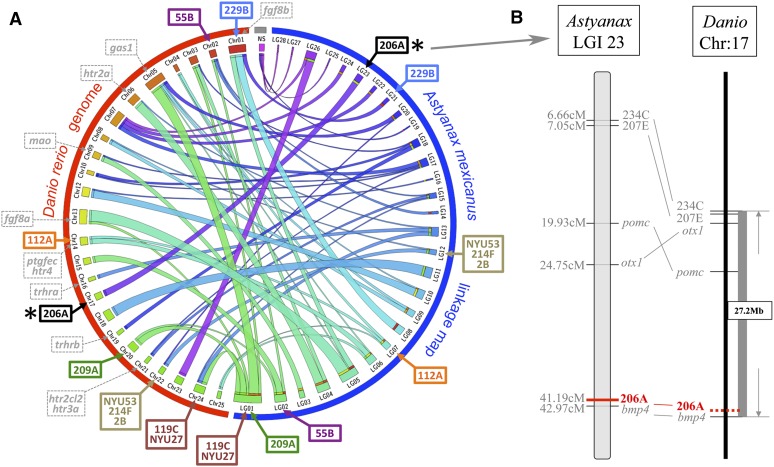
The genetic regulators of regressive craniofacial morphologies are poorly understood. To shed light on this problem, we examined the freshwater fish Astyanax mexicanus, a species with surface-dwelling and multiple independent eyeless cave-dwelling forms. Changes affecting the skull in cavefish include morphological alterations to the intramembranous circumorbital bones encircling the eye. Many of these modifications, however, have evolved separately from eye loss, such as fragmentation of the third suborbital bone. To understand the genetic architecture of these eye-independent craniofacial alterations, we developed and scored 33 phenotypes in the context of an F2 hybrid mapping pedigree bred from Pachón cavefish and surface fish. We discovered several individuals exhibiting dramatic left-right differences in bone formation, such as extensive fragmentation on the right side only. This observation, along with well-known eye size asymmetry in natural cave-dwelling animals, led us to further evaluate left-right genetic differences for the craniofacial complex. We discovered three phenotypes, inclusive of bone fragmentation and fusion, which demonstrated a directional heritable basis only on one side. Interestingly, the overall areas of affected bones were genetically symmetric. Phenotypic effect plots of these novel craniofacial QTL revealed that cave alleles are associated with abnormal conditions such as bony fusion and fragmentation. Moreover, many linked loci overlapped with other cave-associated traits, suggesting regressive craniofacial changes may evolve through linkage or as antagonistic pleiotropic consequences of cave-associated adaptations. These novel findings illuminate significant craniofacial changes accompanying evolution in complete darkness and reveal complex changes to the skull differentially influenced by genetic changes affecting the left and right sides.

Keywords: Astyanax; circumorbital bone series; quantitative trait locus analysis; regressive phenotypic evolution; troglomorphy.


Figures

Figure 1
Figure 1
Fragmentation of the third suborbital bone (SO3) demonstrates a right-sided asymmetric genetic basis. Fragmentation of the SO3 bone (dashed box in A and B) was scored separately on the right (A, C, and E) and left sides (B, D, and F), as demonstrated using specimen 121 from our Asty12 pedigree. Bones were present as either unfragmented (the wild-type surface phenotype) (D) or fragmented elements (C). The total area of this bone (E and F) demonstrated a genetic basis in our pedigree (see Figure 5). Two markers, 206A and NYU53, demonstrated a LOD value >3.0 on the right (G), but not the left (I), side of the head. Effect plots reveal a surface-dominant effect for both markers (H), on the right side only (compare with J). MQM analyses reveal one significant QTL associated with fragmentation on the right side with no selected cofactors (K). On the left side, one insignificant QTL (LOD = 2.15) and cofactor were identified (L). Bars: 3 mm in A and B (11×) and 1 mm in C and D (20×). In G and I, black line shows marker regression, green line shows HK, and blue line shows EM mapping methods, respectively.
Figure 2
Figure 2
Fusion of the first and second suborbital bones (SO1+2) demonstrates a right-sided asymmetric genetic basis. The first and second suborbital bones (dashed box in A and B) were scored separately on the right (A, C, and E) and left sides (B, D, and F), as demonstrated using specimen 137 from our Asty12 pedigree. Bones were present either as separate elements (the wild-type surface phenotype) (D) or fused together (C). The total area of the bones (E and F) did not differ across hybrids. Two markers, 119C and 229B, yielded LOD values >3.0 on the right (G), but not the left (I), side of the head. Effect plots reveal a surface dominant effect for 119C and an intermediate dominant effect for 229B (H), on the right side only (compare with J). MQM analyses reveal the two significant QTL associated with fusion on the right side (NYU27, 229B) with two nearby cofactors (233D, 223C) that demonstrate a positive epistatic interaction (K). On the left side, one insignificant QTL (LOD = 1.08) and no cofactors were identified (L). Bars: 3 mm in A and B (11×) and 1 mm in C and D (20×). Black trace in G and I represents results of MR mapping method.
Figure 3
Figure 3
Fusion of the fourth and fifth suborbital bones (SO4+5) demonstrates a left-sided asymmetric genetic basis. The fourth and fifth suborbital bones (dashed box in A and B) were scored separately on the right (A, C, and E) and left sides (B, D, and F), as demonstrated using specimen 174 from our Asty12 pedigree. Bones were present either as separate elements (the wild-type surface phenotype) (D) or fused together (C). The total area of the bones (E and F) demonstrated a genetic basis in our pedigree (see Figure 6 and Figure 7). One marker, 112A, demonstrated a LOD value >3.0 on the left (I), but not the right (G), side of the head. Effect plots reveal an intermediate dominant effect for 112A (J), on the left side only (compare with H). MQM analyses identified one selected cofactor on the right side (233D) (K). On the left side, the same genetic locus (112A) identified through one-scan mapping was identified using MQM, along with one cofactor (NYU31) (L). Bars: 3 mm in A and B (11×) and 1 mm in C and D (20×). Black trace in G and I represents results of MR mapping method.
Figure 4
Figure 4
The area of second suborbital bone (SO2) demonstrates a symmetric genetic basis. The second suborbital bone (dashed box in A and B) was scored on the right (A, C, and E) and left sides (B, D, and F), as demonstrated using specimen 203 from our Asty12 pedigree. The total area of this bone (dashed outline in C–F) harbored a genetic basis. Three markers, 119C/NYU27, 209A, and 229B, demonstrated LOD values >3.0 on both the right (G) and left (I) sides of the head. Effect plots revealed an intermediate dominant effect for all three markers, irrespective of whether they were evaluated on the right or left side of the head (H and J). MQM analyses identified two of the same significant QTL for both left and right sides (209A and 229B) (K and L). The marker NYU27 was detected on the right side only (LOD = 4.35) (K). Four cofactors were identified for this trait, two of which were shared (110B, 223C) between right and left sides. Interestingly, a positive epistatic effect was detected between marker NYU25 and 110B on the right (blue line, K), while a negative interaction was found between 223C and 110B on the left (green line, L). Bars: 3 mm in A and B (11×) and 1 mm in C and D (20×). In G and I, black line shows marker regression, green line shows HK, and blue line shows EM mapping methods, respectively.
Figure 5
Figure 5
The area of third suborbital bone (SO3) demonstrates a symmetric genetic basis. The third suborbital bone (dashed box in A and B) was scored on the right (A, C, and E) and left sides (B, D, and F), as demonstrated using specimen 159 from our Asty12 pedigree. The total area of this bone (dashed outline of an exemplary bone composed of two fragments in C–F) harbored a genetic basis. Two markers, 55B and 229B, demonstrated LOD values >3.0 on both the right (G) and left (I) sides of the head. Effect plots revealed an intermediate dominant effect for 55B and a cave dominant effect for marker 229B, on both right and left sides of the head (H and J). MQM analyses identified the same two QTL associated with SO3 bone area on the left and right sides (55B, 229B). Three cofactors were found for the right side (26A, 131C, and 223C) (K), only two of which were present on the left side (131C and 223C) (L). No epistatic interactions between cofactors were observed. Bars: 3 mm in A and B (11×) and 1 mm in C and D (20×). In G and I, black line shows marker regression, green line shows HK, and blue line shows EM mapping methods, respectively.
Figure 6
Figure 6
The area of the fourth suborbital bone (SO4) demonstrates a partially symmetric genetic basis. The fourth suborbital bone (dashed box in A and B) was scored on the right (A, C, and E) and left sides (B, D, and F), as demonstrated using specimen 162 from our Asty12 pedigree. The total area of this bone (dashed outline, C–F) harbored a genetic basis. One marker, 214F, demonstrated a LOD value >3.0 on both the right (G) and left (I) sides of the head. Two other markers, 222E and 229B, demonstrated LOD values >3.0 on the left (I), but not the right (G), side of the head. Interestingly, effect plots revealed an intermediate dominant effect for 214F on the right side (H), but a cave dominant effect for this marker on the left side of the head (J). Marker 222E demonstrated a surface dominant effect, while marker 229B demonstrated an intermediate dominant effect on the left side (J). MQM analyses revealed the same QTL associated with SO4 area on the right and left sides (229B); however, only one cofactor was shared between the right and left sides (223C) (K and L). On the left side, two additional cofactors (202E, NYU53) were identified (L). Bars: 3 mm in A and B (11×) and 1 mm in C and D (30×). In G and I, black line shows marker regression, green line shows HK, and blue line shows EM mapping methods, respectively.
Figure 7
Figure 7
The area of fifth suborbital bone (SO5) demonstrates a partially symmetric genetic basis. The fifth suborbital bone (dashed box in A and B) was scored on the right (A, C, and E) and left sides (B, D, and F), as demonstrated using specimen 162 from our Asty12 pedigree. The total area of this bone (dashed outline, C–F) harbored a genetic basis. Markers 216C and NYU53 (which are ∼2 cM apart from one another) both demonstrated a LOD value >3.0 on the right (G) side of the head. A different marker on the same linkage group (2B) demonstrated a significant LOD score for the left side of the head (I). Interestingly, effect plots were nearly identical for the significant markers on the right side (NYU53) (I) and left side (2B) (J). An additional marker, 222E (black, G and H) had a LOD score just below our 3.0 threshold on the left side, and well below 3.0 on the right side. Unexpectedly, MQM analyses revealed two different QTL (on different groups) associated with SO5 area on the right (214F) and left (229B) sides (K and L). On the right, two cofactors were identified (233D and NYU53), while no cofactors were selected on the left (K). Bar, 3 mm (11×). In G and I, black line shows marker regression, green line shows HK, and blue line shows EM mapping methods, respectively.
Figure 8
Figure 8
A syntenic analysis of the position of genomic markers anchored to the Danio rerio genome reveals bmp4 as a possible candidate gene mediating SO3 fragmentation. A Circos representation of synteny between an integrated Astyanax linkage map (blue hemicircle in A) and the D. rerio genome (red hemicircle in A) reveals significant stretches of shared synteny between these teleost species. Few candidate genes selected from prior studies (gray dashed markers, A) of genetic asymmetry overlap with linked microsatellite markers identified from this study. Marker 229B (blue) is associated with SO1+2 fusion and SO2–4 bone areas and is predicted to reside near the gene fgf8b in D. rerio. Additionally, marker 206A (black, asterisk in A), which is associated with SO3 fragmentation, maps near the bmp4 locus (B). This may indicate a potential role for this gene in mediating the asymmetric SO3 bone fragmentation phenotype in Astyanax cavefish. NS, no observed synteny between a whole linkage group and any particular Danio chromosome.

Similar articles

Cited by

References

    1. Abzhanov A., Protas M., Grant B. R., Grant P. R., Tabin C. J., 2004. Bmp4 and morphological variation of beaks in Darwin’s finches. Science 305: 1462–1465. - PubMed
    1. Abzhanov A., Kuo W. P., Hartmann C., Grant B. R., Grant P. R., et al. , 2006. The calmodulin pathway and evolution of elongated beak morphology in Darwin’s finches. Nature 442: 563–567. - PubMed
    1. Albertson R. C., Kocher T. D., 2006. Genetic and developmental basis of cichlid trophic diversity. Heredity 97: 211–221. - PubMed
    1. Albertson R. C., Yelick P. C., 2005. Roles for fgf8 signaling in left–right patterning of the visceral organs and craniofacial skeleton. Dev. Biol. 283: 310–321. - PubMed
    1. Albertson R. C., Yelick P. C., 2007. Fgf8 haploinsufficiency results in distinct craniofacial defects in adult zebrafish. Dev. Biol. 306: 505–515. - PMC - PubMed

Publication types